|
|
|
- Norma Wright
- 5 years ago
- Views:
Transcription
1 Fig. S1
2
3 Fig. S3
4 Fig. S4
5 Fig. S5
6
7
8
9 Fig. S9
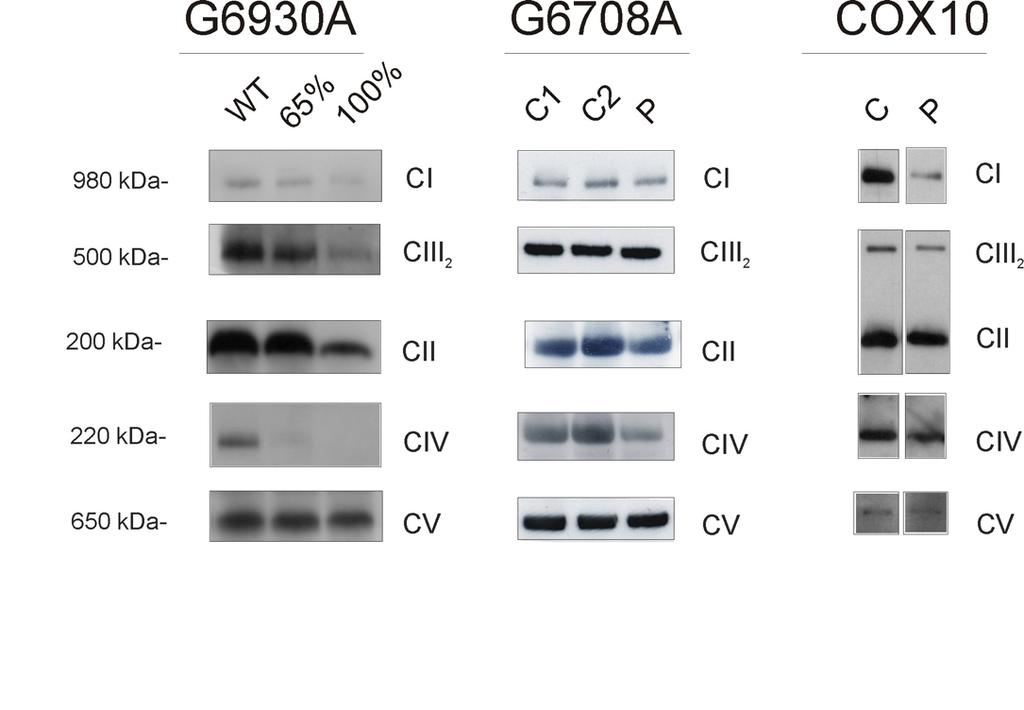
10 Legend for supplementary figures Fig. S1. RFLP analysis of A7339G clones Platelets from the patient were isolated by centrifugation mixed with mtdna-less rho-0 cells and were fused by incubation with polyethylene glycol. After weeks selection in medium lacking uridine and therefore not permitting the growth of rho-0 cells, clones harbouring different amount patients and wild type mtdna were picked. The genotype of individual clones could be checked by restriction fragment length polymorphism (RFLP). A. Map showing a 508 bp mtdna region of A7339G cells amplified by PCR. Digestion with BstBI produces different fragments in wild type (WT) and mutant cells as indicated (in bp). B. Electrophoresis of BstBI-digested PCR products from different clones in an 8% non denaturing polyacrylamide gel. Wild type mtdna is cleaved into three fragments of 192 bp, 82 bp, and 234 bp and mutated mtdna into two fragments of 192 bp and 316 bp. The percentages of mutated mtdna are indicated at the top. U, undigested fragment. Fig. S2. Steady state levels of complex IV subunits in A7339G clones Western Blot analysis of whole cell lysates probed with antibodies against COX I protein at the C-terminus (A) and the N-terminus (B) or against holo COX (C, D) using two different antisera. β-actin was used as loading control. Fig. S3. Steady state levels of assembled complexes in patient samples with complex IV deficiency BN-PAGE followed by western blot analysis of DDM solubilised mitochondria isolated from G6930A WT and G6930A 100% mutant cells (left panel), purified from a skeletal muscle biopsy of a patient with a G6708A nonsense mutation in the CO1 gene (middle) and from a
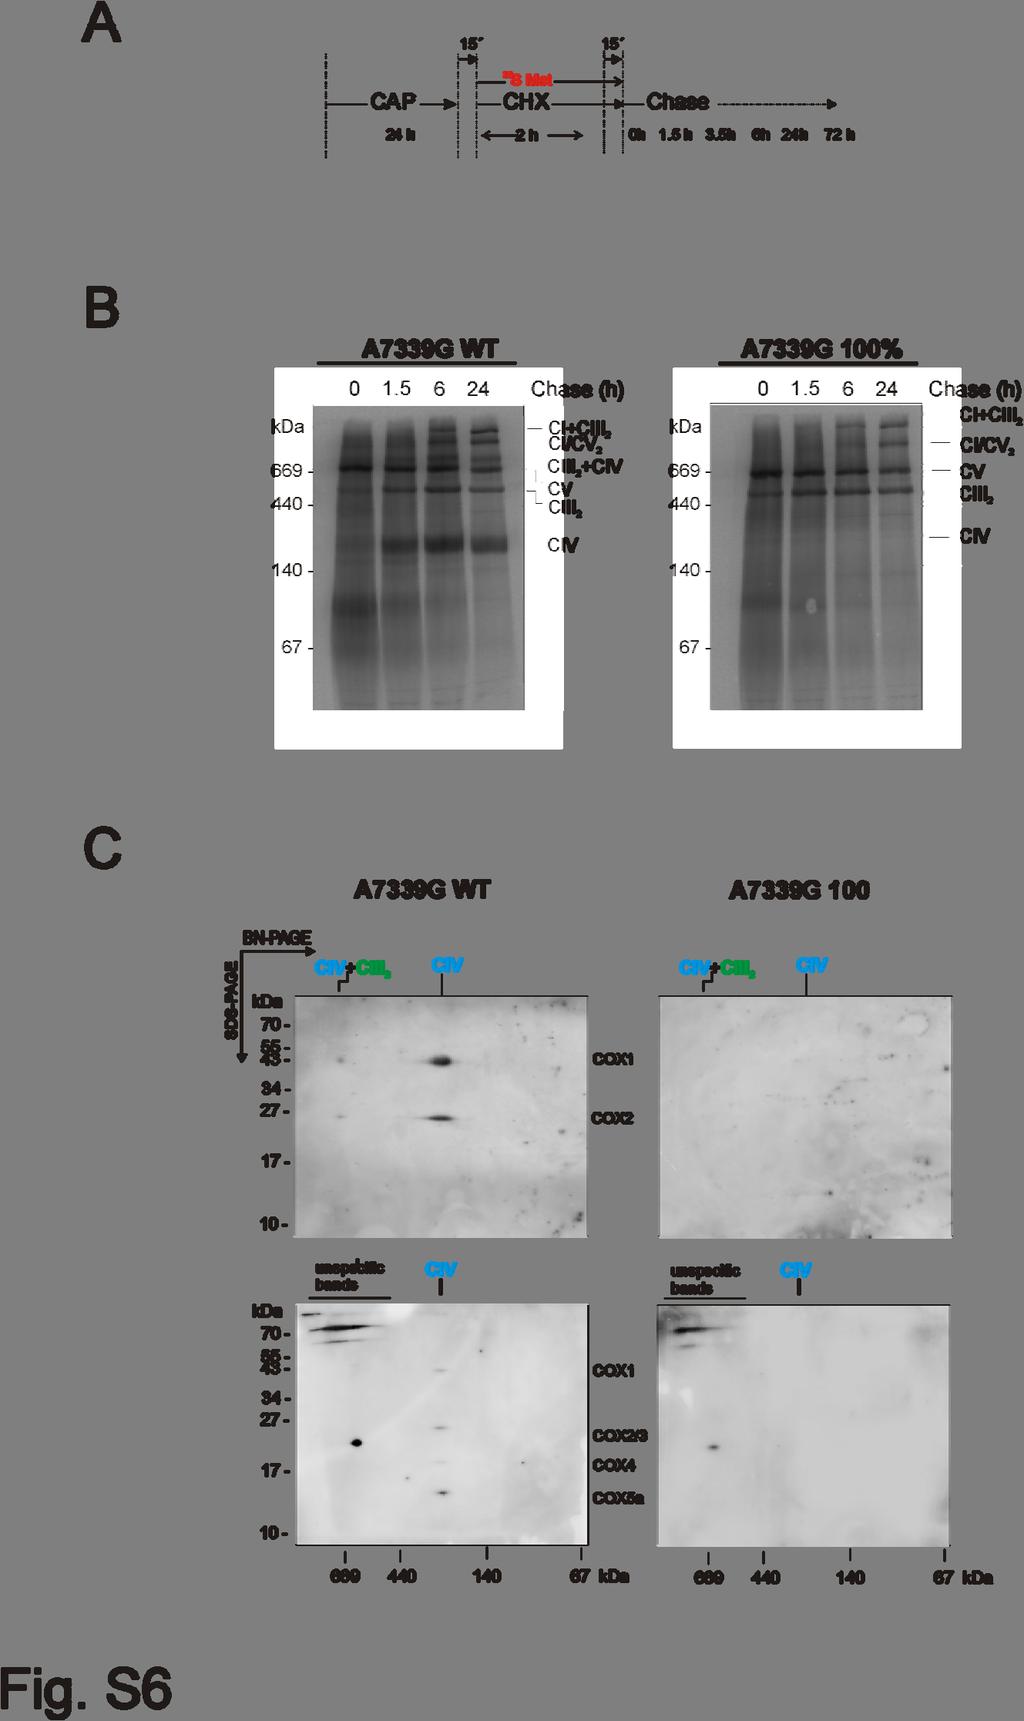
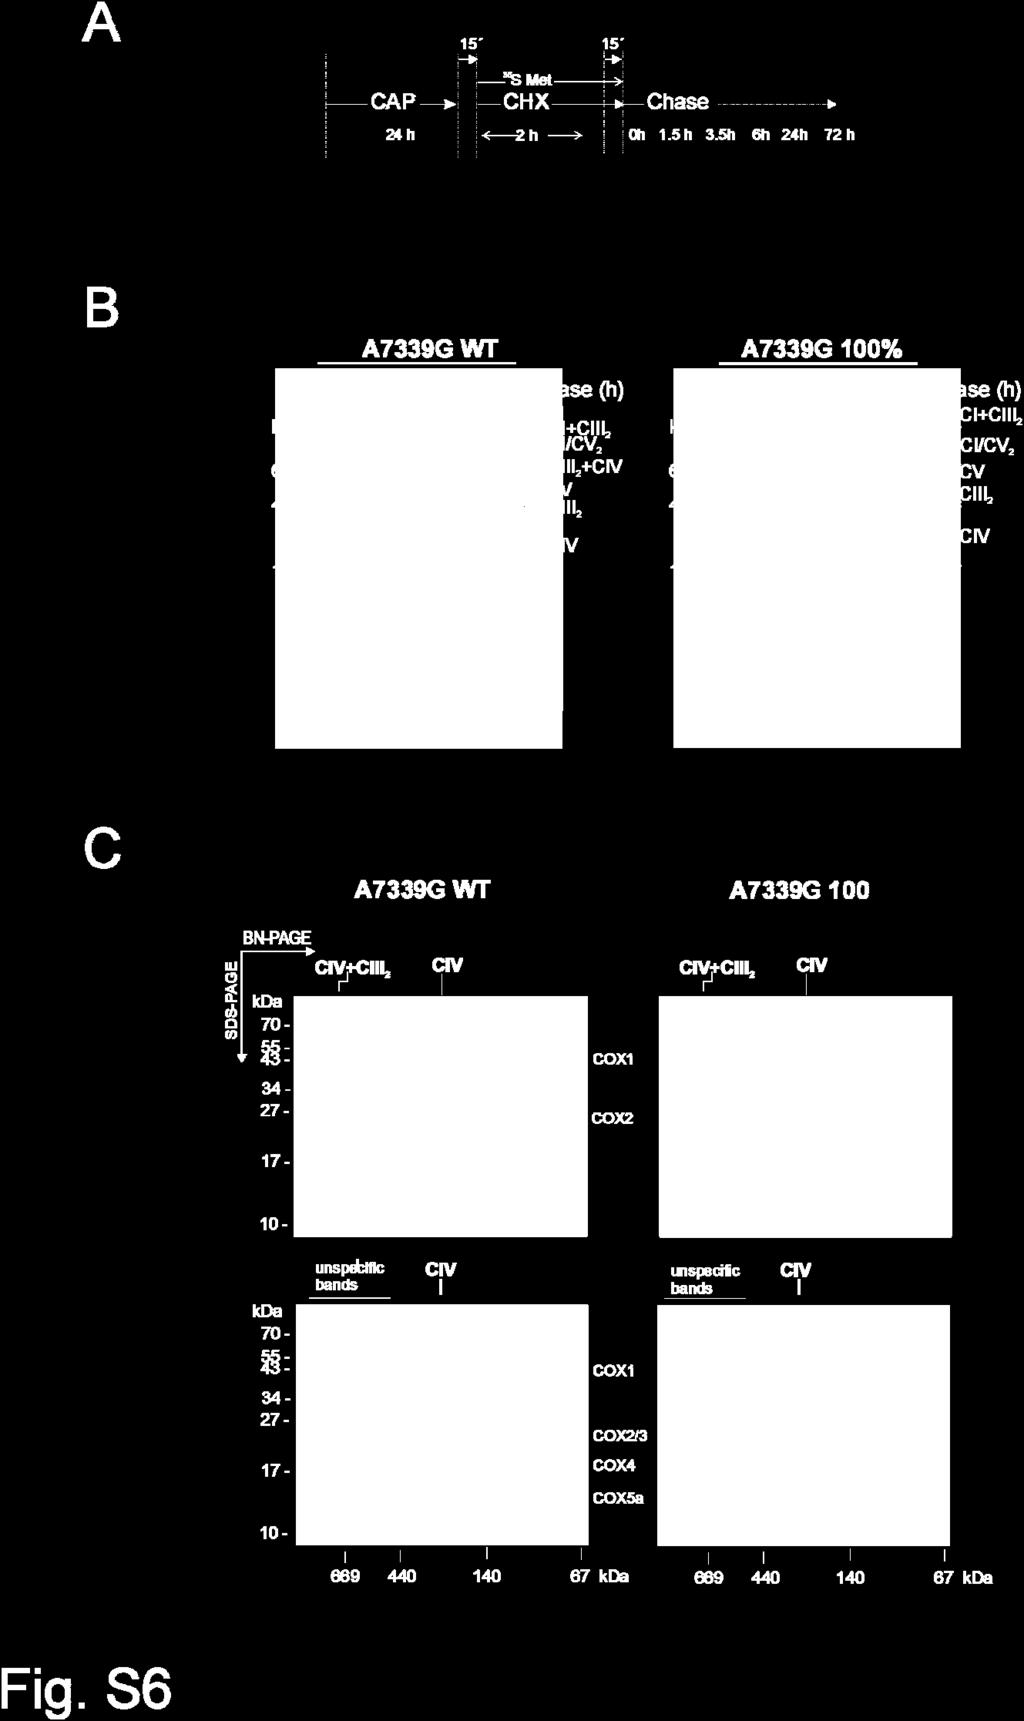
11 muscle biopsy of a patient with a mutation in the complex IV assembly factor COX10 (right panel). Lanes from control and COX10 patient were run in the same gels. Fig. S4. Absence of NDUFS4 and NDUFV2 subunits in the faster migrating CI+CIII 2 * supercomplex BN-PAGE and western blot analysis of digitonin treated mitochondria obtained from A7739G WT and A7339G 100% mutant cells. Blots were probed with antibodies against NDUFA9, NDUFS3, NDUFS4 and NDUFV2 (complex I) and against CORE2 (complex III). Fig S5. Mitochondrial transcript levels and protein synthesis rate in A7339G clones A. Northern Blot analysis of mitochondrial transcripts COX1 and ND1 in A7339G 100% clones, A7339G WT cells and in 143B ρ 0 cells lacking mtdna. Probes against 28S were used as loading control. B. A7339G WT and A7339G 100% clones were pulse labelled with 35 S-methionine for the indicated time, proteins were precipitated with 5% (w/v) trichloroacetic acid, and then the radioactivity of 50 µg protein was counted in a liquid scintillation spectrometer. Fig S6. Time course of RC subunit incorporation into individual RC complexes and into smaller supercomplexes A. Schematic of experimental procedure of pulse chase experiments showing the duration of Chloramphenicol (CAP) and Cyclohexamide (CHX) treatment and the duration of the pulse ( 35 S-methionine) and different chase periods. B. Autoradiogramm of 35 S-methionine labelled mtdna encoded proteins in A7339G WT and A7339G 100% mutant cells after BN- PAGE/SDS-PAGE electrophoresis. Abbreviations as in Fig. 5. C. Western blot analysis to verify COX1 and COX2/3 after BN-PAGE/SDS-PAGE 2D electrophoresis using specific antibodies.
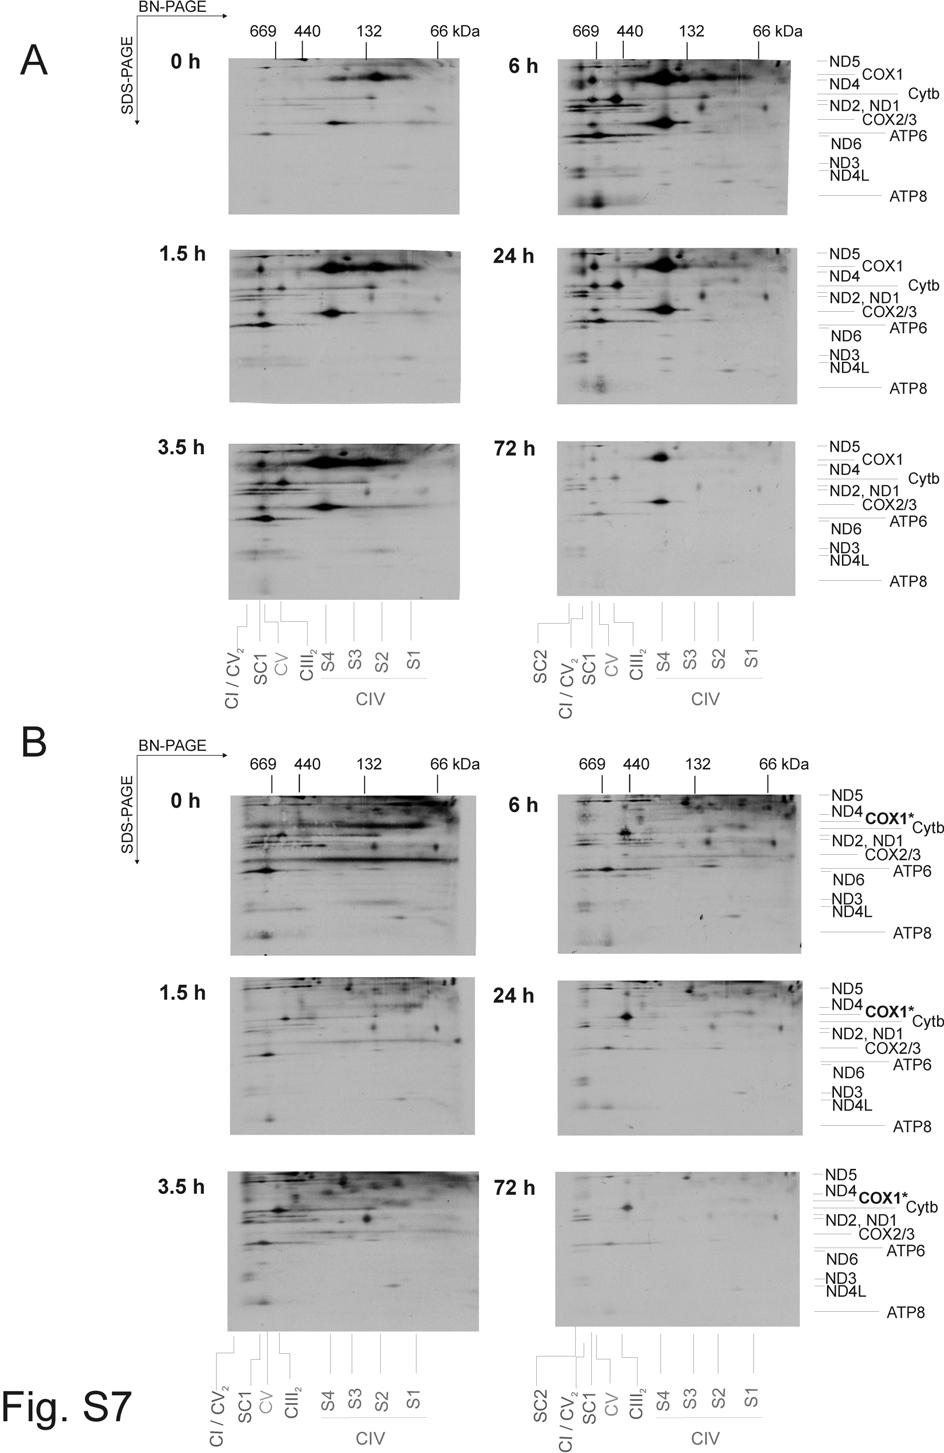
12 Fig S7. Kinetics of incorporation of mtdna encoded proteins into RC complexes and smaller supercomplexes (uncoloured original version of Fig. 5) Two-dimensional display of OXPHOS complexes and supercomplexes after BN PAGE/SDSPAGE 2-D electrophoresis. A7339G WT (A) and A7339G 100% mutant (B) mitochondrial translation products were pulse labeled with 35 S-methionine and chased for the indicated number of hours. Nomenclature above the panels indicates OXPHOS subcomplexes (S), complexes (C) and supercomplexes (SC) and nomenclature on the right site OXPHOS subunits. Abbreviations as in Fig. 5. Fig S8. Specificity of AFG3L2 upregulation and substrate binding A. Western blot analysis of whole cell lysates from G6930A wild type cells treated with mitochondrial chain inhibitors Rotenone (CI), Antimycin (CIII), KCN (CIV), Oligomycin (CV) and with mitochondrial translation inhibitor Chloramphenicol. The membrane was probed with antibodies against mitochondrial protease AFG3L2 and β-actin used as loading control. B. AFG3L2 E408Q transfected and untransfected cells containing wild type mtdna or 100% mutated mtdna of the A7339G were pulse labelled with 35 S-methionine in the presence of emetine, followed by isolation of mitochondria. Mitochondrial extracts of A7339G wt and 100% mutant cells were fractionated by chromatography. Autoradiogram of mitochondrial extract lysates before purification and eluted fractions. The -35 AA truncated COX1 protein is indicated with *. C. Western Blot analysis of G6930A 100% clones with or without transfection with AFG3L2 E408Q and of control cells (Ctrl) treated with Staurosporine (STS) to induce apoptosis. Membrane was probed with an antibody against caspase 3 against β-actin as loading control.
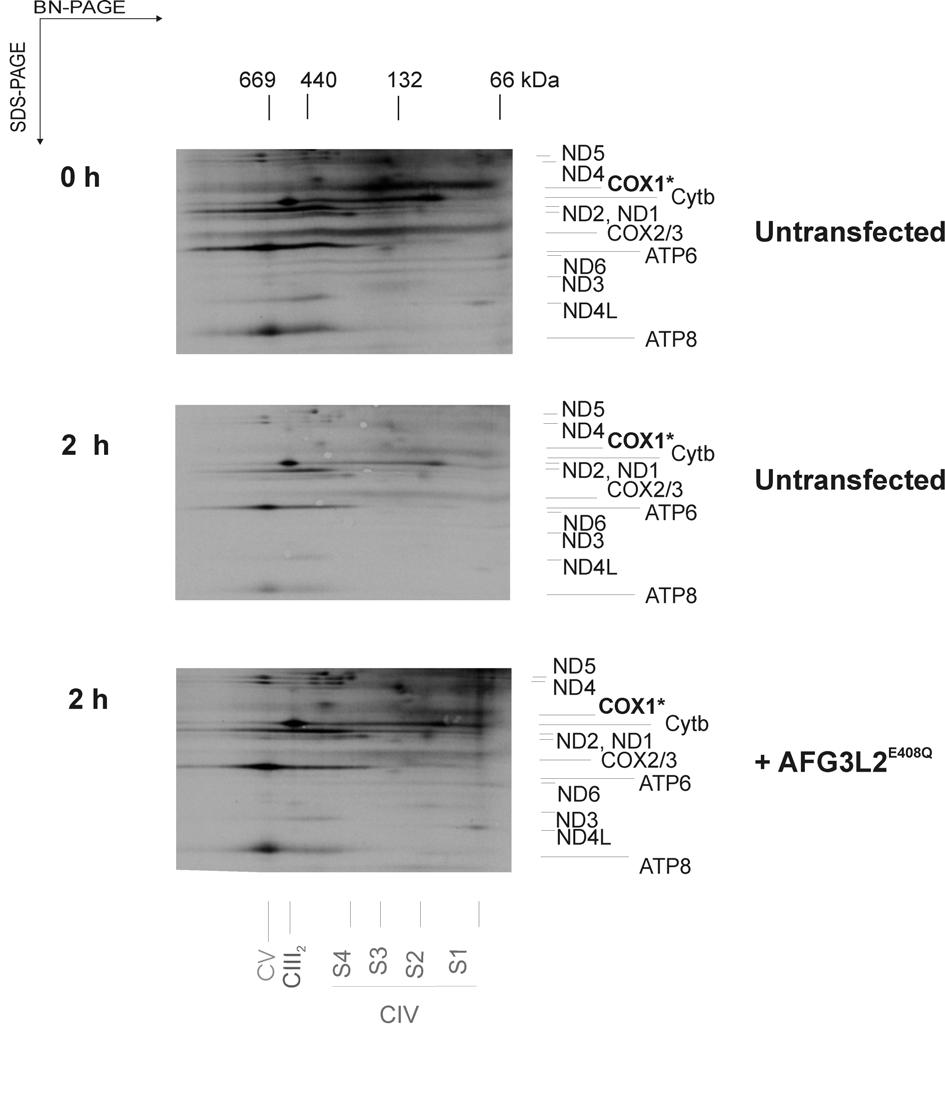
13 Fig S9. Incorporation kinetics of mtdna encoded proteins into RC complexes and smaller supercomplexes with and without AFG3L2 E408Q transfection Two-dimensional display of OXPHOS complexes and supercomplexes after BN-PAGE/SDS- PAGE 2-D electrophoresis. Mitochondrial encoded proteins were pulse labelled in AFG3L2 E408Q transfected and untransfected A7339G 100% mutant cells with 35 S-methionine and chased for the indicated time period followed by solubilisation of isolated mitochondria in DDM and BN- PAGE/SDS-PAGE 2-D electrophoresis. Abbreviations as in Fig. 5.