Illumina Sequencing Error Profiles and Quality Control
|
|
|
- Kelley Beasley
- 5 years ago
- Views:
Transcription
1 Illumina Sequencing Error Profiles and Quality Control
2 RNA-seq Workflow Biological samples/library preparation Sequence reads FASTQC Adapter Trimming (Optional) Splice-aware mapping to genome Counting reads associated with genes Statistical analysis to identify differentially expressed genes
3 Quality Checks: Raw Data Biological samples/library preparation Sequence reads FASTQC Adapter Trimming (Optional) Splice-aware mapping to genome Counting reads associated with genes Statistical analysis to identify differentially expressed genes
4 FASTA >SRR EIXKN4201CFU84 length=93 GGGGGGGGGGGGGGGGCTTTTTTTGTTTGGAACCGAAAGGGTTTTGAATTTCAAACCCTTTTCGGTTTCCAACCTTCCAAAGCAATGCCAATA >gi ref NC_ Acidithiobacillus caldus SM-1 chromosome, complete genome ATGAGTAGTCATTCAGCGCCGACAGCGTTGCAAGATGGAGCCGCGCTGTGGTCCGCCCTATGCGTCCAACTGGAGCTCGTCACGAG TCCGCAGCAGTTCAATACCTGGCTGCGGCCCCTGCGTGGCGAATTGCAGGGTCATGAGCTGCGCCTGCTCGCCCCCAATCCCTTCG TCCGCGACTGGGTGCGTGAACGCATGGCCGAACTCGTCAAGGAACAGCTGCAGCGGATCGCTCCGGGTTTTGAGCTGGTCTTCGCT CTGGACGAAGAGGCAGCAGCGGCGACATCGGCACCGACCGCGAGCATTGCGCCCGAGCGCAGCAGCGCACCCGGTGGTCACCGCCT CAACCCAGCCTTCAACTTCCAGTCCTACGTCGAAGGGAAGTCCAATCAGCTCGCCCTGGCGGCAGCCCGCCAGGTTGCCCAGCATC CAGGCAAATCCTACAACCCACTGTACATTTATGGTGGTGTGGGCCTCGGCAAGACGCACCTCATGCAGGCCGTGGGCAACGATATC CTGCAGCGGCAACCCGAGGCCAAGGTGCTCTATATCAGCTCCGAAGGCTTCATCATGGATATGGTGCGCTCGCTGCAACACAATAC CATCAACGACTTCAAACAGCGTTATCGCAAGCTGGACGCCCTGCTCATCGACGACATCCAGTTCTTTGCGGGCAAGGACCGCACCC >gi sp P01013 OVAX_CHICK GENE X PROTEIN (OVALBUMIN-RELATED) QIKDLLVSSSTDLDTTLVLVNAIYFKGMWKTAFNAEDTREMPFHVTKQESKPVQMMCMNNSFNVATLPAE
5 FASTQ: FASTA with Quality EIXKN4201CFU84 length=93 GGGGGGGGGGGGGGGGCTTTTTTTGTTTGGAACCGAAAGGGTTTTGAATTTCAAACCCTTTTCGGTTTCCAACCTTCCAAAGCAATGCCAATA +SRR EIXKN4201CFU84 length=93 ";C?,B;?6B;:EA1EA1EA5 Line Description 1 Always begins with '@' and then information about the read 2 The actual DNA sequence 3 Always begins with a '+' and sometimes the same info in line Has a string of characters which represent the quality score
6 FASTQ Quailty EIXKN4201CFU84 length=93 GGGGGGGGGGGGGGGGCTTTTTTTGTTTGGAACCGAAAGGGTTTTGAATTTCAAACCCTTTTCGGTTTCCAACCTTCCAAAGCAATGCCAATA +SRR EIXKN4201CFU84 length=93 ";C?,B;?6B;:EA1EA1EA5 Quality Quality score: Q = -10 x log10(p), where P is the probability that a base call is erroneous The legend above provides the mapping of quality scores (Phred-33) to the quality encoding characters. Different quality encoding scales exist (differing by offset in the ASCII table), but note the most commonly used one is fastqsanger.
7 FASTQ Quality Scores These probability values are the results from the base calling algorithm and dependent on how much signal was captured for the base incorporation. The score values can be interpreted as follows:

8 A good quality sample

9 A not-so-good quality sample
10 Error profiles: Technical Sequencer Problems

11 Manifold burst in cycle 26 See for more example

12 Specific cycles lost
13 Error dependency on technology Illumina Base-calling for next-generation sequencing platforms. Brief Bioinform 2011, 12(5):
14 Illumina: signal decay
15 Illumina: phasing

16 Illumina: phasing

17 mixed clusters Illumina: flow cell clusters

18 Swath Flow cell Lane Tile Illumina: optical effects

19 QA Positional sequence bias
20 PCR Artifacts
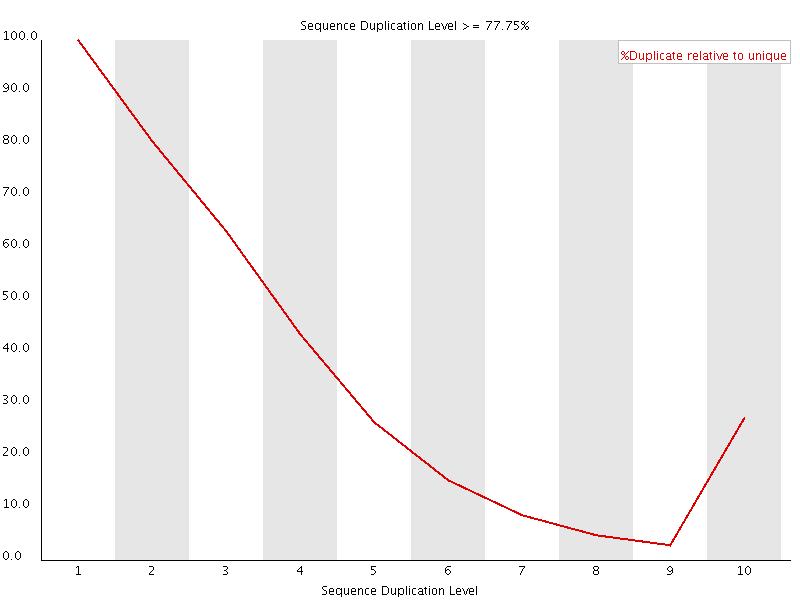
21 Duplicated sequences
22 Over-represented sequences

23 Read Frequency Distribution Contamination
24 > gnl uv NGB :1-219 pcr4-topo multiple cloning site Length=219 Score = 100 bits (50), Expect = 9e-19 Identities = 50/50 (100%), Gaps = 0/50 (0%) Strand=Plus/Plus Query 1 ATTAACCCTCACTAAAGGGACTAGTCCTGCAGGTTTAAACGAATTCGCCC 50 Sbjct 43 ATTAACCCTCACTAAAGGGACTAGTCCTGCAGGTTTAAACGAATTCGCCC 92
25 Quality Checks for Raw Data
26 Quality Checks: Raw Data All NGS analyses require that the quality of the raw data is assessed prior to any downstream analysis. The quality checks at this stage in the workflow include: 1. Checking the quality of the base calls to ensure that there were no issues during sequencing 2. Examining the reads to ensure their quality metrics adhere to our expectations for our experiment 3. Exploring reads for contamination The tool FASTQC is often used to assess these metrics, and it generates a QC report for each sample.
27 Quality Checks: Raw Data Raw Data QC Goals: Identify sequencing problems and determine whether there is a need to contact the sequencing facility Identify over-represented contaminating sequences Gain insight into library complexity (rrna contamination, duplications) Ensure organism is properly represented by %GC content

28 These materials have been developed by members of the teaching team at the Harvard Chan Bioinformatics Core (HBC). These are open access materials distributed under the terms of the Creative Commons Attribution license (CC BY 4.0), which permits unrestricted use, distribution, and reproduction in any medium, provided the original author and source are credited.