Suppl. Table S1. Characteristics of DHS regions analyzed by bisulfite sequencing. No. CpGs analyzed in the amplicon. Genomic location specificity
|
|
|
- Walter Wilkins
- 5 years ago
- Views:
Transcription
1 Suppl. Table S1. Characteristics of DHS regions analyzed by bisulfite sequencing. DHS/GRE Genomic location Tissue specificity DHS type CpG density (per 100 bp) No. CpGs analyzed in the amplicon CpG within GRE* Per1-R1 chr11:68,912,980-68,913,520 Both pre-programmed 4 12 Yes (sp) Arrdc2-R1 chr8:73,762,400-73,762,880 Both pre-programmed 4 10 No Dusp1 chr17:26,237,650-26,238, pre-programmed No Fkbp5 chr17:28,191,340-28,191, pre-programmed No Arhgef3 chr14:25,972,220-25,972,580 AtT-20 pre-programmed No Ttr chr18:20,808,040-20,808,500 AtT-20 pre-programmed Yes (CGT) Sgk-R2 chr10:21,690,990-21,691,420 AtT-20 pre-programmed No Per1-R2 chr11:68,915,430-68,915,870 Both Sgk-R3 chr10:21,694,100-21,694,590 Both pre-programmed in AtT-20 de novo in 3134 pre-programmed in AtT-20 de novo in No 1 5 No Arrdc2-R2 chr8:73,763,150-73,763, ** de novo 1 4 Yes (CGT) # (ACG) Suox chr10:128,075, ,075, de novo 1.1 3(4) Yes Tsc22d3 chrx:135,883, ,884, de novo No Snf1lk chr17:31,570,680-31,571, de novo Yes (ACG) Ptprg chr14:10,852,310-10,852, de novo Yes (ACG) Chrna5 chr9:54,788,900-54,789, de novo Yes (ACG) Mef2b chr8:73,092,270-73,092, de novo Yes (ACG) Sgk-R1 chr10:21,682,870-21,683, de novo No *If a GRE contains CpG site, the location is indicated: spacer (sp), (CGT) or (ACG). **DHS site is present in 3134 only, GR binding, however minor, occurs also in AtT-20. # Number in parenthesis refers to the positive strand amplicon.
2 Suppl. Table S2 Primers used for amplifying bisulfite converted DNA. Region For primer Rev primer Amplicon size Anneal. temp Per1-R1 5 -TGTTTTGGGTTATTAGTTAAGAGAATA-3 5 -CCCCACAATAACCAAACTCTACTAC bp 58 C Arrdc2-R1 5 -ATAGATATTTGGTAGTTGGTTTGGT-3 5 -TCTACTTCCTCAAAAAAATCTAAAC bp 55 C Dusp1 5 -TTTAAGTATTATTGTGTTGGGAAGG-3 5 -TATTAAAAAACCAACCATCCTCTTC bp 55 C Fkbp5 5 -GTGTAGTTTAGGGTGTGTGTTTTGT-3 5 -CTCTAACAACCCTCCAATAACTTC bp 55 C Arhgef3 5 -GATTTTGGGGTGGTTAGATTTTTAT-3 5 -AAACCCTCCTCATACCCCTAAC bp 57 C Ttr 5 -TGTATTTTTTTATTGTTGTTTTTGGA-3 5 -AAAAAACTTTTATACCCCCTCCTT bp 55 C Sgk-R2 5 -AGGAGTGGGGTATGTTTTTGT-3 5 -CCTCCCTTCCCTTCTCTTTC bp 55 C Per1-R2 5 -GGTTGTGGTTAATAGTAAGAATTAG-3 5 -ATCCTAAACCTAAAAAACCTTTAAC bp 52 C Arrdc2-R2 5 -AGATAAGTTATGTGGGGAGAATAAAAT AA-3 5 -ACTCAAAAACACACCTAAAAATAACATC bp 55 C Suox (+)* 5 -ATTGGAGGAAAGAGAAAGTTATA CCTCAAAAAAATTAACTTAACTC bp 55 C Suox (-)* 5 - TAGAGTTTATAAGATTTTTTTGTTT ATAACTAACCACACTACTTCACTAATACTT bp 53 C Tsc22d3 5 -GGGGGAGGTGTAGAAAGTAGTTTAT-3 5 -ACAACAATTACAAAAAATTATTCCC bp 58 C Snf1lk 5 -GTGATTTTTGTGGAGTAAGAGATTGT-3 5 -ATATCATAAACTAATCAAAACCCACAC bp 55 Ptprg 5 -AAAATAGGTTTGGTATAGGA-3 5 -CACAAAAACTACTATAAACC bp 52 C Chrna5 5 -TGGATGGAAGTAGAAATATATAGGTT TAG-3 5 -AAAACAAAACAAAACACAAAAACAC bp 53 C Mef2b 5- AATAGGAAATTTTATAGAGTTAGAAA-3 5 -CTAACACTCAAACTAAATAACAAAC bp 55 C Sgk-R1 5 - TTTTTTTTGTGAGAGAGGGATT-3 5 -ACCTTACAAATTTTAATCCTAACCATAC bp 55 C Sgk-R3 5 -TTGTAAGATGGTTAATTTGTATGAGG-3 5 -TCAAAAATCATATTAAAACCCAAAC bp 55 C DHS1** 5 -TGGATTGATTTAGTTTTTTTGGTTT-3 5 -CTAACTCCACCCCCTACTCTCTATC bp 55 C DHS5** 5 -GGTTTGGGAAGGTAGTTTATGTTTAT-3 5 -AAACTATCCAACTCCACAAACAAC bp 55 C *Suox (+) and (-) indicate the primers for positive and negative DNA strand, respectively; **DHS1 and DHS5: DHS regions not bound by GR and presented in Suppl. Fig. 3a (DHS1) and 3b (DHS5).
3 Suppl. Table S3 Primers and PCR conditions used for methyl-specific PCR. Region For primer Rev primer Amplicon size Annealing temp # cycles Suox (-) 5 -AGATATTAGTAGTATAGAAT-3 5 -AAAAACCAAATTCCAATTACAAAC bp 50 C 30 Mef2b 5 -GAATAATTGTTGTTTTGGTGAGTAT-3 5 -CCTTCCTTCTTTAATATAAAATTCACC bp 50 C 28 Ptprg 5 -AAAATAGGTTTGGTATAGGA-3 5 -CATCCTAAACTACATTTAACA bp 52 C 28 Nucleotide complementary to the unmethylated cytosine (uracil in BS-converted DNA) shown in bold.
4 Suppl. Table S4 Primers used for ChIP and FAIRE qpcrs. Region For primer Rev primer Suox 5 -TCTGGGAAATTAAGGGAGCA-3 5 -CAAGGACTCGGAGATGGAAA-3 Arrdc2-R2 5 -CACAGCCATGGGGATACTCT-3 5 -TCCCCTCTTGGGACATATTG3 Ptprg 5 -GATTGCCTCCTGCCACTTAG-3 5 -TTTGACGGGAGGCATAGTCT-3 Mef2b 5 -AGAACAACTGCTGCCTTGGT-3 5 -AACTCATGCATCACCACACC-3 Per1-R2 5 -GGCGCTCAGAAAATACTTGG-3 5 -CGACTCAGGCATCTTCCTTC-3 Sgk-R2 5 -CACATGTGCCAAGGTATTGC-3 5 -ATTGTCCCCTTTTCCACCTC-3 Arhgef3 5 GAGATTCTGGGGTGGTCAGA GGGAAATATCCGGGAACTGT-3 Ttr 5 -CAGAGCCTCCAACACTGTCA-3 5 -AACCGTCCAAAAGCAACAAT-3 Per1-R1 5 -GAACACGATGTTCCCTAGTGC-3 5 -AGAGGGAGGTGACGTCAAAG-3 Fkbp5 5 -TCAGTTCCCATTTCCTTTGG-3 5 -GGGTACATGTGGGAAAGACG-3 Sgk-CGI 5 -GAGCCGCTTCCTCCTTCT AGACTGAGGGGAGCAGTGAA -3
5 Suppl. Table S5 Oligonucleotides used in EMSA assays (sense strands shown only). Oligo name Sequence* Suox GRE - Unmethylated 5 -GCTTTCTTGGGACGTTCTGTGCTACTAATATC 3 Suox GRE - Methylated m 5 -GCTTTCTTGGGAC GTTCTGTGCTACTAATATC 3 Ampd3 GRE - Unmethylated 5 -TGGATGTCTAGGGACACGATGTCTTTGAGCCCGT 3 m Ampd3 GRE - Methylated 5 -TGGATGTCTAGGGACAC GATGTCTTTGAGCCCGT 3 Sgk GRE - Unmethylated 5 -TTATGCGGAAAGAACAGAATGTTCTCGGAGATT 3 m Sgk GRE - Methylated CpG#1 5 -TTATGC GGAAAGAACAGAATGTTCTCGGAGATT 3 m Sgk GRE - Methylated CpG#2 5 -TTATGCGGAAAGAACAGAATGTTCTC GGAGATT 3 Suox GRE -Mut 5 -GCTTTCTTGGGCTGTTCTAGGCTACTAATATC 3 Suox GRE G>A 5 -GCTTTCTTGGGACATTCTGTGCTACTAATATC 3 *GRE sequence motif is underlined with spacer in italic. Substitutions introduced to the endogenous element are shown in bold.
6 Figure S1 DNaseI hypersensitive regions overlap globally with CpG-enriched sequences. (A) The average density of CpG dinucleotides within all DHSs in mammary 3134 and pituitary AtT-20 cells (3-3.5 CpGs per 100bp). (B) The enrichment is mostly due to the CpG-rich regions at proximal promoters and CpG islands as shown for 3134 cells (7-10 CpGs per 100 bp). (C) An example of CpG island-related DNaseI chromatin accessibility: 100kb of mouse chromosome 10, showing an overlap (arrows) between CpG islands and very distinct hypersensitive regions common for 3134 and AtT-20 cells detected by DNaseI-seq before and 1h after dexamethasone (Dex) treatment. These regions are not a part of GR-mediated response (red tracks). (D) DNaseI hypersensitive sites exclusive of CpG island sequences also show a moderate (~2 CpGs per 100bp) enrichment in CpG dinucleotides. (E) An example of DNaseI hypersensitive sites outside of CpG islands both unrelated (blue arrows) or related (red arrows, red tracks) to GR binding. Figure S2 Chromatin enhancer regions identified by transcription factor binding show localized enrichment for CpG dinucleotides. (A) Majority of GR binding in both mammary 3134 and pituitary AtT-20 cell lines occurs outside of CpG islands and proximal promoters (> 2.5 kb away from TSS). Oct4 and Stat3 also bind predominantly to distal regulatory element in ES cells. (B) Box plot representation of CpG enrichment for all distal (>±2.5 kb) DHS in 3134 (left panel) and AtT-20 (right panel) cells, shown in Fig. 1B. The bin size is 1 kb. (C) The average density of CpG dinucleotides within all GR bound elements in 3134 and AtT-20 cells and (D) GR binding sites located outside of CpG islands. n, number of sites analyzed in each group. A CpG enrichment analysis for GR-bound DHSs located 2.5 kb away from TSSs is shown in Fig. 1C. (E) Box plot representation of CpG enrichment for pre-programmed GR-bound DHSs. (F) The difference in CpG enrichment between shared and 3134-unique GR-bound DHSs (Fig. 2C) is due to the enrichment outside of a GRE element (right panel). A GRE motif containing CpG is a 15-mer DNA sequence with a CG dimer.
7 Figure S3 Additional examples of tissue-specific DNA methylation within pre-programmed DHS sites. The following GR-bound sites are shown: Arrdc2-R1 common for both 3134 and AtT-20 cells (A), 3134-specific Fkbp5 (B) and AtT-20 specific Ttr (C). The data are presented as in Fig. 3. Figure S4 Additional examples of differential DNA methylation of 3134-specific (A) and AtT-20-specific (B) pre-programmed DHS sites independent of GR binding events. Two regions of chromosome 17 are shown: DHS tracks for 3134 and AtT-20 are displayed in upper and lower panels, respectively; the bisulfite sequencing results of DNA samples from untreated cells are shown to the right. Figure S5 Additional examples of DNA methylation within 3134-specific de novo DHS sites are shown for the following regions: Mef2b, Ptprg, Suox, Arrdc2-R2, Per1-R2, Chrna5 and Snf1lk. The data are presented as in Fig. 3. Figure S6 Dnmt1 knockdown in 3134 cells. (A) 3134 cells were transfected with sirna to Dnmt1, control sirna or mock transfected for 96 hours. Dnmt1 and GR mrna expression is shown for three independent experiments. (B) Western blot analysis of Dnmt1 protein in cell extracts from cells transfected with indicated sirna for 24h and 48h. Decrease in Dnmt1 level is observed already after 48h, however longer sirna treatment and the second transfection is necessary to obtain changes in DNA methylation.
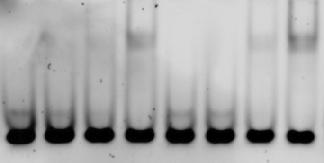
8 (C) Methylation-specific restriction enzyme analysis was performed to detect decrease in DNA methylation at previously methylated chromatin regions. DNA was extracted, treated with sodium bisulfite and indicated fragments were PCR amplified. After bisulfite conversion the restriction site is maintained in the presence of methylated cytosine. However, when unmethylated, cytosine is converted to uracil and established as thymine after PCR amplification, thus eliminating the restriction site. It results in higher signal from the undigested product. Graphic representation of an analyzed region is shown to the left with circles representing CpG dinucleotides. The methylation-dependent sequence within restriction site is shown next to the examined CpG. The sizes of restriction fragments are indicated. Separation of restriction fragments on 2% agarose gel is shown to the right. Figure S7 Differences in chromatin accessibility can be detected using FAIRE-qPCR method. (A) Tissue-specific FAIRE enrichment and AtT-20 cells were treated 1h with Dex and FAIRE enrichment was analyzed at common and tissue-specific DHS regions. High FAIRE signal is observed in both cell lines when common DHS sites are analyzed (Sgk-CGI, Per1-R1). AtT-20- specific (Sgk-R2, Arhgef3, Ttr) and 3134-specific (Fkbp5, Arrdc2-R2, Suox, Per1-R2) DHS regions show tissue-specific FAIRE enrichment. (B) Hormone-dependent FAIRE enrichment. FAIRE signal was analyzed in 3134 cells before and 1h after Dex stimulation. Pre-programmed sites (Sgk-CGI, Per1-R1 and Fkbp5) are characterized by high (>0.1% of input) FAIRE signal in basal condition, which can be increased further after hormone stimulation. Hormone-dependent de novo sites (Arrdc2-R2, Per1-R2) show low basal enrichment (<0.02% of input) which increases after Dex treatment. The exception is Suox, where FAIRE-qPCR failed to detect an increase of chromatin accessibility in hormone-treated cells. For AtT-20-specific DHS sites (Sgk-R2, Arhgef3) FAIRE signal is low both before and after hormone induction.
9 Figure S8 In vitro GR binding to differentially methylated GREs. (A) Localization of a CG element within GRE (shown on sense (upper) and antisense (lower) DNA strands) in relation to the GR DNA binding domain. The vicinity of arginine 466 is also indicated. Image of 3G9M (Meijsing SH, Pufall MA, So AY, Bates DL, Chen L, and Yamamoto KR (2009) DNA binding site sequence directs glucocorticoid receptor structure and activity. Science, 324, ) was created using UCSF Chimera package from the Resource for Biocomputing, Visualization, and Informatics at the University of California, San Francisco (supported by NIH P41RR001081). (B) Gel shift assay showing GR binding to the Suox-GRE oligo probe either unmethylated (U), methylated (M) or mutated (mut) at the positions shown in Table S5. DNA was detected using SYBRGreen. (C) Gel shift assay of radioactively labeled, unmethylated Suox-GRE duplex with increasing amount (1:10, 1:100) of unlabeled oligo. (D) Additional example of EMSA assay with radioactively-labeled Suox-GRE oligos (methylated and unmethylated) and indicated amount of GR protein ( aa). Signal intensity of DNA in complex with GR compared to free DNA is shown in lower panels separately for each amount of GR (gel images shown here and in Fig. 5B). The average values obtained for unmethylated and methylated oligo are presented in the upper panel (error bars indicate s.d.; p-value obtained by two-tailed Student s t-test). (E) Representative examples of SYBRGreen EMSA assays carried out with titrated amount of purified GR fragment ( aa) and oligo probes for Suox-GRE, Ampd3-GR and Sgk-GRE, either unmethylated or methylated at the indicated positions. Quantification of combined results from 3-6 independent experiments is shown in Fig. 5C. Figure S9 Methylation status of individual clones for Suox GR-binding site. The DNA collected after indicated time points was analyzed by BS-sequencing on sense (A) and antisense (B) strand. The summarized results are presented in Fig. 6A and B.
10 Figure S10 Additional examples of Dex-dependant demethylation. DNA methylation changes after hormone treatment were analyzed at Mef2b (A) and Ptprg (B) GR-binding sites in 3134 cells. Upper panels show the summarized results of BS-sequencing analysis. Arrows indicate CpG dinucleotides that show dynamic changes after hormone stimulation and are analyzed subsequently using MS-PCR (lower panels). Data are presented as in Fig. 6. Figure S11 Methylation status of individual clones for Mef2b and Ptprg GR-binding sites. The DNA collected after indicated time points was analyzed by BS-sequencing at Mef2b (A) and Ptprg (B) elements. The summarized results are presented in Fig. S10.
11
12
13
14
15
16
17


18
19
20
21