UNIVERSITY OF CINCINNATI
|
|
|
- Nicholas Singleton
- 5 years ago
- Views:
Transcription
1 UNIVERSITY OF CINCINNATI Date: 22-Oct-2009 I, Johannes M Feudenbeg, heeby submit this oiginal wok as pat of the equiements fo the degee of: Docto of Philosophy in Biomedical Engineeing It is entitled: Bayesian Infinite Mixtue Models fo Gene Clusteing and Simultaneous Context Selection Using High-Thoughput Gene Expession Data Student Signatue: Johannes M Feudenbeg This wok and its defense appoved by: Committee Chai: Maio Medvedovic, PhD Maio Medvedovic, PhD Buce Aonow, PhD Buce Aonow, PhD Michael Wagne, PhD Michael Wagne, PhD Jaoslaw Melle, PhD Jaoslaw Melle, PhD 11/18/
2 Bayesian Infinite Mixtue Models fo Gene Clusteing and Simultaneous Context Selection Using High-Thoughput Gene Expession Data A dissetation submitted to the Gaduate School of the Univesity of Cincinnati in patial fulfillment of the equiements fo the degee of Docto of Philosophy in the Depatment Biomedical Engineeing of the Colleges of Engineeing and Medicine by Johannes M. Feudenbeg M.S., 2004, Leipzig Univesity, Leipzig, Gemany (Geman Diplom degee) Committee Chai: Maio Medvedovic, Ph.D.
3 Abstact Applying clusteing algoithms to identify goups of co-expessed genes is an impotant step in the analysis of high-thoughput genomics data in ode to elucidate affected biological pathways and tansciptional egulatoy mechanisms. As these data ae becoming eve moe abundant the integation with both, existing biological knowledge and othe expeimental data becomes as cucial as the ability to pefom such analysis in a meaningful but vitually unsupevised fashion. Clusteing analysis often elies on ad-hoc methods such as k-means o hieachical clusteing with Euclidean distance but model-based methods such as the Bayesian Infinite Mixtues appoach have been shown to poduce bette, moe epoducible esults. Futhe impovements have been accomplished by context-specific gene clusteing algoithms designed to detemine goups of co-expessed genes within a given subset of biological samples temed context. The complementay poblem of finding diffeentially co-expessed genes given two o moe contexts has been addessed but elies on the a pioi definition of contexts and has not been used to facilitate the clusteing of biological samples. Hee we descibe a new computational method using Bayesian infinite mixtue models to cluste genes simultaneously utilizing the concept of diffeential co-expession as a unique similaity measue to find goups of simila samples. We compute a novel pe-gene diffeential co-expession scoe that is epoducible and biologically meaningful. To evaluate, annotate, and display clusteing esults we pesent the integated softwae package CLEAN which contains functionality fo pefoming Clusteing Enichment Analysis, a method to functionally annotate clusteing esults and to assign a novel gene-specific functional coheence scoe. 2
4 We apply ou method to a numbe of simulated datasets compaing it to othe commonly used clusteing algoithms, and we e-analyze seveal beast cance studies. We find that ou unsupevised method detemines patient goupings highly pedictive of clinically elevant factos such as estogen ecepto status, tumo gade, and disease specific suvival. Integating these data with computationally and liteatue-deived infomation by applying CLEAN to the coesponding clusteings as well as the DCS signatue substantiates these findings. Ou esults demonstate the ange of applications ou methodology povides, offeing a compehensive analysis tool to study gene co-expession and diffeential co-expession pattens specific to the biological conditions of inteest while simultaneously detemining subsets of such biological conditions using a unique similaity measue that is complementay to the cuently existing methods. It allows us to futhe ou undestanding of highly complex diseases such as beast cance, and it has the potential to geatly facilitate eseach in many othe, not yet as intensively studied aeas. 3
5 4
6 Peface I would like to thank eveyone who helped and suppoted me to each this milestone on my Bioinfomatics jouney. I especially thank my adviso and mento D. Maio Medvedovic fo all of his suppot, insight, and encouagement. Discussions and convesations with him ae always inspiing and enlightening and I am deeply gateful fo the oppotunity to wok with him. I also thank D. Buce Aonow, D. Jaek Melle, and D. Michael Wagne fo seving on my thesis committee, but moe impotantly fo thei expetise, advice, and suppot ove the past yeas. Thanks and gatitude also to all my collaboatos, especially D. Siva Sivaganesan whose expetise in Bayesian Statistics is invaluable fo this dissetation, Monika Ray fo tusting me and challenging my ways, and Xiangdong Liu, Vineet Joshi, and Zhen Hu. I thank my fellow taveles Jing Chen, Sivakuma Gowisanka, Ranga Chanda Gudivada, Rachana Jain, and Mukta Phatak fo leading the way. I want to also thank my paents fo thei love and suppot (and fo sending cae packages acoss the ocean) and my daughte Anouk fo eminding me eveyday what s eally impotant in life. Finally, I wish to thank my patne, my fiend, my love Un Kyong Ho: This is fo you. 5
7 Table of Contents Abstact... 2 Peface... 5 List of Tables... 7 List of Figues... 8 List of Algoithms... 8 Chapte I Backgound... 9 Intoduction... 9 Clusteing Gaussian finite and infinite mixtue models Context-specific clusteing Diffeential Co-expession Outline of this dissetation Chapte II Semipaametic Bayesian model fo unsupevised diffeential co-expession analysis identifies novel molecula subtypes Intoduction Results Context-specific infinite mixtue model Recovey of simulated contexts Identifying molecula subtypes in beast cance gene expession data Diffeentially co-expessed genes Compaison to othe outcome pedictos Repoducibility of diffeential co-expession signatue acoss independent datasets.. 29 Meta-analysis based on the diffeential co-expession signatue Discussion and Conclusions Methods Infinite mixtue model Diffeential co-expession scoe Simulation study Beast cance studies Chapte III: CLEAN CLusteing Enichment ANalysis Backgound Results Compaing clusteing esults using the CLEAN scoe Repoducibility and the compaison with cluste-wide scoes Unsupevised selection of infomative genes Computational Infastuctue Discussion Conclusions Methods
8 Data Pepocessing, Gene Selection and Clusteing Clusteing Enichment Analysis Defining Functional Categoies Obtaining All Possible Gene Clustes Detemining significant functional enichment Pocedue fo Non-hieachical Methods R package and FTeeView tool Chapte IV: Additional Applications Simulation studies A synthetic dataset Lage-scale beast cance study evisited Nomal tissue dataset Bibliogaphy89 Appendix 98 A. Gene Lists B. R packages B.1 Contibutions to gimmr B.2 CLEAN List of Tables Table 2.1: Patient chaacteistics of DCIM deived patient goups fo the Schmidt et al. dataset Table 2.2: Compaison of computationally deived patient goups fo the Schmidt et al. dataset Table 2.3: Pedicting suvival outcome using diffeent clinical, molecula, and computational methods Table 2.4: Pedicting suvival outcome using the top 200 DCE genes with diffeent clusteing algoithms Table 2.5: Compaison of patient goupings deived fom individual and joint analyses Table 2.6: Ovelap of the 500 DCS signatue with othe well-known beast cance signatues.. 34 Table 2.7: Oveview of the beast cance studies used Table 3.1. Contingency table of genes with significant and non-significant CLEAN scoe in human and mouse tissues Table 3.2. Contingency table of genes with significant and non-significant cwclean scoe in human and mouse tissues Table A1. Top 200 DCS genes fo the Schmidt et al. (2008) dataset Table A2: Top 200 genes diffeentially expessed between two majo contexts fo the Schmidt et al. (2008) dataset
9 List of Figues Figue 1.1 Numbe of samples published each month though the Gene Expession Omnibus.. 10 Figue 2.1. Contexts ae defined by unique local gene co-expession pattens Figue 2.2. Diffeences between contexts ae defined by diffeential co-expession, not diffeential expession Figue 2.3. DCIM deived contexts in beast cance data ae pedictive of patient suvival Figue 2.4. Repoducibility of the gene-specific DCS Figue 2.5. Heatmaps of top 500 DCS gene signatue in thee beast cance studies Figue 2.6. Heatmaps of top 500 DCS gene signatue in beast cance meta-study. Expession pattens ae emakably consistent with individual datasets. DCIM sample clusteings ae highly coelated with ER status, tumo gade, and patient suvival. 32 Figue 2.7. Diected Acyclic gaph descibing the DCIM computational model Figue 3.1. Calculating functional coheence scoes Figue 3.2. Compaison of clusteing methods Figue 3.3. Integating cluste analysis and functional knowledge Figue 3.4. Repoducibility of CLEAN and cwclean scoes in a specific dataset Figue 3.5. Diffeences in the epoducibility of CLEAN and cwclean scoes Figue 3.6. Unsupevised selection of infomative genes Figue 3.7. Integated softwae package Figue 3.8. Expession pattens of genes with statistically significant CLEAN scoes in fou independent beast cance datasets Figue 4.1. Recovey of gene clustes in simple simulation scenaio Figue 4.2. Recovey of gene clustes in two fold-changes scenaio Figue 4.3. Recovey of gene and sample clustes non-infomative samples scenaio Figue 4.4. Heatmap of the expession dataset geneated by the Micoaay Quality Contol (MAQC) Consotium Figue 4.5. ROC cuves fo sample clusteing of the MAQC dataset Figue 4.6. Kaplan-Meie cuves estimating patient suvival in joint beast cance data set Figue 4.7. DCIM clusteing and suvival analysis of the joint beast cance dataset Figue 4.8. Clusteing Enichment Analysis (CLEAN) of the DCIM deived gene clusteing Figue 4.9. Sceenshot of fteeview displaying DCIM deived gene clusteing and contexts fo the nomal tissue study Figue Sceenshot of fteeview displaying DCIM and CLEAN esults fo the GSE3526 dataset Figue Combining the display of CLEAN scoes and the DCS fo the GSE3526 dataset.. 87 List of Algoithms Algoithm 2.1. Gene-specific DCS Algoithm 3.1. Clusteing Enichment Analysis (CLEAN) Algoithm 3.2. Aveaging gene clusteings ove n uns of a non-hieachical clusteing algoithm
10 Chapte I Backgound Intoduction The expession of genetic infomation is a fundamental pocess found in vitually all living cells 1. Pats of the DNA the genetic blue pint ae tanscibed into a woking copy, a shote RNA molecule o tanscipt which in tun is tanslated into potein. This geneal concept is known as the Cental Dogma of molecula biology [1] and is a highly complex pocess egulated by an inticate netwok of inteactions between DNA, RNA, and poteins. Accoding to the Cental Dogma, messenge RNA abundance in a cell should coelate to potein abundance. Indeed, such coelation appeas to be easonably stong [2, 3], and RNA expession measuements ae now widely used to study the function of genes as the development of DNA micoaays duing the mid 1990s [4] made it possible to monito genome-wide messenge RNA abundance a quantum leap fom the pecuso technique Southen blotting [5]. This invention subsequently spawned a new field contending with a whole host of challenges and new developments such as aay types (e.g., oligonucleotide, bead, and spotted aays), standadization and quality contol (e.g., MIAME [6] and MAQC [7]), and new (and old) statistical poblems (e.g., data nomalization, epoducibility assessment, high dimensionality, data mining). Most if not all of these aeas ae still being pusued some with moe intensity than othes while whole tansciptome e-sequencing techniques ae now stating to emege 1 Thee ae living cells such as matue mammalian eythocytes which lack a nucleus and do not synthesize RNA. 9
11 pomising a new set of oppotunities as well as challenges. Yet so fa, the use of highthoughput technologies to assess gene expession levels has become ubiquitous analyzing samples of almost any species, tissue type, disease state, and expeimental condition imaginable geneating an incedible wealth of whole genome expession data. The equiement by many scientific jounals to publish such data along with the manuscipt has lead to a steady incease of gene expession data stoed in epositoies accessible by the public. Futhemoe, the gowth ate of such epositoies itself has been inceasing eve since thei inception (Figue 1.1). As of Septembe 2009, the Gene Expession Omnibus (GEO) [8] alone povides ove 350,000 publicly available samples, whee a sample epesents a single gene expession expeiment as a vecto of elative expession levels of a platfom-specific set of genes o DNA sequences. Figue 1.1 Numbe of samples published each month though the Gene Expession Omnibus (GEO) [8], a epositoy fo high-thoughput gene expession data. While the monthly numbes vay by up to seveal thousand samples, the oveall tend has been a steady incease since the sites inception. GEO now holds moe than 350,000 publicly available samples. The gaph is based GEO seies summay data and was geneated as of Septembe Despite o possibly because of this enomous amount of data, it emains a challenge to fully haness the wealth of infomation it epesents. New methods ae needed to gain novel 10
12 insight into the undelying biological pocesses and to infe new knowledge fom these data which equies means to ecognize pattens and to oganize data in meaningful ways with little o no human intevention. Clusteing Clusteing is a commonly used technique to patition a data set into smalle, moe manageable units o clustes. Moe specifically, an object (e.g., a gene) chaacteized by a set of featues o attibutes (e.g., biological conditions) is placed in a goup of othe objects having simila attibute values (e.g., expession levels). Ideally, membes of such cluste ae most simila to each othe with espect to the consideed attibutes but ae dissimila to all othe objects. Based on this geneal concept, many clusteing algoithms have been poposed diffeing not only in the seach stategy employed to detemine clustes but also in the definition of object similaity [9]. Fo an excellent eview of many clusteing methods the eade is efeed to Jain et al. [9]. Applying cluste analysis to any kind of high-thoughput gene expession data eflecting elative tanscipt abundance is a natual choice, as genes function in concet, ae pat of inticate pathways, and ae egulated by vaious elaboate egulatoy mechanisms. It is easonable to expect gene co-expession and co-egulation to be eflected in DNA expession data. In othe wods, functionally elated genes can be expected to poduce simila expession pofiles. Theefoe, given a goup of genes with simila expession pattens, it is easonable to hypothesize that these genes shae a functional elationship ( guilt-by-association ) [10]. Howeve, this paadigm highly depends on adequate methods and expeimental design: Using impope distance measues, making assumptions not suitable to the data, o applying 11
13 inappopiate algoithms may lead to ielevant o even misleading clusteings. Yet even the most accuate clusteing analysis cannot ovecome the fact that co-expession does not necessaily imply co-egulation o functional elatedness. It can meely seve as a hypothesis geneato equiing futhe independent analysis and testing. In ode to geneate the stongest hypotheses possible, it is theefoe cucial to develop appopiate algoithms that povide eseaches with useful, meaningful, and epoducible clusteings. The fist clusteing method applied to DNA expession micoaay data was hieachical clusteing using uncenteed coelation as similaity measue and aveage linkage [11]. Othe well-known patten ecognition algoithms such as k-means [12] and self-oganizing maps (SOMs) [13] followed. It should be noted that all of these methods ae ad hoc. In othe wods, these methods do not take into account the vaiability of the data and theefoe have no means to establish the statistical significance of the esults o to estimate epoducibility. In contast, model-based clusteing algoithms ae designed to fit a statistical model given the data. That is, model-based clusteing methods explicitly account fo uncetainties and measuement eos in the data and povide confidence estimates along with the actual clusteing esults. Gaussian finite and infinite mixtue models Among the most commonly used model-based clusteing methods ae Gaussian mixtue models. This Bayesian appoach has poven extemely valuable in clusteing expession data which ae oughly nomally distibuted on the logaithmic scale. Hee, simila expession pofiles ae assumed to be geneated by a common undelying Gaussian patten. Once such a model is postulated, the posteio pobability distibution of the model paametes given the data can be estimated using computational methods such as Gibbs sampling [14]. Like many clusteing methods (e.g., k-means, SOMs), finite Gaussian mixtue models equie the numbe of 12
14 clustes to be pe-specified. In contast, infinite Gaussian mixtues allow the optimal numbe of clustes to be estimated as a model paamete. Medvedovic et al. [15, 16] show that taking the uncetainty of the tue cluste numbe into account by using infinite athe than finite mixtues damatically impoves the epoducibility of the clusteing esults as well as thei sensitivity and specificity compaed to not only heuistic methods (hieachical clusteing, k-means) but also to model-based methods (finite mixtue models, MCLUST [17]). Clusteing in the context of DNA micoaay data usually efes to the discovey of goupings of genes. Howeve, clusteing of samples has been shown to be exceedingly valuable in its own ight. In this case, biological samples (e.g., patients) ae the objects to be gouped into clustes and genes ae the attibutes. In one application, this has lead to the discovey of novel beast cance subtypes [18]. Based on these findings a numbe of gene signatues have been devised to pedict clinical outcome [19, 20], tumo subtype [21], and histologic gade [22], some of which ae cuently studied in clinical tials to impove teatment of the disease [23]. Context-specific clusteing Taditionally, genes and conditions ae clusteed sepaately and independently. The undelying assumption in this case is that genes ae tightly co-egulated unde all conditions of the expeiment. Likewise, all genes ae assumed to be elevant to detemine the similaity of samples. In contast, so-called biclusteing methods [24-29] ae designed to detemine subsets of genes co-egulated only in a subset of expeimental conditions o samples. The motivation hee is that a given set of genes may act in concet as pat of a common pathway unde one condition but may act independently unde anothe. Hence thei co-egulation is context-specific. Such biological contexts include diffeent tissue types, disease states, developmental stages, envionmental factos, etc. As a esult, coesponding gene clustes ae specific to a subset of 13
15 samples, and convesely, a gouping of samples is sensible only fo a subset of genes. The seach fo gene clustes can infom the simultaneous seach fo sample goupings and vice vesa an advantage ove sequential two-way clusteing methods whee both seaches ae independent. Unfotunately, like the taditional two-way clusteing methods, most bi-clusteing methods too ae ad-hoc making it difficult to detemine the significance of a given bi-cluste. Futhemoe, bi-clusteing esults ae often too complex to intepet as it is unclea how the diffeent bi-clustes elate to each othe. Diffeential Co-expession The complementay poblem of seaching fo diffeential co-expession has only ecently gained moe attention [30-32]. The goal is to find genes co-expessed in one biological context but not in anothe due to, fo example, dysegulation in a disease state such as beast cance. A numbe of methods have been descibed in ecent yeas to solve this poblem with applications in postate cance [33], leukemia [34, 35], o muscle gowth [36]. These studies show that diffeentially co-expessed genes, known to be disease elated, could not be identified by diffeential expession analysis [33, 34, 36]. In a paticula application, gene expession of developing muscle tissue in a bovine animal model (Wagyu cattle) was compaed to a doublemuscled model (Piedmontese cattle) expessing a vesion of the myostatin (MSTN) tansciption facto known to cay the causal mutation fo the obseved phenotype. This gene was not found to be diffeentially expessed in multiple studies but was identified as diffeentially co-expessed with downsteam tansciptional tagets such as MYL2 [36]. A dawback fo all these methods is that they opeate unde the assumption that the biological contexts ae known and seach fo changes in coelation of expession levels between those contexts thus equiing pio specification of contexts. To the best of ou knowledge, no 14
16 method has been poposed to explicitly seach fo contexts using diffeential gene co-expession to distinguish between biological samples. Outline of this dissetation The pincipal contibution of this dissetation is a new Bayesian method to simultaneously cluste both genes and biological samples using high-thoughput gene expession data. We postulate a Gaussian infinite mixtue model that incopoates the concept of diffeential gene co-expession to sepaate biological samples into contexts. We then design and implement computational methods to estimate the posteio distibution of the model paametes given data which include clusteing of both genes and samples. Finally, we compute a novel scoe to detemine diffeentially co-expessed genes. The emainde of this dissetation is divided into thee chaptes. Chapte II compises a manuscipt submitted fo publication descibing the design and implementation of ou Diffeential Co-expession Infinite Mixtues (DCIM) model and a novel, gene specific diffeential co-expession scoe (DCS). We outline the statistical and computational famewok to goup of biological samples into contexts and genes into global and futhe into local clustes, and to compute the DCS. We then apply ou methods to a set of simulation scenaios and to a numbe of lage-scale beast cance studies. Chapte III is adapted fom a ecently published manuscipt [37] descibing a novel method, Clusteing Enichment Analysis (CLEAN), to functionally annotate gene clusteings. The CLEAN softwae package also contains tools to geneate and display gene and sample clusteings, expession intensities and functional annotations which can be inteactively viewed by the use. In addition, CLEAN can be used to compae esults of diffeent gene clusteing algoithms. In chapte IV, we show futhe esults 15
17 such as the evaluation and compaison of gene clusteings and application to othe tissue types combining the methods descibed in chaptes II and III. 16
18 Chapte II A Semipaametic Bayesian model fo unsupevised diffeential co-expession analysis identifies novel molecula subtypes Intoduction Examination of genome-wide pattens of gene expession levels is fequently used to chaacteize diffeences and similaities between biological samples at molecula level, and to elucidate undelying biological pathways and molecula netwoks. The analysis of gene expession pofiles commonly focuses on eithe diffeential expession o co-expession [38]. In the fome case, the goal is to identify genes whose expession level vaies between two o moe sample types o conditions. In contast, co-expession (cluste) analysis is used to goup togethe genes with simila expession pattens acoss diffeent samples, and to goup samples with simila global expession pofiles. In the case of beast cance, such studies have lead to the discovey of distinct molecula subtypes diffeing in clinical, histological, and molecula chaacteistics, as well as teatment esponse and disease outcome. They point to a divese etiology of the disease with distinct molecula signatues involving numeous biological pocesses. Some of these findings ae cuently used in clinical tials aiming to impove patient pognosis and teatment [23]. Moe ecently, diffeential co-expession [30-32] has been used to chaacteize dysegulation of gene expession egulatoy netwoks in postate cance [33], leukemia [34, 35], 17
19 o muscle gowth [36]. In such analyses, a goup of genes which ae co-expessed within one biological context (e.g., nomal postate tissue samples) but not within anothe context (e.g., postate tumo samples) ae said to be diffeentially co-expessed. These studies demonstated that some of the known disease elated genes, which could not be identified by diffeential expession analysis, wee actually diffeentially co-expessed [33, 34, 36]. All diffeential coexpession analysis methods to date equie the pio definition of biological contexts within which the co-expession is to be compaed. Hee we pesent a novel pobabilistic appoach to jointly uncove contexts (i.e., goups of samples) with specific co-expession pattens, and goups of genes with diffeent co-expession pattens acoss such contexts. Ou pobabilistic diffeential co-expession infinite mixtue (DCIM) model implicitly defines a new similaity measue fo gouping biological samples based on the similaity of the gene co-expession stuctue within each sample. Two samples will be simila accoding to this measue if the same goups of genes ae co-clusteed in both samples egadless of the oveall similaity of the gene expession pattens in the classic sense such as high coelation and small Euclidean distance. To the best of ou knowledge, this is the fist time that changing co-expession pattens have been used to cluste samples based on gene expession data, and the fist famewok fo completely unsupevised analyses of diffeential coexpession. The DCIM model is based on the Bayesian semi-paametic Diichlet pocess mixtues [39], also efeed to as the infinite mixtue model [15, 40]. The context specificity of the gene co-expession pattens is specified as in the context-specific infinite mixtue model [41]. To facilitate de-novo seach fo contexts, we impose additional Diichlet pocess-like pios on the membeship of samples in diffeent contexts. The use of infinite mixtues allows us to avoid 18
20 specifying the numbe of global and local gene expession clustes as well as the numbe of contexts. Co-expession elationship and co-membeships in the same context ae estimated by integating ove all possible values of these key paametes. Using the new methodology we evisit the poblem of identifying molecula subtypes of beast cances. We find that the patient goupings induced by the diffeential co-expession stongly pedict disease outcome. Diffeentially co-expessed genes as well as the pattens of diffeential co-expession ae highly epoducible acoss independent expession datasets. Finally, we find that ou diffeential co-expession signal is complementay to othe pedictive paametes such as estogen ecepto (ER) status, lymph node (LN) status, and AURKA expession, as well as the signals contained in the clustes of samples ceated using taditional similaity measues. Results Context-specific infinite mixtue model The DCIM model is based on the assumption that global gene clustes, consisting of genes with simila expession pattens acoss all samples, ae gouped futhe into local clustes within each context consisting of samples with identical co-expession stuctue. In Figue 2.1.A samples (i.e., columns) ae oganized into thee contexts, and genes (i.e., ows) fom fou global clustes. Within context X, global clustes 1 and 3 ae futhe gouped into a single local cluste and global clustes 2 and 4 ae gouped into anothe local cluste. Consequently, within context X all gene expession pofiles fom only two local clustes. Similaly, within context Y, gene clustes 1 and 4 fom a local cluste and gene clustes 2 and 3 fom a local cluste. Since the local clusteing of genes is diffeent between goups of samples X and Y, these two goups fom 19
 Genes gouped into global gene clustes, maked 1-4, ae assumed to each deive fom common undelying gene expession pattens.")
21 two diffeent contexts. As a esult, each context is chaacteized by a unique co-clusteing stuctue of genes. Figue 2.1. Contexts ae defined by unique local gene co-expession pattens. A) Genes gouped into global gene clustes, maked 1-4, ae assumed to each deive fom common undelying gene expession pattens. Depending on the espective biological contexts, maked X, Y, and Z, global clustes ae gouped futhe locally. Convesely, biological samples ae in the same biological context if they have the same goupings of co-clusteed genes. As a esult, each context is chaacteized by a unique co-clusteing stuctue of genes. Given two contexts and thei espective gene co-expession measues, we compute a diffeential co-expession scoe (DCS, ight sidepanel). The data displayed in this heatmap was geneated by the simulation algoithm (see Methods) at the σ=0.5 noise level. B) Aveage ROC cuves wee obtained fo epeatedly simulated data with noise levels anging fom σ= , with σ=0.5 displayed hee, by aveaging the FPRs (incoectly co-clusteed pais of samples) and TPRs (coectly co-clusteed pais) fo each distinct tee cut level. The cuve fo the DCIM algoithm (blue solid line) is consistently above the cuves fo hieachical clusteing with Euclidean distance (ed dashed line) and Peason coelation (geen dotted line). C) To summaize ROC cuves ove all simulations at a given noise level σ, we compute the aea unde the cuve (AUC) fo each simulation and plot the aveage AUC against σ. The DCIM model is specified in tems of a Bayesian Netwok [42]. A diected acyclic gaph (DAG) is used to specify dependences in the model in tems of diected Makov independence. The local pobability distibutions fo the key vaiables specifying allocation of genes into global clustes (C), allocation of global clustes into local clustes within each context (L) and the allocation of samples into diffeent contexts (D) ae given in tems of the pios deived fom the espective Diichlet pocesses. These distibutions define the pobabilities of each object (gene, global cluste, sample) being allocated in any of the aleady existing goups (global clustes, local clustes, contexts) o into a new goup. The ability to ceate new goups when needed allows us to avoid a pioi specifying the exact numbe of goups of any kind. The 20
22 DAG and local pobabilities define the unique joint pobability distibution of data and all paametes in the model. Posteio distibutions of all paametes, given the data ae estimated using a Gibbs sample. Maginal posteio distibutions of the thee key allocation vaiables (C, D, L) ae summaized in tems of the posteio pai-wise pobabilities (PPPs) of global and local co-expession fo each pai of genes and the PPPs of belonging to the same context fo each pai of samples. It has peviously been shown that such PPPs can be used as the diect estimates of statistical confidence in two genes belonging to the same cluste [41]. Technical details petaining to postulating the model and pefoming statistical infeence ae povided in the Methods section. Computational pocedues fo fitting the model ae implemented in the R package gimmr which can be downloaded feely fom Using the local posteio PPPs of co-expession deived fom the model, we use a heuistic algoithm to seach fo diffeences between the local gene clusteings and identifying genes that ae diffeentially co-expessed between two contexts (see Methods fo details). The highe the esulting diffeential co-expession scoe (DCS) is fo a gene, the moe likely this gene s co-clusteing patnes ae diffeent between the two contexts. In Figue 2.1.A, genes with high DCS between contexts X and Y+Z contexts ae indicated by the thick blue ba on the ighthand side of the heatmap. Genes in cluste 1 distinguish context Y fom contexts X and Z, genes in cluste 2 distinguish context X fom contexts Y and Z. Taken togethe, they define all thee contexts. Recovey of simulated contexts We fist evaluate ou method using a seies of simulated datasets at diffeent noise levels with the data stuctue shown in Figue 2.1.A. Receive Opeating Chaacteistics (ROC) cuves wee constucted by computing the numbe of coectly (tue positives) o incoectly (false 21
23 positives) co-clusteed pais of samples fo each clusteing and compaing it to two taditional hieachical clusteing methods (Figue 2.1.B). ROC cuves wee summaized by calculating the aveage aea unde the cuve (AUC) fo each scenaio. Aveage AUCs wee consistently highe fo ou DCIM algoithm when compaed to taditional clusteing algoithms (Figue 2.1.C) indicating a significantly highe level of pecision in econstucting sample goupings acoss the whole ange of noise levels. To futhe accentuate the conceptual diffeence between the sample goupings based on ou context-building algoithm and taditional similaity measues, we slightly modified the simulation pocedue (Figue 2.2.A), leaving the co-expession stuctue unchanged but modifying the elative expession levels. Fo example, all samples in the fist context still have identical co-expession stuctue, but the mean expession pofile of the fist two samples is diffeent fom the mean expession pofile of the last thee samples. As expected, goupings based on taditional similaity measues no longe coesponded to the undelying context stuctue. In contast, the DCIM algoithm continues to coectly identify the undelying contexts (Figues 2.1.B and 2.1.C). These esults indicate that, in geneal, ou DCIM method is expected to poduce goupings of biological samples that will be diffeent fom the goupings constucted using the taditional similaity measues. 22
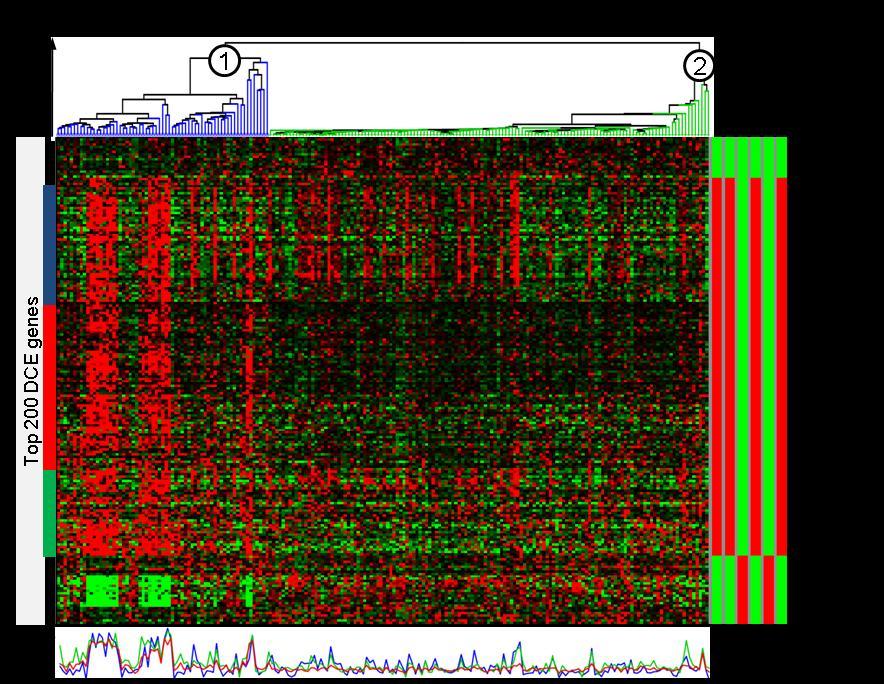
24 Figue 2.2. Diffeences between contexts ae defined by diffeential co-expession, not diffeential expession. A) Heatmap of a simulated data set (σ=0.3) to illustate the imposed gene clustes and contexts. The simulatin pocedue was slightly modified leaving the co-expession stuctue unchanged but modifying the elative expession levels by adding an additional fold change level. B) Gene clusteing ROC cuve at σ=0.5. C) Aveage gene clusteing AUC plotted against σ. Table 2.1: Patient chaacteistics of DCIM deived patient goups fo the Schmidt et al. dataset [43] as shown in Figue 2.3.A (blue and geen sample cluste, espectively). Clinical Paamete Odds atio One-sided Fishe p-value ER status (ER+, ER-) Tumo size ( 2cm, >2cm) Tumo gade (G1, G2, G3) (N/A) Table 2.2: Compaison of computationally deived patient goups fo the Schmidt et al. dataset [43] showing the atio of the numbe of patients placed in poo/favoable suvival goups by both algoithms divided by the numbe of all patients Peason Euclidean k-means DCIM coelation distance Peason coelation Euclidean distance k-means DCIM Identifying molecula subtypes in beast cance gene expession data We examined the biological impotance of uncoveing diffeential co-expession (DCE) stuctue by pefoming altenative molecula sub-typing of beast cance samples in a ecent beast cance gene expession dataset [43]. Figue 2.3.A shows the esulting hieachical 23
25 clusteing of patient samples and the expession pattens of the 200 most diffeentially coexpessed genes which wee selected by anking thei DCS. Two clea sample goups o contexts ae noticeable. A close examination of the samples in these two contexts evealed a high coelation with key clinical paametes such as estogen ecepto (ER) status, tumo gade, and tumo size (Table 2.1). The membeship in the two contexts was also highly pedictive of the disease outcome as indicated by Kaplan-Meie suvival cuves (Figue 2.3.C) (logank p- value = ) and statistically significant diffeences in 10 yea suvival ates (60.9% vs. 81.2%, p-value= ). Taditional similaity/distance measues induced consideably diffeent sample goupings (Table 2.2) which had little o no coelation with the disease outcome (Table 2.3). Table 2.3: Pedicting suvival outcome using diffeent clinical, molecula, and computational methods (Schmidt et al. dataset [43]). Clinical Molecula Computational Size of patient goups logank p- poo favoable value suvival suvival Tumo size ( 2cm, >2cm) Tumo gade (G1, G2/G3) ER status AURKA <, > median expession k-means (k=2) Hieachical Peason coelation clusteing Euclidean distance k-means clusteing DCIM
26 25
.")


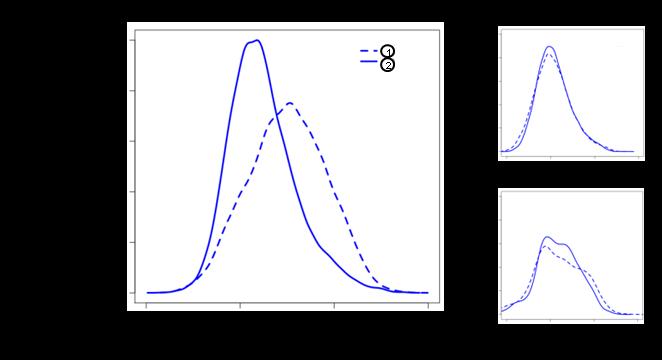
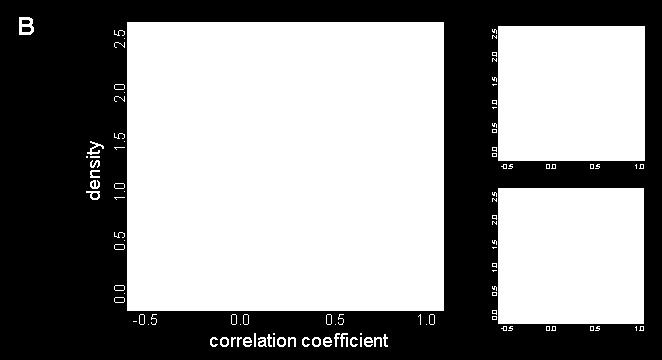
27 Figue 2.3. DCIM deived contexts in beast cance data ae pedictive of patient suvival. DCIM was applied to a lage-scale beast cance dataset[43] identifying contexts and the diffeential co-expession scoe (DCIS). A) Resulting hieachical clusteings of patients wee split at the top level to define two contexts maked (1) and (2) in the top panel displaying a heatmap of the 200 genes with highest gene-specific DCS. The bottom panel shows the aveage expession pofile fo the thee global gene clustes maked in the heatmap with coesponding colo sidebas. Within context (1), all thee gene clustes ae co-expessed following the same patten, while within context (2) the thee clustes have distinguishable expession pattens. The ight-hand panel shows significantly eniched functional categoies fo these genes as detemined by CLEAN [37]. B) Empiical distibution of all paiwise gene-gene coelation coefficients (Peason coelation) fo the 154 genes maked by the left sideba in panel A). Coelation is significantly highe in context (1) (solid line) than in context (2) (dashed line). As contol, the top ight plot shows coelations fo 154 andomly selected genes and the same two contexts while the bottom ight plot shows coelations fo the same genes but with andomly eassigned context labels. C) To estimate patient suvival we compute Kaplan-Meie cuves fo the two contexts. The estimated 10 yea suvival fo the patient goup coesponding to context (1) was 61% compaed to 81% fo context (2). The diffeence between the two cuves was highly significant (logank test p= ). D) We used available dichotomized clinical, molecula, and computational paametes and thei paiwise combinations to fit one-paamete and two-paamete Cox popotional hazad models and assessed the model fit fo each paamete using the Akaike Infomation Citeion (AIC). The model combining DCIM contexts and AURKA expession defined patient goups best pedicts patient suvival (ed box). 26
28 Diffeentially co-expessed genes The functional analysis of the 200 genes most diffeentially co-expessed between the two majo contexts evealed enichment fo genes both positively and negatively associated with ER status (Figue 2.3.A). Genes negatively associated with ER status wee tightly co-egulated within the poo-pognosis samples in context 1, but showed no co-expession within context 2. This cluste was also eniched fo ESR1 egulatoy tagets as established in ecent ChIP-chip expeiments [44]. Genes positively associated with ER status ae also tightly co-egulated foming a lage cluste (blue, ed and geen clustes combined) within context 1, but ae geneally less (ed ba) o not at all (blue and geen ba) co-egulated within context 2. This cluste was also eniched fo Cell Adhesion, Cell Communication, and Mammay Gland Development genes. These diffeential co-expession pattens ae also eflected in the distibution of paiwise coelations shown in Figue 2.3.B. Within context 1, the Peason coelation coefficient between gene pais is significantly highe than within context 2. Complete esults of functional analysis fo the 200 most diffeentially co-expessed genes ae povided in Table A1. Table 2.4: Pedicting suvival outcome using the top 200 DCE genes with diffeent clusteing algoithms (Schmidt et al. dataset [43]). Gene List Euclidean Distance Peason's Coelation k-means Top 200 DCE genes size logank p-value size logank p-value goup 1 goup 2 goup 1 goup 2 goup 1 goup 2 size logank p-value As in the second scenaio of ou simulation study (Figue 2.2), sample goupings based on the diffeential co-expession of genes with the highest DCS wee consideably diffeent than sample goupings geneated by taditional similaity measues on these same genes. Futhemoe, the diffeences in disease outcomes wee much smalle fo the sample goupings 27
29 geneated by the taditional hieachical clusteing methods and k-means algoithm (Table 2.4). This indicates that ou method not only identifies functionally impotant genes, but that the implicit similaity measue based on the diffeential co-expession is necessay to optimally utilize expession pattens of these genes in pedicting the disease outcome. Compaison to othe outcome pedictos We compaed the stength of association between disease outcome and the patient goupings induced by the DCIM algoithm to seveal altenative goupings based on impotant clinical and molecula paametes, and unsupevised clusteing of patient samples based on the taditional similaity measues (Table 2.3). Among the paametes with statistically significant disease outcome pedictive ability wee tumo gade and auoa kinase A (AURKA) gene expession, a polifeation associated gene shown to be a poweful pedicto of suvival fo beast cance [45]. Tumo size and ER status did not yield patient goups significantly diffeent with espect to the disease outcome fo this dataset. Given the high level of enichment of ER status elated genes among diffeentially co-expessed genes, it is paticulaly inteesting that in this dataset ER status on its own was not stongly associated with the disease outcome. Among the unsupevised computational methods we compaed, k-means algoithm and Euclidean distance ceated patient goups with maginally statistically significant diffeences in disease outcome. The unsupevised analysis based on diffeential co-expession yielded the highest statistical significance fo diffeences in suvival between sample goupings. To evaluate the independent contibution of the diffeential co-expession signatue to pedictive models based on othe vaiables, we systematically evaluated the benefit of combining two classification methods using Cox egession. We found that the model significantly impoved 28
30 when including DCIM based classification as compaed to using any othe vaiable alone. In paticula, the model combining DCIM and AURKA expession had the lowest oveall Akaike Infomation Citeion (AIC) (395.3) indicating the best model fit (Figue 2.3.D). Repoducibility of diffeential co-expession signatue acoss independent datasets The epoducibility of DCE scoes was assessed by epeating the analysis on two additional beast cance datasets [46, 47]. The high coelations between DCS and the highly significant ovelaps between lists of genes with highest DCS fo diffeent datasets indicate the epoducibility of diffeential gene co-expession (Figue 2.4). Using infomation fom all thee datasets, we constucted a diffeential co-expession signatue set by selecting 500 genes with top-anking DCSs in all thee datasets. Using only these genes to e-analyze all thee datasets with the DCIM algoithm yielded emakably consistent pattens of diffeential co-expession in all thee datasets (Figue 2.5). The analysis of disease outcomes fo sample goupings induced by diffeential co-expession in these two additional datasets was consistent with the esults fo Schmidt dataset. Despite the fact that the Mille et al. dataset [46] also contained samples fom lymph node positive patients, the oveall gene expession pattens in the two contexts wee concodant to expession pattens in the othe two datasets. The lymph node status was in this case the stongest single pedicto of the disease outcome, but the co-expession signal togethe with the lymph node status povided fo the best model fit in explaining the disease outcome among all 2-pedicto combination. 29
![Figue 2.4. Repoducibility of the gene-specific DCS. The DCIM algoithm was applied to thee beast cance studies (Schmidt et al. [43], GSE11121; Mille et al. [46], GSE3494; Desmedt et al.](/docs-images/90/104353110/images/31-0.jpg "[47], GSE7390) and the pegene DCS wee computed. The top panel shows Peason (lowe tiangle) and Speaman coelation (uppe tiangle) compaing the DCS fo the thee datasets.")
 analyses suggesting that DCIM deived contexts ae consistent.")
31 Figue 2.4. Repoducibility of the gene-specific DCS. The DCIM algoithm was applied to thee beast cance studies (Schmidt et al. [43], GSE11121; Mille et al. [46], GSE3494; Desmedt et al. [47], GSE7390) and the pegene DCS wee computed. The top panel shows Peason (lowe tiangle) and Speaman coelation (uppe tiangle) compaing the DCS fo the thee datasets. To futhe evaluate ou appoach of selecting top-anked genes based on DCS we detemine odds atios (bottom left) and Fishe test p-values (bottom ight) fo cutoffs anging fom 1 to 1,000 in each of the thee paiwise compaisons. Table 2.5: Compaison of patient goupings deived fom individual and joint ( meta -) analyses suggesting that DCIM deived contexts ae consistent. Joint analysis Individual analyses Favoable suvival Poo suvival Favoable suvival 494 (49.9%) 65 (6.6%) Poo suvival 139 (14.1%) 291 (29.4%) 30

32 Figue 2.5. Heatmaps of top 500 DCS gene signatue in thee beast cance studies. Expession pattens ae emakably consistent acoss diffeent datasets. DCIM sample clusteings ae highly coelated with ER status and patient suvival. Meta-analysis based on the diffeential co-expession signatue The pedictive potential of the diffeential co-expession signatue was then tested in the analysis of a supe -set (N = 989) compised of the thee independent datasets descibed above and additional thee studies [22, 48, 49]. Using the DCIM algoithm to cluste samples based on the 500 DC signatue genes (Figue 2.6), we again obseved a patient gouping with significantly diffeent disease outcomes (logank p = ), highly significant coespondence to the 31


33 goupings found when analyzing the data sets individually (Table 2.5, odds atio = 15.9, Fishe p-value = ), and the coelation to ER status and tumo gade (Figue 2.6). Figue 2.6. Heatmaps of top 500 DCS gene signatue in beast cance meta-study. Expession pattens ae emakably consistent with individual datasets. DCIM sample clusteings ae highly coelated with ER status, tumo gade, and patient suvival. Discussion and Conclusions We have developed a novel model-based pobabilistic method, DCIM, which allows us to oganize biological samples into contexts based on thei similaity of goupings of co-clusteed genes. This definition of similaity is diffeent fom commonly used appoaches whee the 32
34 similaity between sample gene expession pofiles is a function of diffeences between expession levels fo individual genes. We demonstated that beast cance sample goupings based on diffeential co-expession ae moe stongly coelated with the disease outcome than the sample goupings poduced by taditional clusteing techniques. This echoes ealie findings showing that some disease-elated genes ae not diffeentially expessed but diffeentially co-expessed. In one paticula application, gene expession of developing muscle tissue in a bovine animal model (Wagyu cattle) was compaed to a double-muscled model (Piedmontese cattle) expessing a vesion of the myostatin (MSTN) tansciption facto known to cay the causal mutation fo the obseved phenotype. This gene was not diffeentially expessed in multiple studies but was identified as diffeentially co-expessed with downsteam tansciptional tagets such as MYL2 [36]. Diffeentially co-expessed genes identified by ou algoithm ae functionally elated to the etiology of beast cance and ae epoducible acoss independent beast cance datasets. Finally, the DC signatue was complementay to othe clinical, pathological and molecula pedictos impoving upon the pecision of any othe single pedicto when used in the multivaiate analysis. The geneal featues of expession pofiles as well as lists of diffeentially co-expessed genes wee highly epoducible acoss diffeent datasets. When used to in the meta-analysis of a combined dataset consisting of 989 beast cance samples based on the DC signatue, DCIM algoithm poduced sample goupings that wee stikingly concodant with sample goupings obtained in sepaate analyses of individual datasets. Gene expession pofiling of beast cance samples has been used to deive numeous distinct, but often ovelapping gene lists that ae pedictive of the disease outcome [23]. On the 33
35 othe hand, it has been shown that the gene expession pofile of a single gene (AURKA) can seve as a suogate fo the pedictive ability of most of such lists [45]. Indeed, AURKA, along with many othe polifeative makes is among the top genes that ae diffeentially expessed in the classical sense between the sample gouping geneated by the DCIM algoithm (Table A.2). Moe inteestingly, we found that ou 500 gene DC signatue has significant ovelap with the expeimentally deived list of intinsic genes [21] (Table 2.6). The intinsic genes signatue consisting of genes with high between-to-within-tumo atio of vaiability in expession, has seved as the gold standad fo moleculaly classifying beast tumos [21, 50, 51], and has also been shown to contain the pedictive ability independent of the clinical paametes. The significant ovelap between with intinsic genes set indicates that ou unsupevised algoithm is capable of identifying a subset of the expeimentally identified infomative gene set that could not be identified by any othe cuently available clusteing algoithm. Table 2.6: Ovelap of the 500 DCS signatue with othe well-known beast cance signatues. Gene List Refeence OR Fishe p Tumo subtypes ( Intinsic beast cance genes ) Hu et al. [21] E-30 Histologic gade Sotiiou et al. [22] E-03 Cinical outcome ( 70-genes signatue ) van't Vee et al. [19] E-03 Metastasis ( 76-genes signatue ) Wang et al. [20] E-01 Methods Infinite mixtue model Motivation. In a typical application we have a set of gene expession signatues of biological samples which epesent a ange of diffeent phenotypes. Examples include clinical 34
36 paametes such as age, gende, tumo stage and tumo gade o molecula paametes such as estogen ecepto (ER) and pogesteone ecepto (PR) status. The diffeent phenotypes likely coespond to a host of genetic pathways and othe egulatoy pogams egulating the many functions of a cell within the paticula tissue samples. Some of the activated pathways ae expected to be common to all of the samples unde investigation while othes ae likely to be specific to a paticula subset of samples. Liu et al. show that explicitly accounting fo diffeent sample subtypes (o contexts) significantly impoves gene clusteing but thei appoach equies a-pioi definition of contexts [41]. Howeve, the optimal definition contexts based on clinical paametes is not always known o obvious but may, fo example, coespond to molecula beast cance subtypes [18, 51]. We theefoe hee popose a method to infe contexts diectly fom the data. Figue 2.1 illustates the ationale fo ou Diffeential Co-expession Infinite Mixtues (DCIM) model. As in Liu et al. [41] we call a goup of samples of the same subtype context. A goup of genes co-expessed in all contexts is a global cluste, that is, these genes have a common expession patten acoss all samples in the expeiment. The common expession is assumed to be deived fom a common undelying patten. Global clustes that ae indistinguishable locally, that is, within a given context, ae gouped futhe into a local cluste of co-expessed genes. Convesely, goups of genes that ae co-expessed (o co-clusteed) only within specific subsets of samples but not acoss all samples theeby define contexts. As a esult, each context is chaacteized by a unique gene co-clusteing stuctue. To fomally descibe global and local gene clustes as well as contexts and thei elation to the measued intensities we postulate the above mentioned Bayesian infinite mixtue model. 35
37 Model paametes. Suppose we have a gene expession dataset fo N genes and M biological samples o expeimental conditions, X is the N M expession matix whee x ij is the elative expession level of gene i in sample j. Accodingly, x i =( x i1, x i2,, x im ) is the expession pofile fo gene I and x T j =( x 1j, x 2j,, x Nj ) T is the expession signatue fo sample j. x i is assumed to be geneated by one out of Q undelying pattens. C = (c 1, c 2,, c N ) T is the coesponding index vaiable; c i = q means that expession pofile x i is geneated by undelying patten q, q = 1,, Q, Q N. Pattens ae epesented by the M-vaiate nomal distibution Ν M (μ q, Σ q ), that is, c i = q implies x i ~ Ν M (μ q, Σ q ). Likewise, samples within the same biological context ae assumed to geneate simila expession signatues. D = (d 1, d 2,, d M ) is an M-dimensional index vaiable d j = means that expession signatue x T j is assumed to oiginate fom context = 1,, R M and each context compises 1 M M samples o expeimental conditions. The two exteme cases ae R = 1 and R = M. The fome means that all expession signatues oiginate fom the same context and is equivalent to a simple clusteing model, whee contexts ae not defined. The latte means that each sample defines its own context. Given D and a gene expession pofile x i, R subpofiles x 1 i, x 2 i,, x R i ae defined such that x i = (x ij (1), x ij (2),, x ij (M)) and d j = fo expession signatues j (1), j (2),, j (M ). In othe wods, the R contexts define R subpofiles of a given gene expession pofile. Each expession pofile is gouped into one of Q clustes epesenting the undelying oveall pattens. We tem this the global gene clusteing. Thus, each subpofile of an expession pofile is implicitly gouped into one of Q global clustes. Locally howeve, that is, within a given context, goups of subpofiles may be indistinguishable and theefoe fom local goups of subpofiles temed local clustes. In othe wods, global gene clustes ae gouped futhe into 36

.")
38 37 local gene clustes depending on the biological context of the sample. The local gene clusteing stuctue is epesented by a Q R matix L whee l q = t means that, within context, global cluste q is gouped into local cluste t. Figue 2.7. Diected Acyclic gaph descibing the DCIM computational model. Nodes epesent andom vaiables and edges indicate dependencies between nodes such that each andom vaiable is conditionally independent of its non-descendents given its paent nodes (local Makov popety). Model specification. To specify the distibution of the expession data as well as the paametes descibed above we postulate a Bayesian hieachical model [52] displayed as a Diected Acyclic Gaph [42] in Figue 2.7. Hee, nodes epesent andom vaiables and edges between the nodes indicate dependencies between nodes such that each andom vaiable is conditionally independent of its non-descendents given its paent nodes (local Makov popety). The joint pobability distibution of the andom vaiables is given by ) ( ) ( (a) ) ( ) ( ) ( ) ( ), ( a ) ( ) ( ), ( ),, ( ) ( ),, ( ), a,,,,,,,,,,,, ( * * * p p p p p a p p M p D p a L p p M D L M p C p M C X p a M M L D C X p
39 whee M,..., } and,..., } ae the mean vectos and vaiance-covaiance { 1 Q { 1 Q matices defining the expession pattens x, that is, p x c q, M, ) f ( x, ), i ( i i N i q q f (, ) is the multivaiate nomal distibution function. Distibutions fo the andom N vaiables defining the global gene clusteing C, local gene clusteing L, and sample to context assignment D each ae defined accoding to the infinite mixtue paadigm that does not equie a pioi specification of the numbe of clustes and contexts, espectively [15, 41]. Fo example, the pio pobability that a sample j will be placed in aleady existing context is n j, p ( d D, a ) j while the pio pobability of j being placed in a new context is M 1 a a p( d d, j j' D, a ) whee n j j ' j, is the numbe of samples cuently in M 1 a context without j. Pobability distibutions fo the othe paametes have been descibed peviously [41] and ae listed below. Vaiables in the model: x i =(x i1, x i2,, x im ), i=1,,n obseved gene expession pofiles fo all N genes q =( q1,, qm ), q=1,,q the mean pofile fo global cluste q x i =(x ij (1), x ij (2),, x ij (M)) whee d j =, =1,,R is the expession pofile fo gene i within context, i=1,,q * μ t, mean expession pofile fo the local cluste t within context M=( 1,, Q ) Σ=( 1,, Q ), whee each q is a diagonal matix with context-specific cluste vaiances on the diagonal, that is q =diag( (σ,..., σ ), (σ,..., σ ),..., (σ,..., σ ) q1 q1 q2 q2 qr qr ) M * * * * * = [( μ,..., μ ),..., ( μ,..., μ )] 11 Q 11 1 R Q R R 38
40 Hypepaametes λ,, and ae all assumed to be context-specific: =( 1,, R ), =( 1,, R ), =( 1,, R ); λ=(λ 1,,λ R ), λ = (λ 1,,λ M) whee M is the numbe of samples within context. Conditional distibutions given paent nodes: p( x c q, M, ) f ( x μ, Σ ) i i N i q q * * p( ( μ, μ,..., μ ) L, M, ) ( f ( μ μ, Σ ), f ( μ μ, Σ ),..., f ( μ μ, Σ ) q1 q2 qr N q1 L 1 1 N q2 L 2 2 N qr L R R q1 * q2 * qr p ( c i q C - i, ) n i, q N -1 α, q=1,,q, p ( c i c i', i' i C - i, ) α T - 1 α, i=1,,n, whee n -i,q is the numbe of pofiles placed in global cluste q not counting the pofile i p (L q t C, a ) n -qt Q -1 a, t=1,..,q, a ( L kf L k' f, k' k C, a ) Q -1 a p whee n -qt is the numbe of global clustes cuently placed in local cluste t within context without counting the q th global cluste * * -1 p( μ λ, τ ) f ( μ λ, τ I) p - 2 β β υ (σ β, υ ) f - 2 t (σ, ) t N t t G t 2 2, =1,,R -2 p 2 1 σ (υ σ ) f x (υ, ) x G 2 2 p 1 1 ( β ) f (β, 2 2 ) G 2 p 2 1 σ (τ σ ) f x (τ, ) x G 2 2 (, σ 2 ) (, σ 2 p λ μ f λ μ I ) x x N x x -1 p(α ) whee f G -1 (α 1 1, ) 2 2 μ x N i 1 N x i σ 2 x N i 1 ( x i μ x N n )`( x -1 i μ x ) Posteio Conditional Distibutions: 39
41 40 ) n σ n σ, n σ n σ ( ),,, σ L,, ( * t 2 t 1 * t 2 t 1 * t 2 t 1 * t 2 t t 1 * t 2 t t I λ x μ λ X C μ * N f p, whee * t t L i t n c i x x and * t n is the total numbe of expession pofiles gouped in global clustes which ae place in the local cluste t within the context. Similaly, the vaiance fo all global clustes place in the local cluste t within the context is ) 2 υ β, 2 β n σ ( ) υ, β, σ ( 2 t * t f - 2 t - 2 t s f p G M X,, whee t L * t i * t i 2 t c i ) )`( ( μ x μ x s ) Q τ σ Q τ σ, Q σ Q τ Q σ ( ) τ,,..., ( 1 2 x 1 2 x -1 2 x x 1 K 1 t t 2 x Q 1 f I μ μ λ μ μ λ * * * N f f ) 2 σ ) - )`( - (, 2 1 Q n τ ( ),..., τ ( 2 x Q 1 t * t * t 1 * Q * 1 1 λ μ λ μ λ, μ μ f G f ) 2 σ σ β, 2 1 β Q (υ ) β, σ,..., σ υ ( - 2 x Q 1 t - 2 t - 2 Q f G f Q 1 t -2 t 2 β - 2 t ) β (Q - 2 t -2 t 2 ) β υ σ - exp ) σ (υ 2 β exp ) 2 β )( 2 β ( ) υ, σ,..., σ β ( f α) ( N (α ) ) 2α 1 exp( α N ) Q, α ( 2 3 Q - f ), ( α N -1 n ),,,, q c ( q q i q i, i i i Σ μ x Σ M x L C - N f p q q q q q q i 2 i i i' i d d,, ( ), ( α N -1 α ) σ,,, i i', c c ( Σ μ ) λ Σ μ Σ μ x μ x C x x - p f p N
42 p (L q t X, a ) n -qt Q - 1 a f N ( x q f μ * t σ, n 2 t q I) 2 a q * σ σ t * t * 2 p (L L, k' k X, a ) ( x μ, I) ( μ, ) d( μ, σ ) k k' t t t t Q - 1 a f p, whee n N -i,q is the numbe of n n q pofiles in global cluste q without counting pofile i, and n -qt is the numbe of global clustes 2 q gouped into local cluste t within context not counting q th global cluste, and x i q c i q x. n q Model fit. Given data, that is, a set of gene expession pofiles, the goal is to estimate the * posteio distibution of the model paametes p( C, D, L, M, M,,,,, a, a,, X ) and in paticula, the maginal distibution of paametes C, L, and D given the data, which descibe the gene clusteings and the contexts. We accomplish this goal by implementing a Gibbs sample [53], a Makov chain Monte Calo algoithm that can be used when the conditional pobability fo each andom vaiable in the model is known given all othe vaiables. Ou implementation is an extension of the peviously descibed algoithm [41]. In paticula, we use the following posteio conditional pobability distibution to update contexts D, that is, to place sample j into existing context : p ( d j Q n - j x, D, L,, λ, ) f j -j N M 1 a q 1 {i c i t, Lt q} ( x μ, ) p ( μ, λ, ) dμ i j jq q jq q jq p ( d j d j ', j j' x j, D -j Q a i, C,, λ, ) f ( x μ, ) p ( μ, λ, ) dμ j jq q jq q M 1 a N q 1 {i c i q} jq Notice that we integate out the paamete μ q in the likelihood function. As a esult, the posteio pobability function does not depend on the mean vectos but it accounts fo the 41
43 specific local gene clusteings L, that is, the bette a local clusteing L fits sample j the highe the likelihood. All othe conditional posteio distibution functions ae as descibed in [41] and epoduced above. We also adapt the evese annealing pocedue [16, 41] to counteact situations whee the Gibbs samples do not mix well. To summaize the Gibbs samples of clusteing vaiable C and the context vaiable D we use the peviously descibed appoach of fist aveaging clusteings thus computing posteio paiwise pobabilities (PPPs) and then geneating a hieachical clusteing with the PPPs as the similaity measue and aveage linkage as the agglomeation stategy [15, 41]. We extend this appoach to compute local o context-specific PPPs. Let S be a context, S = {sample j }. Afte each Gibbs step g, we have ecoded the paametes C(g), D(g), and L(g). Given g, we can now geneate a sample-specific clusteing C s (g) := (c (s)1 (g), c (s)2 (g),, c (s)n (g)) T, fo all s in S, whee o C s (g) is an index vaiable. c (s)i = q (s) means, that, afte Gibbs step g, fo sample s, gene i was assigned to sample-specific cluste q (s) o o d s (g) = (i.e., sample s was in context afte Gibbs step g ), l q (g) = t (i.e., within context, global cluste q was gouped into local cluste t afte Gibbs step g ) o o c i (g)= q (i.e., gene i was assigned to global cluste q afte Gibbs step g ) c (s)i (g) := t In othe wods, the sample-specific local clusteing afte each Gibbs step is identical to the local clusteing coesponding to the context the sample was a membe of afte that Gibbs step. C s (g) is geneated fo all samples s in S and fo all Gibbs steps afte the bun-in phase. 42
44 Local PPPs specific to context S can now be computed fo all gene pais using the same pocedue as fo the global gene PPPs. Availability. The above descibed algoithms ae available as pat of the R package gimmr which can be downloaed fom ou website ( The softwae geneates output files that can be viewed and analyzed both diectly in R [54] and using the FTeeView pogam [37]. A list of the R functions contibuted to the gimmr package and shot desciptions can be found in Appendix B. Diffeential co-expession scoe As descibed above, ou model descibes goups of samples o contexts and both global and local, that is context-specific, gene clusteings. Given this famewok and given two contexts, we conside a pai of genes diffeentially co-expessed (DCE), if they ae co-clusteed in one context, but not in the othe. Contexts ae use-defined but this choice is typically guided by the posteio distibution of the D paamete in the model. The definition of co-expession depends on pais if not lage goups of genes, but it does not depend on goupings of samples. Gene co-expession goups (i.e., clustes) can be viewed by the use with tools such as TeeView [55] which also facilitate futhe analysis such as detemining functional enichment of gene clustes [37]. Diffeential expession efes to single genes but depends on at least two goups of samples. In this case, eseaches ae accustomed to assigning a scoe (fold change, p-value, etc.) to each gene allowing them to ank and pioitize genes. The challenge with the analysis of diffeential co-expession lies in the fact that it depends on goupings of both, genes and biological samples. Simultaneously viewing clusteings fo two contexts would be too complex fo all pactical puposes as would be an 43
45 attempt to pioitize pais of genes based on a scoe. Theefoe, we hee popose a gene-specific diffeential co-expession scoe (DCS) which assigns a single numbe to each gene while at the same time accounting fo the context-specific clusteings of the genes. The intuition being that the majoity of genes typically will emain co-clusteed with the same goup of genes egadless of context. A smalle numbe of genes, howeve, ae expected to have changing co-expession pattens. This behavio is eflected in the diffeences of paiwise gene distances fo the contextspecific clusteings. The scoe will be computed by aveaging these diffeences fo each gene, not ove all possible gene pais but ove only the pais within a local gene cluste within eithe context. Given two contexts c 1 and c 2, we compute the gene-specific DCS as follows: Algoithm 2.1. Gene-specific DCS. 1) Fo each context c, a. Compute the N N posteio paiwise pobability (PPP) matix of any two genes being co-clusteed within c b. Constuct the hieachical tee T c by applying aveage linkage hieachical clusteing with the local PPP matix as similaity measue 2) Calculate the N N matix D iff =(d) N,N = abs(ppp c1 -PPP c2 ) of absolute diffeences between the two PPP matices 3) Fo each context c, 44
46 a. Cut T c at all possible levels to obtain a list of gene clustes G c whee cutting T c at level (1-p) induces a gene clusteing such that the aveage PPP between each pai of genes within a esulting cluste is geate than p. b. Fo each gene cluste g in G c i. Fo each gene i, compute the scoe DCS cluste (i, g, c) DCS cluste (i, g, c) = Σd ij /( g -1), if genes i,j ae in g, i j, and g is size of cluste g. DCS cluste (i, g, c) = 0, if i is not in g. 4) Fo each gene i, compute the gene-specific scoe DCS gene (i) = max {g,c} (DCS cluste (i, g, c)) Simulation study We designed a simple data simulation pocedue to study the ability of diffeent algoithms to coectly identify gene clustes and sample clustes o contexts as peviously descibed [41]. As in the example shown in Figue 2.1, each simulated N M data matix X compises fou gene clustes and thee contexts. Clustes 1 and 2 each have 20 genes while clustes 3 and 4 each have 80 genes. Each of the thee contexts has five samples. Thus, M=15 and N=200. Each gene expession pofile x i is assumed to be geneated by one of fou undelying pattens epesenting the fou gene clustes such that x i ~ N(μ c, σ 2 ), μ c = (μ c1,, μ cm ) and gene i is geneated by patten c. Fo clustes 3 and 4, μ c is assumed to be identical fo all samples, that is low (=0) and high (=1), espectively. In contast, fo cluste 1, μ c is assumed to be high fo samples 1-5 and low fo samples 6-15 while fo cluste 2, μ c is high fo samples Thus, only gene clustes 1 and 2 allow distinguishing the thee contexts. The 45
47 noise paamete σ is the same fo all clustes and context anging fom 0.4 to 0.8. Each simulation is epeated 100 times. Figue 2.1 shows a heatmap of one of the simulated datasets at the σ=0.5 noise level. In addition, we slightly modify the pocedue descibed above to geneate a second set of simulations whee the high values ae set to 2 instead of 1 fo samples 1-2, 6-8, and thus leaving the co-expession pattens (and contexts) intact but changing the expession levels in some samples (Figue 2.2). Given a hieachical clusteing of samples, we compute Receive Opeating Chaacteistics (ROC) based on the numbe of coectly o incoectly co-clusteed pais of samples afte cutting the tee at each possible distinct level (1.. M). Given hieachical tee T and level p, cutting T hoizontally at level p induces a sample clusteing with N p clustes, 1 N p M. Fo a given level p, we can theefoe compute the tue positive ate (TPR) and false positive ate (FPR) by assessing fo each pai of co-clusteed samples whethe o not they both ae in the same tue context. As a esult, we have M FPR-TPR pais, one fo each cutting level, and can plot the ROC cuve. We aveage ROC cuves ove multiple simulations by aveaging the coesponding FPRs and TPRs at each distinct tee cutting level. Since the ROC cuves ae piecewise linea it is staightfowad to compute the aea unde the cuve (AUC). Compaing the pefomance of two clusteing algoithms we cannot assume independence between AUC measues as they also depend on the difficulty of the paticula simulated dataset. We theefoe use a paied t-test athe than the unpaied test to compae AUCs of DCIM to othe methods at a given noise level with DCIM as the efeence. We compute eo bas fo the AUC plots using the 95% confidence inteval of the paied t-test statistic. 46
48 Beast cance studies Data pepocessing and gene selection. Raw data files (Affymetix HG-U133A, HG- U CEL files) fo six human beast cance datasets (GEO expession seies GSE11121 [43], GSE1456 [48], GSE2990 [22], GSE3494 [46], GSE7390 [47], and GSE9195 [49] wee downloaded fom the public epositoy GEO [56]. Each dataset was RMA-pepocessed [57] sepaately using the Entez Gene-based custom CDF (vesion 10) fom the Psychiaty/MBNI Micoaay Lab at the Univesity of Michigan ( Bainaay ) [58]. We applied a mild vaiation filte using Cance Outlie Pofile Analysis (COPA, 95 th pecentile) [59] to select the top 10,000 genes to be clusteed in each of the human beast cance datasets. In each dataset expession pofiles wee centeed by setting the median expession value of each gene to zeo (subtacting the gene-specific medians). Table 2.7 summaizes patient chaacteistics fo the thee independent datasets. Table 2.7: Oveview of the beast cance studies used. Refeence [43] [46] [47] GEO accession GSE11121 GSE3494 GSE7390 Numbe of patients Endpoint Metastasis-fee suvival Disease-specific suvival Metastasis-fee suvival Teatment Sugey, 110 (43%) Sugey, 125 (63%) also patients also eceived eceived iadiation adjuvant theapy Sugey ER status (+/-/NA) 162/38/- 213/34/4 134/34/- LN status (+/-/NA) -/200/- 84/158/9 -/198/- Tumo gade (1/2/3/NA) 29/136/35/- 67/128/54/2 30/83/83/2 Age (yeas): mean (standad deviation) 60 (12) 62 (14) 46 (7) Tumo size (cm): mean (standad deviation) 2.1 (1.0) 2.2 (1.3) 2.2 (0.8) 47
49 We ceated a joint expession data set fom these six data sets as follows. Fist we identified unique patient samples based on the patient annotation made available on the GEO website. Next, we RMA-pepocessed and pe-gene nomalized all unique samples sepaately fo each micoaay platfom (Affymetix HG-U133A and HG-U , espectively) again using the Entez Gene-based custom CDF (vesion 10). Finally, we combined the esulting expession sets by matching all 11,961 Entez Gene ID based pobesets epesented on both platfoms. Suvival analysis and othe statistical analyses. We computed Kaplan-Meie cuves and Cox popotional hazad egession using the suvival package in R [54]. Suvival times and end points togethe with othe annotation data wee obtained diectly fom the GEO website using the GEOquey R package. Whee multiple end points wee available we chose diseasespecific o metastasis-fee suvival athe than oveall suvival (Table 2.7). The included studies diffeed consideably by obsevation time while typical endpoints in clinical tials ae 5 yea oveall o disease-specific suvival. To make esults moe compaable acoss studies we theefoe censoed the obsevation time at 5 and/o 10 yeas. Fo the Cox popotional hazad model fit, we dichotomized paametes as follows. Tumo size: /> 2cm; tumo gade: gade 1/gades 2 and 3; ER status: +/-; AURKA gene expession (median): /> median afte pepocessing; AURKA gene expession (k-means): cluste 1/cluste 2; computational methods: cluste 1/cluste 2. All statistical analyses wee pefomed using the statistical pogamming envionment R vesion [54] and Bioconducto elease 2.2 [60]. This includes othe clusteing algoithms, namely hieachical clusteing with Euclidean distance o 1-Peason coelation as distance measue and k-means clusteing. We applied aveage linkage as the agglomeation stategy 48
50 when DCIM s 1-PPP o 1-Peason coelation was the distance measue and complete linkage fo Euclidean distance. Unless othewise stated, k-means implies k=2. Fo functional annotation of gene lists and clusteings was done with the R package CLEAN [37] with functional categoies deived fom GO [61], KEGG [62], L2L [63], among othe computationally and liteatue deived categoies. An R package containing the DCIM algoithm and the scipts used fo ou analysis ae available at the supplemental website ( 49
51 Chapte III: CLEAN CLusteing Enichment ANalysis 2 Backgound Identifying goups of co-expessed genes though cluste analysis has been successfully used to elucidate affected biological pathways and postulate tansciptional egulatoy mechanisms [64, 65]. The integation of biological knowledge in such analyses has been most commonly facilitated by assessing the enichment of clustes with genes fom pe-defined functionally coheent gene lists ( functional categoies ). The concept of functionally elated genes clusteing togethe has been established by ad-hoc visual examination of hieachical clusteing esults and thei enichment by genes fom the same functional categoy [11]. The fist assessment of statistical significance of such enichments was pefomed by analyzing esults of k-means clusteing [12] using the hypegeometic distibution [66]. Simila stategies have also been used in the analysis of lists of diffeentially expessed genes [67], gene lists constucted based on genome-wide Chomatin Immunopecipitation (ChIP) [68, 69] and epigenomics expeiments [70], as well as the geneal appoach to integate lists of genes deived by vaious expeimental and knowledge-based pocedues [71]. Intoducing biological knowledge though such post-hoc analysis has been impotant fo intepeting esults and sepaating epoducible, biologically meaningful gene clustes fom clustes that may have esulted fom andom fluctuations in the data. Fo both of these objectives, epoducibility of conclusions made is of utmost impotance. 2 This chapte has peviously been published in [37]. 50
52 The fist two concept defining papes [11, 66] also highlight the dichotomy that exists in using hieachical vs. patitioning clusteing pocedues to this days. Hieachical pocedues do not necessitate specifying the ight numbe of clustes, a paamete geneally unknown in advance whose estimation fom the data leads to instability in clusteing esults [15]. On the othe hand, selecting meaningful clustes in a hieachical clusteing that can be then coelated with functional categoies using the hypegeometic distibution is still mostly pefomed by adhoc visual inspection of elated heatmaps. Algoithms fo systematic testing of all possible clustes have also been developed [72-74], but esults of such analyses ae difficult to summaize. Postulating the ight numbe of clustes o choosing good clustes in an ad-hoc fashion befoe coelating them with functional categoies can esult in poo epoducibility since a slightly diffeent numbe of clustes o slightly diffeent good clustes can esult in a diffeent intepetation of the esults. This poblem is akin to choosing the optimal cut-off citeia fo selecting diffeentially expessed genes befoe pefoming simila functional analyses. It has been shown that esults of such analyses ae highly sensitive to changes in the cut-off used with diffeent cut-offs yielding diffeent conclusions [75]. In the analysis of diffeentially expessed genes computational altenatives have been developed that do not equie setting such thesholds [76-78], but they ae geneally not applicable in the knowledgebased assessment of clusteing esults. A fequently encounteed poblem in analyzing genome-wide expeimental data is to choose among esults poduced by diffeent clusteing algoithms. Citeia such as homogeneity and sepaation ae elatively staightfowad to compute but ae mostly of theoetical inteest. A moe elevant citeion fom a biological pespective is the oveall functional coheence of esulting gene clustes. Most of the methods developed to date fo this pupose equie 51
53 specification of the numbe of clustes [79, 80]. Compaing diffeent methods at a fixed numbe of clustes is poblematic as some methods might ceate a bette clusteing stuctue when moe clustes ae allowed and othes could ceate bette clusteings when few clustes ae allowed. To cicumvent this poblem ROC cuves have been used to assess false and tue positive ates of coclusteed gene pais using the functional categoies as a gold standad [41, 81]. Howeve, this same stategy lacked disciminative powe when a lage numbe of lage functional categoies, such as Gene Ontology (GO) tems, seved as a gold standad and equied again fixing the numbe of clustes [81, 82]. We developed an analytical famewok and flexible computational infastuctue fo integating knowledge-based functional categoies into the cluste analysis of gene expession data. The famewok is based on the simple, conceptually appealing and biologically intepetable gene-specific functional coheence CLusteing Enichment ANalysis (CLEAN) scoe deived by coelating the clusteing stuctue as a whole with functional categoies of inteest. The CLEAN scoe is gene-specific and it diffeentiates between the levels of functional coheence fo genes within the same cluste. The statistical significance of coheence scoes is established by compaing them to the empiical null-distibution obtained by andomly pemuting gene identifies. The coesponding computational infastuctue is based on an opensouce R package fo the data analysis and open-souce Java viewe fo visually integating and analyzing expession data and associated knowledge-based functional categoies. We investigate the epoducibility of the findings based on the CLEAN scoes, and demonstate its utility in compaing the functional coheence of clusteings poduced by diffeent algoithms and in selecting genes with infomative expession pattens. Being gene-specific, the CLEAN scoe facilitates easy compaisons of functional coheence of diffeent hieachical 52
54 stuctues (e.g., geneated by diffeent clusteing algoithms) and selection of genes based on functional coheence of thei expession patten without the need to fix the numbe of clustes. On the othe hand, we demonstate that diffeentiating between the levels of functional coheence fo genes within the same cluste leads to significant impovements in epoducibility of findings acoss independent micoaay datasets when compaed to taditional cluste-wide analyses. Futhemoe, genes selected based on the CLEAN scoe poduced moe pecise sample goupings than genes selected using the cluste-wide scoe. Results Given a hieachical clusteing of genes based on thei expession pofiles and a set of functional categoies (e.g., Gene Ontologies), the CLusteing Enichment ANalysis (CLEAN) scoe fo a gene is calculated as follows (Figue 3.1): 1. Fishe s exact test fo enichment is calculated fo all functional categoies containing the gene and fo all possible clustes containing this gene. (Figue 3.1). 2. The CLEAN scoe is then computed as the maximum log 10 (q-value) of enichment tests acoss all pais of clustes containing the gene and functional categoies containing the gene (see methods fo details). The clusteing-specific null-distibution of the CLEAN scoe is established by andomly pemuting gene identifies. Statistically significant scoes ae then used to facilitate selection of genes o gene clustes, as well as the assessment of functional coheence and the compaison of clusteing esults poduced by diffeent algoithms. The integated clusteing viewe/bowse, 53

55 Functional TeeView (FTeeView), is used fo integative bowsing and visual display of gene clustes and associated functional categoies. Figue 3.1. Calculating functional coheence scoes. Given a hieachical clusteing of genes based on thei expession pofiles and a set of functional categoies (e.g., Gene Ontologies), the CLusteing Enichment ANalysis (CLEAN) scoe fo a gene is calculated as the maximum of log(fishe s Exact Test q-value) of enichment tests acoss all pais of clustes containing the gene and functional categoies containing the gene (see methods fo details). The Cluste-wide CLEAN scoe (cwclean) is calculated in a simila fashion except that the maximum is taken ove all clustes that contain the gene and all functional categoies egadless of whethe they contain the gene o not. When multiple categoy types ae used, the joint CLEAN scoe is calculated as the maximum of CLEAN scoes fo each categoy type. Hee we focus on thee sets of functional categoies: Gene Ontology (GO) categoies [61], Kyoto Encyclopedia of Genes and Genomes (KEGG) pathways [62, 83], and a custom set of Co-egulation Goups (CG) based on the computational analysis of gene pomotes and egulatoy motif definitions in the Tansfac database, vesion 12.1 [84] (see methods). All cuently used algoithms assign statistical significance of functional enichment to whole clustes instead of individual genes within the cluste. To compae the popeties of the 54
56 CLEAN scoe to cuently used methods we define a cluste-wide CLEAN (cwclean) scoe to seve as a suogate fo this taditional type of analysis. The cwclean scoe is defined as the maximum of log 10 (q-value) fo all clustes containing the gene egadless of whethe the eniched functional categoies contain the gene o not (Figue 3.1). We analyzed seveal public micoaay datasets to demonstate the statistical popeties and utility of the CLEAN famewok, and to compae its pefomance to taditionally used appoaches. Compaing clusteing esults using the CLEAN scoe The CLEAN scoe povides a tool to compae the functional coheence of clusteing esults poduced by diffeent clusteing algoithms on a gene-by-gene basis without equiing a pe-defined numbe of gene clustes. We used fou independent lage-scale beast cance gene expession datasets [43, 46-48] to demonstate utility of the CLEAN scoe in choosing the clusteing stuctue with the highest functional coheence. Fo each dataset we compaed the pefomance of thee typical clusteing algoithms: Context specific infinite mixtue model (CSIMM) [41], Euclidean distance based and Peason s coelation based hieachical clusteing. Fo all thee algoithms, the hieachical clusteing was constucted using the aveage linkage pinciple and algoithms wee applied to expession data with and without pio vaianceescaling (see methods). Clusteing algoithms wee used to cluste data fom fou independent beast cance gene expession datasets with GEO accession numbes GSE1456 [48], GSE3494 [46], GSE7390 [47], and GSE11121 [43]. 55
57 Figue 3.2. Compaison of clusteing methods. We compaed functional coheence of six clusteing algoithms: Context specific infinite mixtue model (CSIMM), Euclidean distance based and Peason s coelation based hieachical clusteing with and without pio vaiance-escaling of the data, acoss fou independent human beast cance datasets (GEO expession seies GSE1456 [48], GSE3494 [46], GSE7390 [47], and GSE11121 [43]). Fo all six algoithms, the hieachical clusteing was constucted using the aveage linkage pinciple. The numbe of genes common in all fou datasets afte filteing was 6,150. CLEAN scoes ae plotted against the x-axis and the coesponding numbe of genes with the CLEAN geate than this ae plotted against the y-axis. Highe aeas unde the cuve imply the highe functional coheence. Fo each clusteing algoithm the total numbe of genes (y-axis) with the CLEAN scoe as high o highe than the given theshold was plotted against all possible theshold levels (x-axis). Thee ae two conclusions that can be immediately made based on esults in Figue 3.2. Fist, 56
58 vaiance-based escaling of the data significantly impoved the functional coheence of esulting clusteing. While the CSIMM model is capable of compensating this effect to some extent, the pefomance of both CSIMM and Euclidean distance based algoithms impoved afte data was e-scaled. Since the Peason s coelation coefficient implicitly pefoms such e-scaling, thee is little diffeence between its pefomance with and without e-scaling. Afte the data was escaled, all thee algoithms pefom almost identically indicating that the e-scaling is the key step in impoving the functional coheence of the data. The second conclusion is that these nontivial esults ae pefectly epoducible acoss fou independent beast cance datasets, which is an impotant indication about thei applicability to othe datasets of this type. Repoducibility and the compaison with cluste-wide scoes We used the same fou independent beast cance gene expession datasets (GSE1456 [48], GSE3494 [46], GSE7390 [47], and GSE11121 [43]) and a study compaing tissue-specific gene expession pattens in mouse and human [85] to investigate epoducibility of the CLEAN scoes. We fist assessed the contibution of the functional data to the epoducibility of the clusteing esults by compaing the coelation between the CLEAN scoes (Figue 3.3.A) to coelation of pai-wise distances used to constuct the hieachical clusteing of genes (Figue 3.3.B) in the two datasets (GSE3494 and GSE7390). In this analysis paiwise distances ae based on the Bayesian posteio paiwise pobabilities (PPPs) poduced by the CSIMM algoithm [41]. Significantly inceased coelation fo the CLEAN soe (0.82 vs PPPs) indicated a significant incease in epoducibility of esults in tems of functional coheence of the gene expession pattens ove the simple clusteing that does not incopoate an assessment of functional coheence. The heatmap of expession pofiles fo the genes with the highest CLEAN scoes in both datasets (cicled in the Figue 3.3.A) showed a coheent patten of expession 57
, and CLEAN scoes wee computed fo both clusteings.")
59 within both datasets (Figue 3.3.C) and all these genes ae elated to immune system, which is a commonly implicated functional goup in the etiology of cance in geneal. Figue 3.3. Integating cluste analysis and functional knowledge. Genes wee clusteed using the CSIMM [41] algoithm and vaiance-scaled data fom two independent beast cance datasets (GSE3494 [46] and GSE7390 [47]), and CLEAN scoes wee computed fo both clusteings. The numbe of genes common in both datasets afte filteing was 8,567. A) The gene-specific CLEAN scoes fo the two datasets wee plotted against each othe and the Peason s coelation coefficient was computed. A small eo was added in the scatte plot to bette visualize ovelapping data points. B) Paiwise similaity measues between genes computed by CSIMM wee also plotted and coelated. C) Expession pofiles of genes with the vey highest CLEAN scoes in both datasets showed stong coexpession in both datasets. All genes in this cluste ae immunity elated. Next, we pefomed a compehensive study of the epoducibility of the CLEAN scoes in fou beast cance datasets and five clusteing algoithms descibed in the pevious section (since Peason s coelation implicitly e-scales data, only the Peason s coelation clusteing with escaled data was used in this case). The heatmap in Figue 3.4 epesents the similaities of clusteings fo diffeent algoithms and diffeent datasets in tems of the CLEAN and the cwclean scoes. Thee goupings of clusteings-by-scoe type combinations clealy emege: 58

60 clusteings fomed using Euclidean distances and un-scaled data, cwclean scoes fo clusteings based on the e-scaled data and CSIMM algoithm using un-scaled data, and CLEAN scoes based on the e-scaled data and CSIMM algoithm using un-scaled data. Figue 3.4. Repoducibility of CLEAN and cwclean scoes. The epoducibility of the functional coheence esults fo 6 diffeent clusteing algoithms was assessed by calculating all paiwise Peason s coelation coefficients between scoes fo all algoithms applied to fou independent human beast cance datasets (GEO expession seies GSE1456 [48], GSE3494 [46], GSE7390 [47], and GSE11121 [43]). Rows and columns in this symmetic heatmap epesent specific scoes fo a specific clusteing in a specific dataset in the heatmap. The symmetic hieachical clusteing of ows and columns was constucted using paiwise Peason s coelations between diffeent scoes as the similaity measues and applying the complete linkage pinciple. The impovement in epoducibility was futhe assessed by analyzing diffeences in coelations between CLEAN and cwclean scoes of all 6 pais of beast cance datasets fo thee diffeent clusteing algoithms (Figue 3.5.A). Since all diffeences ae positive, this 59
61 indicates that the coelation coefficient was highe fo CLEAN scoes in each of the 6 pais fo all thee algoithms. The inceased epoducibility was also evident in the analysis utilizing the statistical significance cut-offs established by andomizing the gene labels fo each clusteing sepaately. Fo each pai of datasets we constucted a 2-by-2 contingency table based on the statistical significance scoes (as in Table 1), and calculated diffeences in the odds atios and the statistical significance of ovelaps between lists of statistically significant genes in diffeent datasets fo a given algoithm and functional coheence scoe (CLEAN o cwclean) (Figue 3.5.B). All diffeences in odds atios wee positive implicating again highe epoducibility of CLEAN scoes. Similaly, diffeences in the statistical significances (-log 10 (p-values)) of the Fishe s Exact tests fo the same contingency tables wee also all positive implicating the highe epoducibility of CLEAN scoes (Figue 3.5.C). Figue 3.5. Diffeences in the epoducibility of CLEAN and cwclean scoes. Impovements in the epoducibility of CLEAN ove cwclean scoes wee demonstated by box plots of diffeences in coelation coefficients, and odds atios and p-values in 2-by-2 contingency tables of statistically significant scoes. A) Box plots of diffeences in coelations between CLEAN and cwclean scoes of all 6 pais of beast cance datasets fo thee diffeent clusteing algoithms. Since all diffeences ae positive, this indicates that the coelation coefficient was highe fo CLEAN scoes in each of the 6 pais. B) Box plots of diffeences in odds atios fo 2-by-2 contingency tables of statistically significant CLEAN and cwclean scoes fo all 6 pais of beast cance datasets and thee diffeent clusteing algoithms. All diffeences ae positive implicating highe epoducibility of CLEAN scoes. C) Box plots of diffeences in the statistical significances in (-log 10 (p-values)) in the Fishe s Exact test fo the same contingency tables as in B). The fact that all diffeences ae positive again implicates highe epoducibility of CLEAN scoes. We epeated a simila type of analysis fo a mouse and human datasets pofiling gene expession in diffeent tissues (79 human and 61 mouse tissue types). [85]. Afte matching 60
62 human and mouse pobes using HomoloGene identifies [56] we obtained 10,287 common genes that wee epesent on both micoaay platfoms. We constucted CSIMM-based gene clusteings fo both species and applied CLEAN sepaately fo the human and mouse datasets using both GO and KEGG based functional categoies. Statistically significant coelation between the genes with statistically significant scoes, using the Fishe s exact test fo two-bytwo tables, was fimly established fo both CLEAN and cwclean scoes (Table 3.1 and 3.2 espectively). Howeve, the statistical significance and the stength of association was consideably highe fo the CLEAN scoe (odds atio=3.82 and p-value=4.4x10-207) than fo the cwclean scoe (odds atio=1.49 and p-value= ). Table 3.1. Contingency table of genes with significant and non-significant CLEAN scoe in human and mouse tissues. This table shows esults fo the gene-specific CLEAN scoe. The odds atio is 3.82 and the Fishe Exact test p-value is 4.4x Human CLEAN scoe Significant (> 2.7) Non-significant (<2.7) Mouse CLEAN scoe Significant (> 3.2) 2,057 1,173 Non-significant (< 3.2) 2,222 4,835 Table 3.2. Contingency table of genes with significant and non-significant cwclean scoe in human and mouse tissues. When using the cluste-wide cwclean the odds atio is 1.49 and the Fishe p-value is 1.8x Human cwclean scoe Significant(> 2.7) Non-significant (< 2.7) Mouse cwclean scoe Significant (> 3.2) 4,852 1,315 Non-significant (< 3.2) 2,937 1,183 61
63 Unsupevised selection of infomative genes Repoducibly identifying genes whose expession pattens can delineate biologically meaningful goups of samples has been an impotant poblem in computational biomedicine. We focus on the situation when the identity of samples belonging to diffeent goups o even the numbe of the goups is not known in advance. In this case, the infomative genes have to be selected in an unsupevised fashion. By studying the poblem of classifying samples fom diffeent tissue types in the integated mouse-human dataset, we demonstate the utility of using the CLEAN scoe to select infomative genes. We fist identify genes with statistically significant CLEAN scoes in mouse and human tissue expession pofiling datasets. Then we show that expession pofiles of these genes facilitate bette sepaation of samples fom diffeent tissue types than expession pofiles of genes not having statistically significant CLEAN scoes. Futhemoe, we demonstate that the impovements in pecision ae significantly lage when using the CLEAN scoe than when using the cluste-wide cwclean scoes. We ceated a total of 6 diffeent gene lists and assessed thei abilities to distinguish diffeent tissue types in the combined human-mouse expession dataset. Gene lists wee as follows: All Genes: All 10,287 genes pesent in both micoaay platfoms. Significant CLEAN scoe: Genes with significant CLEAN scoes in both human and mouse datasets. Non-significant CLEAN scoe: Genes with not significant CLEAN scoes in both human and mouse datasets. 62
64 Significant cluste scoe: Genes with significant cwclean scoes in both human and mouse datasets. Non-significant cluste scoe: Genes with not significant cwclean scoes in both human and mouse datasets. COPA genes: Genes identified by applying the Cance Outlie Pofile Analysis (COPA) [59] analysis. This COPA list of 2,668 genes was geneated by pefoming COPA sepaately fo human and mouse datasets, selecting the top 5,000 genes, and using the ovelapping genes in the two datasets. This pocedue was tuned to poduce a numbe of genes that is simila to the numbe of genes with significant CLEAN scoes. Tissue samples wee then clusteed based on each of these gene lists using Euclidean distance, aveage linkage hieachical clusteing. Co-clusteed pais of samples deived fom the same tissue type (egadless of whethe they ae human o mouse deived) wee consideed tue positives, and co-clusteed pais of samples deived fom diffeent tissues wee consideed false positives. By cutting the hieachical tee stuctue at all possible levels and each time ecoding the numbe of tue and false positives we detemined the eceive opeating chaacteistic (ROC) fo each of the gene lists. Since the numbe of positive pais (232) is small compaed to the numbe of negative pais (38,828), we used the atio of numbe of false positive pais divided by the total numbe of positive pais, as ecently descibed [86], instead of the taditional false positive ates on the x-axis. Genes with significant CLEAN scoes in both human and mouse tissue expession sets wee significantly bette in sepaating diffeent tissue types than the genes with non-significant CLEAN scoes (Figue 3.6.A). Genes with significant cwclean scoes wee maginally bette in sepaating diffeent tissue types than genes with non-significant cwclean scoes (Figue 3.6.B), but the diffeence was consideably smalle than fo the 63
65 CLEAN scoe. Using COPA fo selecting infomative genes was completely ineffective as it did not show any impovement ove using all genes (Figue 3.6.C). Figue 3.6. Unsupevised selection of infomative genes. Genes wee clusteed based on thei expession acoss diffeent tissue samples and functional coheence scoes ae calculated fo the human and mouse datasets sepaately. Ability of diffeent goups of genes to facilitate coect gouping of samples fom the same tissue type in the combined human-mouse dataset was assessed by constucting ROC cuves. The ROC cuve fo clusteing samples based on all 10,287 genes is inseted in each plot (ed line) fo the efeence. A) ROC cuves fo clusteing samples based on genes with the statistically significant CLEAN scoes in both mouse and human datasets, and genes not statistically significant in eithe of the datasets. B) Same as A) fo the cwclean instead of CLEAN scoes. C) ROC cuves based on genes selected using COPA. The numbe of selected genes was identical to the numbe of genes with statistically significant CLEAN scoes used in A). Computational Infastuctue We developed an open-souce R package [54] that pefoms Clusteing Enichment Analysis (CLEAN). Typically, the use will povide a gene expession data set and a clusteing of the genes. The package is intended fo hieachical clusteings but can also accommodate non-hieachical clusteings such as k-means [12]. The package is compatible with a numbe of common input fomats. GO and KEGG functional categoies ae deived fom espective Bioconducto packages [60], and uses can povide thei own functional categoies. The CLEAN package povides functions to compute the CLEAN scoe and geneate output files to inteactively display expession data togethe with gene and sample clusteings, and functional cluste annotation. 64
![1 3 2 Figue 3.7. Integated softwae package. CLEAN was implemented as an add-on R package [54].](/docs-images/90/104353110/images/66-0.jpg "The package integates outines fo calculating gene specific functional coheence scoes and the inteactive Java-based viewe Functional TeeView (FTeeView).")
66 1 3 2 Figue 3.7. Integated softwae package. CLEAN was implemented as an add-on R package [54]. The package integates outines fo calculating gene specific functional coheence scoes and the inteactive Java-based viewe Functional TeeView (FTeeView). The figue shows a sceenshot of the fteeview session displaying CLEAN esults fo one beast cance dataset GSE3494 [46]. fteeview was developed fom the oiginal Java TeeView [55] by adding panel 3, which displays functional cluste annotations geneated by the CLEAN R package. This functionality enables seamless integation and bowsing of functional categoies associated with each cluste of genes (panel 2), which in tun can be selected based on the functional coheence scoes (panel 1). The selected cluste of genes (panel 2) which we identified based on the oveall high CLEAN scoes (panel 1) is highly eniched fo genes associate with immunity elated Gene Ontology tems (FDR<10-60 ) as well as two KEGG pathways, and putative tagets of the Intefeon Consensus Sequence-binding potein (ICSBP) tansciption facto. These Results can be viewed inteactively at using the Java web-stat vesion of FTeeView. In addition, we extended the Java-based expession data viewing softwae TeeView [55] to inteactively display functional cluste annotations and the cwclean scoes poduced by the CLEAN R package. Figue 3.7 shows a sceenshot of the new viewe we named Functional TeeView (FTeeview) displaying CLEAN esults fo the beast cance dataset GSE3494 [46]. Panel 1 displays the pe-gene functional coheence scoes fo individual categoy types. The boade the ed bas ae the highe is the scoe. Geen indicates statistically non-significant functional coheence scoes. Guided by the display of the CLEAN scoes, the use can choose a 65
67 subset of genes by selecting a banch of the hieachical gene clusteing tee (panel 2). Functional cluste annotations geneated by CLEAN fo the selected goup of genes displayed in panel 3. The inteactive display of functional annotations is the majo new featue of FTeeView, and it allows fo seamless integation and bowsing of functional categoies associated with each cluste of genes. Such an integated view of clusteing esults, expession pattens and the eniched functional categoies, facilitates a staightfowad inteactive identification of functionally coheent pattens of expession. Fo example, the selected cluste of genes (panel 3) which we identified based on the oveall high CLEAN scoes (panel 1) is highly eniched fo genes associate with immunity elated Gene Ontology tems (FDR<10-60 ) as well as two KEGG pathways, and putative tagets of the Intefeon Consensus Sequence-binding potein (ICSBP) tansciption facto. FTeeView is available as a stand-alone o as a Web Stat application fom ou seve ( Discussion Integating biological knowledge encoded in lists of functionally elated genes into the analysis of genome-wide functional genomics data is an inceasingly impotant aspect of analyzing genomics data. In the context of cluste analysis, such integation is necessay fo selecting meaningful clustes of genes, and fo the adequate biological intepetation of pattens defined by such clustes. We developed a computational famewok fo analytically and visually integating knowledge-based functional categoies with the cluste analysis of genomics data. The famewok is based on the gene-specific functional coheence scoe deived by coelating the clusteing stuctue as a whole with functional categoies of inteest. The statistical 66
68 significance of coheence scoes is established by compaing them to the empiical nulldistibution obtained by andomly pemuting gene identifies. We established the epoducibility of the CLEAN scoe acoss elated gene expession datasets, and its utility in compaing the functional coheence of diffeent clusteings and in unsupevised selection of genes that disciminate between biologically meaningful goups of samples. When compaed to the commonly used cluste-wide assessment of functional coheence, the CLEAN scoe exhibits highe epoducibility acoss diffeent micoaay datasets. Genes selected based on the CLEAN scoe poduced moe pecise sample goupings than genes selected using eithe cluste-wide scoe o by using COPA algoithm. It is impotant notice that by using the CLEAN scoe instead of the taditional clustewide appoach one cannot use the guilt-by-association pinciple [10] to hypothesize the function of non-annotated genes. Ou analysis of the fou beast cance datasets yielded one obvious example of a elevant gene (FOXM1) with a high cwclean scoe and the CLEAN scoe of zeo in all fou beast cance datasets. FOXM1 is a polifeation-associated tansciption facto [87] which has ecently been clealy implicated to be an impotant egulato in the cell cycle pogession [88]. Howeve, functional annotations fo this gene (Gene Ontologies and KEGG) do not eflect these ecent findings and consequently FOXM1 was not associated with the cell cycle cluste based on the CLEAN scoe (Figue 3.8). 67
 ecepto activity, plasma membane Figue 3.8.")
69 GSE11121 GSE1456 GSE3494 GSE7390 Nuclea pat, RNA pocessing Mitochondion Mitosis Cell cycle DNA eplication Extacellula egion, ogan development, cell adhesion Immune esponse, signal tansduce activity, ecepto activity, esponse to stess System pocess, (G-potein coupled) ecepto activity, plasma membane Figue 3.8. Expession pattens of genes with statistically significant CLEAN scoes in fou independent beast cance datasets. The heatmap indicates that all genes belong to clustes with coheent expession pattens in each dataset. Functional categoies on the ight-hand side indicate the eniched functional categoies fo each global cluste of co-expessed genes. This heatmap can be inteactively bowsed using FTeeView at One way to think about the diffeences between CLEAN and cwclean scoe in tems of diffeences between assuming functional coheence based on co-clusteing (guilt-byassociation, cwclean) vs. having some additional pe-existing evidence of functional elationship (CLEAN). Ou esults in this context implicate that in the case of beast cance and tissue datasets the pevious evidence of functional elationship is oveall moe eliable than guiltby-associations elationships aising only fom the cluste analysis on thei own. It is possible that in some othe situations, new functional elationships would dominate the existing one and the opposite would be the case. Calculating the diffeence between the two scoes can quickly implicate novel functional elationships aising fom the data analysis alone. A systematically diffeent appoach to integating the expeimental data and pio knowledge is to incopoate the functional infomation into the clusteing algoithm itself [89-68
70 93]. While conceptually appealing, such methods have a moe limited applicability than the famewok pesented hee and have not been widely used. Ou famewok follows the commonly utilized post-hoc integation appoach in which cluste analysis is pefomed fist using the expeimental data and integation is achieved in the post-hoc analysis. The ability to validate the clustes poduced by analyzing expeimental data, and the tanspaency about how exactly the diffeent types of infomation is utilized in constucting clustes is most likely the eason fo the populaity and the wide usage of post-hoc appoaches. When the functional knowledge is used in the pocess of constucting clustes, it can no longe be employed to povide the guidance in selecting biologically meaningful clustes. Conclusions We diectly demonstate that integating pio biological knowledge encoding in the lists of functionally coheent genes impoves the epoducibility of clusteing esults. We also demonstate that ou gene-specific functional coheence scoe, which diffeentiates between the levels of functional coheence fo genes within the same cluste, shows highe epoducibility than the cluste-wide scoe. The CLEAN scoe also poduced moe infomative genes fo distinguishing diffeent sample types than the cluste-wide scoe. This implicates that the genespecificity of the CLEAN scoe is a fundamentally diffeent and, at least in some cicumstances, bette appoach fo integating biological knowledge with esults of the cluste analysis than peviously used cluste-based scoes. 69
71 Methods Data Pepocessing, Gene Selection and Clusteing Raw data files (Affymetix HG-U133A CEL files) of fou independent human beast cance datasets (GEO expession seies GSE1456 [48], GSE3494 [46], GSE7390 [47], and GSE11121 [43]) wee downloaded fom the public epositoy GEO [56]. Each dataset was RMA-pepocessed [57] sepaately using the Entez Gene-based custom CDF (vesion 10) fom the Psychiaty/MBNI Micoaay Lab at the Univesity of Michigan ( Bainaay ) [58]. Pepocessed data files of a lage-scale tissue expession data set [85] wee also downloaded fom the same epositoy. The tissues included both human (GEO dataset ecod GDS596) and mouse (GDS592). Fo genes with multiple pobes pe Entez gene ID, in each case, the pobeset with the highest median expession value pe pobeset was selected as the epesentative pobeset fo that gene. To match coesponding genes acoss species, the HomoloGene database [56] was used. We applied a mild vaiation filte using Cance Outlie Pofile Analysis (COPA, 95 th pecentile) [59] to select the top 10,000 genes to be clusteed in each of the human beast cance datasets (GSE1456, GSE3494, GSE7390, GSE11121). In each dataset expession values wee centeed by setting the median value of each gene to zeo (subtacting the gene-specific medians) and clusteing analyses wee pefomed fo each dataset and species independently using hieachical clusteing with thee diffeent similaity metics o distance metics, espectively: Context-Specific Infinite Mixtue Models (CSIMM) [41]. Fo any given pai o genes, this Bayesian method estimates the posteio paiwise pobability (PPP) of the genes being co-clusteed. The esulting PPP matix is used as the similaity measue fo the hieachical clusteing algoithm. 70
72 Peason Coelation of gene expession values as the similaity measue. Euclidean Distance based on pe-gene nomalized expession values as the distance measue. All thee hieachical clusteing algoithms used Aveage Linkage. Each clusteing analysis was then epeated afte futhe vaiance based e-scaling each dataset by dividing expession levels by thei standad deviation fo each gene and each datasets sepaately. When computing the Peason coelation, expession values ae implicitly divided by the standad deviation. Thus, this additional nomalization step did not significantly affect Peason s coelations. All statistical analyses wee pefomed using the statistical pogamming envionment R vesion [54] and Bioconducto elease 2.2 [60]. Clusteing Enichment Analysis Clusteing Enichment Analysis (CLEAN) is based on testing evey possible cluste within a gene clusteing fo statistically significant enichment of biological categoies. A backgound gene list (e.g., all genes epesented on the micoaay) is given as well as a hieachical clusteing of some o all genes in the backgound list. The method was implemented as descibed in Algoithm 3.1. Algoithm 3.1. Clusteing Enichment Analysis (CLEAN). 1. Define one o moe sets of biological categoies with sufficient epesentation in the backgound gene list 2. Detemine all possible gene clustes within a given size ange 3. Fo each gene cluste 71
73 3.1 Fo each functional categoy, detemine the 2x2 contingency table and pefom Fishe s Exact test 3.2 Compute q-values, that is the adjusted Fishe p-values, to account fo multiple testing 3.3 Recod categoies the cluste is significantly eniched with and coesponding q-values 4. Compute the cluste-wide cwclean scoe 4.1 Detemine the minimum q-value fo each gene cluste 4.2 Sot gene clustes by minimum q-value stating with the lowest (i.e., most significant) q-value. 4.3 Pune cluste supesets with less significant q-value to avoid spill-ove effect, i.e., emove gene clustes whose significant functional enichment scoe is likely due to a single subtee. 4.4 Fo each gene, find the minimum q-value ove all emaining clustes the gene is membe of 4.5 Fo each gene, find the minimum q-value ove all categoy sets (e.g., GO and KEGG) 4.6 The cwclean is the esulting -log 10 -tansfomed minimum pe-gene q- value. 5. Compute the gene-specific CLEAN scoe 72
74 5.1 Fo each gene, find the minimum q-value ove all clustes and all categoies the gene is membe of. 5.2 Fo each gene, find the minimum q-value ove all categoy sets (e.g., GO and KEGG) 5.3 The CLEAN is the esulting -log 10 -tansfomed minimum pe-gene q- value. Defining Functional Categoies A functional categoy is defined as a non-empty set of genes epesenting a biological concept such as cell cycle, immunological synapse o cytokine-cytokine ecepto activation. The method is designed to accommodate any set of functional categoies such that each categoy is compised of a list of genes that has use-specified minimum ovelap with the backgound gene list. Hee, sets of categoies wee eithe downloaded fom publically accessible databases such as Gene Ontology (GO) [61], Kyoto Encyclopedia of Genes and Genomes (KEGG) [62, 83], o wee defined based on the Tansfac database [84]. Moe specifically, functional categoies based on GO and KEGG wee downloaded as R packages [54, 60] while co-egulation based categoies (CG) wee deived computationally. Tansciption facto and coesponding gene pomote data [84] and DNA sequence data [94] was downloaded. Fo each of the 304 human tansciption factos with at least one positionweight matix (PWM) in the Tansfac vesion 12.1 database, a scoe was computed fo each of the 24,190 genes, as to how likely they wee to have a coesponding binding motif within 1 kbp of thei tansciptional stat site. The espective 750 top-scoing genes (o fewe if the scoe was not significant fo at least 750 genes) wee assigned to each tansciption facto to define the espective functional categoies. 73
75 Fo compatibility, all gene identifies wee conveted to Entez gene IDs, and matched acoss species whee necessay using the HomoloGene database [56]. Subsequent analyses wee esticted to categoies that had at least ten genes in common with the espective backgound gene list (e.g., the genes epesented on the micoaay platfom). Obtaining All Possible Gene Clustes Given a hieachical gene tee, a list of all possible gene clustes is obtained by ecusively tavesing the tee stuctue and at each node ecoding the list of coesponding genes. The size of clustes is limited to a use-specified ange. Hee, clustes smalle than 10 genes and lage than 1,000 wee disegaded. Detemining significant functional enichment. To detemine whethe a functional categoy is ove-epesented in a given gene cluste, that is, moe genes of the functional categoy ae pesent in the cluste than expected by chance, a two-by-two contingency table (numbe of genes in the cluste and categoy, in the cluste and not in the categoy, etc.) is constucted and Fishe's Exact Test is pefomed. The pocedue is epeated fo each categoy within a categoy set (e.g., GO, KEGG ) and q-values (i.e., adjusted p-values) ae computed to contol the false discovey ate (FDR) [95]. Categoies with a q-value not geate than a use-defined cutoff ae consideed significant. The default q-value cutoff is 0.1. Pocedue fo Non-hieachical Methods The pocedue can be extended to non-hieachical methods such as k-means [12]. Fo a fixed numbe k of clustes, a mutually exclusive set of gene clustes is aleady given and step 2 in Algoithm 3.1 is skipped. If the use specifies a ange K of cluste numbes, step 2 in 74
76 Algoithm 3.1 is peceded by Algoithm 3.2 which geneates a hieachical gene clusteing as a means to aveage ove multiple uns of the non-hieachical clusteing algoithm. Algoithm 3.2. Aveaging gene clusteings ove n uns of a non-hieachical clusteing algoithm 1. Fo each k in K, un the non-hieachical clusteing algoithm 2. Fo each gene i 2.1 Fo each gene j i, count the numbe n ij of clusteings whee i and j ae in the same cluste 2.2 Fo each gene j i, compute p ij = n ij / n, whee n is the size of K 3. Use the p ij as a similaity metic and aveage linkage as a summay method to geneate a hieachical clusteing. R package and FTeeView tool An R package to pefom CLEAN and an open-souce Java tool to inteactively display gene expession data, gene and sample clusteing, gene annotation, and functional cluste annotation can be feely downloaded fom the authos web-site ( A list of the R functions contained in the CLEAN package togethe with a shot desciptions and examples can be found in Appendix B. 75
77 Chapte IV: Additional Applications Simulation studies In chapte II we descibe a seies of simulation studies to test the DCIM algoithm and to compae it to othe algoithms. The desciption of the study esults focuses on the ecovey of simulated contexts. Hee we expand the above epot of ou simulation studies by showing a) gene clusteing esults, and b) additional simulation scenaios. In each of the simulations we geneate samples (i.e., vectos of simulated elative expession levels) accoding to the above descibed famewok. That is, each dataset compises fou global gene clustes which ae gouped futhe within thee distinct contexts such that each context has two local gene clustes (Figue 2.1). We epeat the simulations at five diffeent noise levels, each time geneating 100 datasets. We then un the DCIM method as well as othe clusteing algoithms on each of the simulated datasets and ecod the esults. These algoithms include two hieachical clusteing methods using eithe Euclidean distance o Peason s coelation to measue distance o similaity, espectively, as well as the Infinite Mixtues based methods GIMM [15, 96] and CSIMM [41]. The latte method uses a-pioi defined contexts, and we specify the simulated contexts in ode to use this method as a gold standad fo the evaluation of the gene clusteing esults. GIMM and CSIMM do not povide sample clusteings and ae only used in the compaison of gene clusteings. As descibed in chapte II, Receive Opeating Chaacteistics (ROC) cuves ae deived fom the numbe of coectly (tue positives) and incoectly (false positives) co-clusteed pais of samples and genes, espectively. The sliding theshold to geneate the ROC is the height of the hieachical gene tee at which it is cut to induce a discete gene clusteing. The aea unde 76
 based algoithms (GIMM, CSIMM, DCIM) ae bette able to ecove gene clustes than the two ad-hoc methods as illustated by the diffeences in AUC.")
78 the cuve (AUC) is computed to compae ROCs whee the ideal AUC is equal to 1 and a tuly andom signal poduces an AUC of 0.5. Figue 4.1 shows gene clusteing esults fo the simple simulation model. The Infinite Mixtue Model (IMM) based algoithms (GIMM, CSIMM, DCIM) ae bette able to ecove gene clustes than the two ad-hoc methods as illustated by the diffeences in AUC. This diffeence becomes moe ponounced as the noise level of the data inceases. It should be noted that the simulated noise levels ange fom lowe than typically obseved to about the level of the simulated fold changes. Diffeences between IMM based methods, if any, ae small. As expected, CSIMM with known contexts gives the best gene clusteing esults (Figue 4.1.C). Figue 4.1. Recovey of gene clustes in simple simulation scenaio. A) Heatmap of a simulated data set (σ=0.3) to illustate the imposed global and local gene clustes and sample goupings (contexts). B) ROC cuve at σ=0.7 fo gene clusteing. C) Aveage gene clusteing AUC plotted against σ. Next, we slightly modify the simulation stategy by adding an additional fold change level (Figue 4.2). AUCs ae simila to the pevious scenaio; the additional fold change level appeas to actually help to slightly impove the gene clusteing. In contast, sample clusteings ae influenced by this change as the ad-hoc clusteing methods goup samples by fold change level athe than by affected goups of genes (see chapte II). 77
79 Figue 4.2. Recovey of gene clustes in two fold-changes scenaio. A) Heatmap of a simulated data set (σ=0.3) to illustate the imposed gene clustes and contexts. B) Gene clusteing ROC cuve at σ=0.8. C) Aveage gene clusteing AUC plotted against σ. One of the benefits we ae expecting of consideing contexts when clusteing genes is to account fo samples that ae uninfomative. That is, the gene expession sub-pofile fo these samples eflects the backgound noise of the measuements. Clusteing methods which do not take contexts into account weigh samples equally and would be expected to pefom pooly in the pesence of a significant numbe of non-infomative samples since it becomes inceasingly hade to distinguish gene clustes as the numbe of uninfomative samples ises. In contast, DCIM and CSIMM algoithm exploit infomation on contexts and ae expected to popely account fo such samples. To test this assetion, we extend the fist simulation scenaio by adding an inceasing numbe of non-infomative samples, that is, vectos with same noise level σ but without any signal (λ=0, Figue 4.3.A). Afte clusteing, ROCs and AUCs ae detemined as befoe but fo the analysis of sample clusteings, we use only the infomative samples. Figue 4.3 shows a epesentative example of the simulation esults with paametes σ anging fom 0.4 to 0.8 and N noninfomative, the numbe of non-infomative samples, anging fom 5 to 100. As expected, the ecovey of gene clustes emains high fo the DCIM algoithm and CSIMM but deceases fo hieachical clusteing with Euclidean distance as N noninfomative inceases. The AUC fo DCIM 78
 Heatmap of a simulated data set (σ=0.3) with 20 noninfomative samples to illustate the imposed gene clustes and contexts.")
80 clusteing of samples emains high fo up 20 non-infomative samples but deceases somewhat as N noninfomative appoaches 100. Figue 4.3. Recovey of gene and sample clustes non-infomative samples scenaio. N noninfomative, the numbe of non-infomative samples anged fom 5 to 100. A) Heatmap of a simulated data set (σ=0.3) with 20 noninfomative samples to illustate the imposed gene clustes and contexts. B) Gene clusteing ROC cuve at σ=0.7 and N noninfomative =20. C) Aveage gene clusteing AUC plotted against N at σ=0.7. D) Sample clusteing ROC cuve at σ=0.7 and N noninfomative =20. Only the infomative samples ae used to detemine tue and false positive sample pais. E) Aveage gene clusteing AUC plotted against N noninfomative at σ=0.7. Only the infomative samples ae used to compute the ROCs. A synthetic dataset The two fold-changes simulation scenaio illustates a key diffeence between sample goupings detemined by the DCIM method and standad sample clusteing algoithms. While the fome goups samples based on similaities and diffeences of the espective gene coexpession pattens, the latte use diect measues of similaity of expession levels. To futhe illustate this point, we use a dataset geneated by the Micoaay Quality Contol (MAQC) 79
81 Consotium [7]. Univesal efeence (UR) RNA and bain RNA was mixed at fou diffeent concentations (100:0, 75:25, 25:75, 0:100). These fou synthetic samples wee then hybidized to high-density oligonucleotide micoaays at six diffeent laboatoies and each time, the hybidization expeiments wee epeated five times (Figue 4.4). This expeimental design is eminiscent of the two fold-changes simulation scenaio in that the same goups of genes ae expected to be affected in all samples but at diffeent expession fold changes. That is, we do not expect to obseve diffeential co-expession of genes. Howeve, lage diffeences in expession levels ae expected between bain and UR RNA [97]. The aw data files ae publicly available (GEO accession GSE5350) and ae pepocessed and pe-filteed (N=10,000) as descibed in the pevious chaptes. The esulting data set is then clusteed using DCIM and hieachical sample clusteing methods. ROC cuves ae geneated as peviously descibed by detemining the numbes of coectly and falsely coclusteed sample pais using elevant sample annotations (RNA concentation, souce of majoity of the RNA in the sample, and the laboatoy wee the hybidization was pefomed) as gold standad (Figue 4.5). Much like fo the simulated data, cluste algoithms using taditional similaity measues goup samples by RNA souce (UR, bain) and by RNA concentation while the DCIM method does not detect these signals indicated by the expected ROC cuve along the diagonal line (Figue 4.5 A, B). The DCIM sample clusteing does, howeve, indicate slight diffeences between centes which may be due to site-specific hybidization effects. ROC cuves indicate that these diffeences ae not detected by the standad methods (Figue 4.5.C). 80
![Figue 4.4. Heatmap of the expession dataset geneated by the Micoaay Quality Contol (MAQC) Consotium [7].](/docs-images/90/104353110/images/82-2.jpg "Univesal efeence and bain RNA was mixed at fou diffeent concentations (100:0, 75:25, 25:75, 0:100).")
82 Figue 4.4. Heatmap of the expession dataset geneated by the Micoaay Quality Contol (MAQC) Consotium [7]. Univesal efeence and bain RNA was mixed at fou diffeent concentations (100:0, 75:25, 25:75, 0:100). Samples wee then hybidized to high-density oligonucleotide micoaays at six diffeent centes with five eplicates each fo a total of 120 aays. Figue 4.5. ROC cuves fo sample clusteing of the MAQC dataset [7]. Pe-pocessed and pe-filteed data was clusteed using DCIM and hieachical sample clusteing methods. ROC cuves wee geneated by detemining the numbes coectly and falsely co-clusteed sample pais using A) RNA concentation B) souce of majoity of the RNA in the sample (bain o UR), and C) laboatoy wee the hybidization was pefomed, as gold standad. Lage-scale beast cance study evisited In chapte II, we descibe the joint analysis of six beast cance data sets [22, 43, 46-49]. We find that the completely unsupevised, DCIM detemined sample goupings (contexts) ae 81
83 bette pedictos of patient suvival than standad clusteing algoithms using the same data (Figue 4.6). Figue 4.6. Kaplan-Meie cuves estimating patient suvival in joint beast cance data set. Data was analyzed using DCIM and hieachical sample clusteing with Peason coelation as well as k-means (k=2). Hieachical clusteings wee cut at top level to geneate two patient goups, espectively. Kaplan-Meie cuves and coesponding logank p-values wee computed based on available disease specific patient suvival data. We then split each of the two top-level contexts futhe into two sub-contexts and epeat the suvival analysis as indicated by colos black, ed, geen, and blue in the hieachical clusteing shown in Figue 4.7.A. We again obseve highly significant diffeences (logank p- value ) in patient suvival between the fou goups (Figue 4.7.B). The 10-yea suvival ate anges fom 56% to 86%. 82
 Kaplan-Meie cuves wee computed based on available disease specific patient suvival data. The colo of each cuve in the plot coesponds to the patient clusteing shown in panel A.")
84 Figue 4.7. DCIM clusteing and suvival analysis of the joint beast cance dataset. A) The heatmap of gene expession intensity measues was odeed by DCIM global gene and sample clusteings. B) Kaplan-Meie cuves wee computed based on available disease specific patient suvival data. The colo of each cuve in the plot coesponds to the patient clusteing shown in panel A. We then apply the CLEAN pocedue [37] descibed in chapte III to the global gene clusteing using functional categoies deived fom GO [61], KEGG [62], L2L [63], among othe computationally and liteatue deived categoies. The integated softwae package CLEAN also allows us geneate and view output files to simultaneously display gene and sample clusteing, elative gene expession levels (heatmap), and functional cluste annotations. In Figue 4.8 we show a seies of details of the heatmap each epesenting a gene cluste with high CLEAN scoes accompanied by a table showing selected functional annotations fo the cluste. The blue boxes in each heatmap coespond to the fou patient goups shown in Figue 4.7. Each of these gene clustes, that is, thei expession pattens togethe with thei functional annotation, may explain the significant diffeences in suvival we obseved between the patient goups. Fo example, a lage goup of genes annotated with polifeation elated categoies such as cell cycle is upegulated in the fist two goups ( black and ed ) with poo suvival but is down-egulated in the blue goup which has the best outcome among the fou goups. Fo anothe cluste of genes positively coelated with estogen ecepto (ER) status, expession is up-egulated in this 83


85 patient goup along with the geen goup while the same genes ae down-egulated in a numbe of patients in the ed and black goup. Positive ER status is well-known to be associated with bette patient suvival in beast cance [23]. This and the othe CLEAN deived functional cluste annotations displayed in Figue 4.8 (polifeation, cell adhesion, and metabolism) and thei expession pattens ae consistent with the obseved patient suvival fo the fou goups. Type of Evidence Desciption Fishe FDR log OR Liteatue Cance-elated gene expession module [98] Liteatue Doxoubicin-esistant cance cells [99] Liteatue Poo pognosis make in beast cance [19] Liteatue Up-egulated in undiffeentiated cance [100] GO Mitotic cell cycle KEGG Cell cycle Type of Evidence Desciption Fishe FDR log OR Liteatue Positively coelated with ER status [19] Liteatue Negatively coelated with BRCA1 gemline status [19] GO extacellula egion
![Type of Evidence Desciption Fishe FDR log OR Liteatue Cance module [98] 1.2 10-96 3.3 Liteatue Cance module [98] 6.4 10-80 2.5 GO Extacellula matix 4.3 10-36 1.2 GO Cell adhesion 3.4 10-19 1.](/docs-images/90/104353110/images/86-0.jpg "3 KEGG Focal adhesion 1.4 10-11 1.5 Type of Evidence Desciption Fishe FDR log OR GO Mitochondion 2.5 10-46 1.8 KEGG Oxidative phosphoylation 7.7 10-27 2.7 GO Extacellula egion 3.2 10-10 1.2 Figue 4.8. Clusteing Enichment Analysis (CLEAN) of the DCIM deived gene clusteing.")

86 Type of Evidence Desciption Fishe FDR log OR Liteatue Cance module [98] Liteatue Cance module [98] GO Extacellula matix GO Cell adhesion KEGG Focal adhesion Type of Evidence Desciption Fishe FDR log OR GO Mitochondion KEGG Oxidative phosphoylation GO Extacellula egion Figue 4.8. Clusteing Enichment Analysis (CLEAN) of the DCIM deived gene clusteing. Each of the panels shows a detail of the heatmap in Figue 4.7 epesenting a gene cluste with high CLEAN scoes. Below each heatmap is a table showing selected functional annotations fo the gene cluste. The blue boxes coespond to the fou patient goups shown in Figue 4.7. Nomal tissue dataset. Mainly due to availability, the majoity of ou analyses focus on beast cance samples. Howeve, hee we analyze a set of 353 nomal tissue samples deived fom ten post-motem donos. We use this example to demonstate the utility of the vaious aspects of the DCIM method and the CLEAN softwae package. The dataset, geneated by Neuocine Biosciences, 85

87 San Diego, CA, is downloaded (GEO accession GSE3526), and pe-pocessed and pe-filteed as peviously descibed. We then use DCIM to geneate gene and sample clusteings (Figue 4.9). The sample clusteing eflect the diffeent tissue types; most pominent is the clea sepaation between bain tissues and othe tissue types. Next, we compute the gene-specific diffeential coexpession scoe (DCS) fo the thee top-level contexts. Finally, we pefom CLEAN using the above named functional categoy types. We use the functionality povided in the CLEAN softwae package to geneate and display output files containing the clusteings, heatmap, DCS, and functional cluste annotation (Figue 4.9). Figue 4.9. Sceenshot of fteeview displaying DCIM deived gene clusteing and contexts fo the nomal tissue study (GEO accession GSE3526). Pe-pocessed and pe-filteed data was analyzed with DCIM. Tissue types ae eflected in the sample gouping with bain-specific tissues and non-bain tissues being the most obvious. CLEAN was then pefomed. Results ae shown using fteeview but the sidebas ight of the heatmap displays the DCS fo the top thee contexts defined by the hieachical sample clusteing. The functional annotation panel (bottom ight) displays eniched functional categoies fo the selected gene cluste. Bain specific categoies ae highlighted in yellow. 86
. By selecting these genes a list of functional categoies is displayed (3).")
, and the DCS (blue sideba plot).")
88 Figue Sceenshot of fteeview displaying DCIM and CLEAN esults fo the GSE3526 dataset. A gene cluste with high DCS was identified by visual inspection (1). This gene cluste was highly expessed in a set of coclusteed ceebellum samples (2). By selecting these genes a list of functional categoies is displayed (3). The gene cluste in this case was eniched fo a numbe of ceebellum elated mouse phenotype (MP) categoies. Figue Combining the display of CLEAN scoes and the DCS fo the GSE3526 dataset. Displayed is the gene expession heatmap, gene and sample clusteings, CLEAN scoes fo twelve categoy types including GO, KEGG, L2L, among othes (ed/geen sideba), and the DCS (blue sideba plot). The plot suggests a stiking coelation between CLEAN scoe and DCS. Genes with high DCS also have a high CLEAN scoe fo at least one of the categoy types. 87