Appendix Figures Page 2 Appendix Figure Legends Page 9 Appendix Tables Page 13 Appendix Supplementary Methods Page 15 Appendix References Page 17
|
|
|
- Noreen Golden
- 5 years ago
- Views:
Transcription
1 APPENDIX Appendix Figures Page 2 Appendix Figure Legends Page 9 Appendix Tables Page 13 Appendix Supplementary Methods Page 15 Appendix References Page 17

2
3

4


5

6

7

8
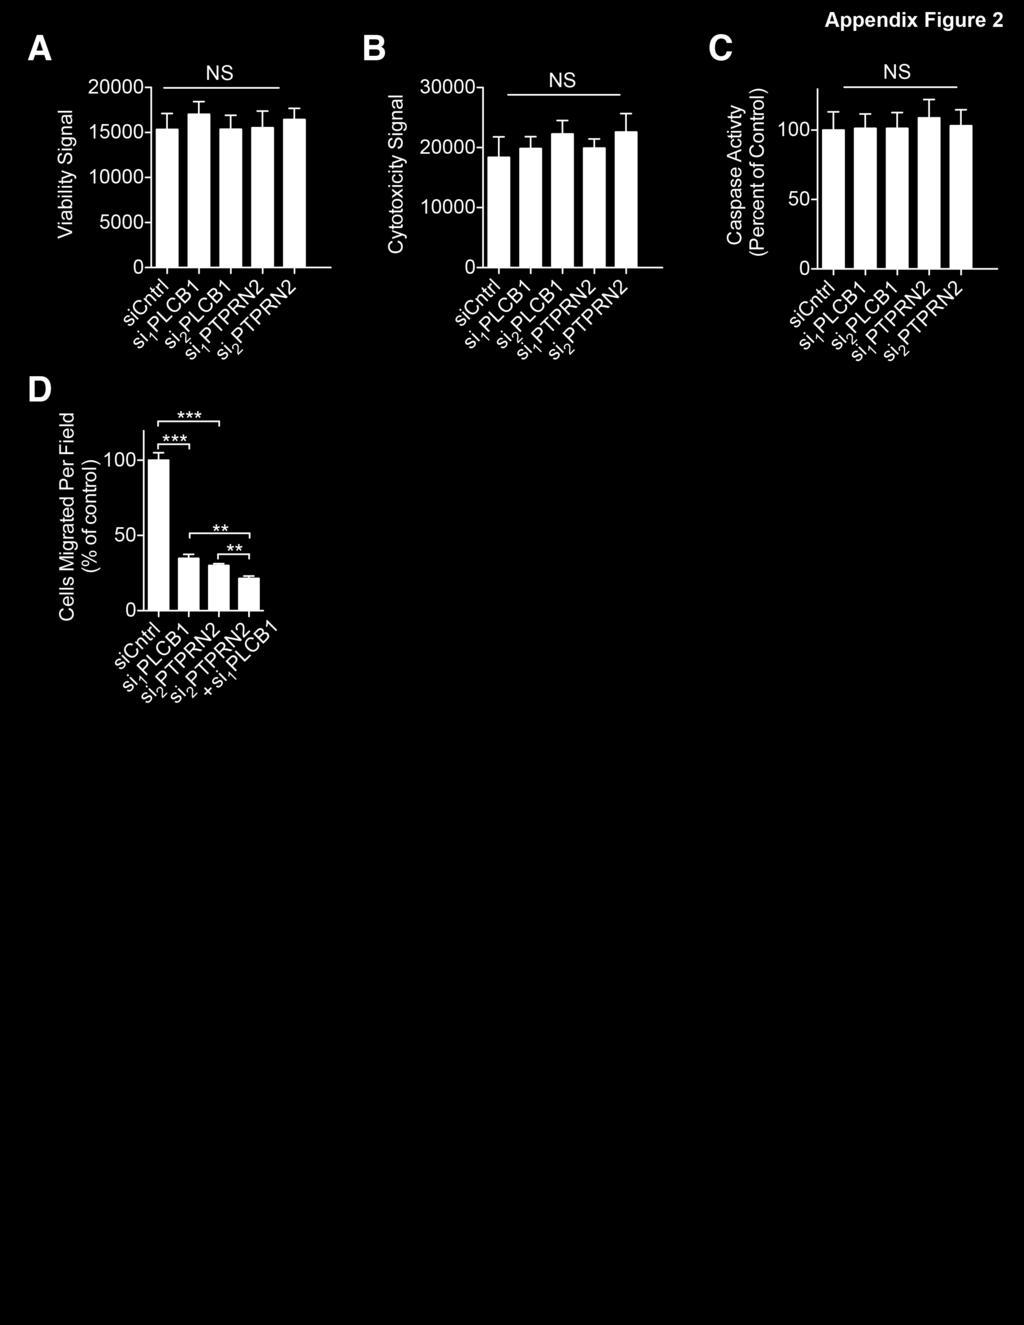
9 Appendix Figure Legends Appendix Figure 1: PLCβ1 and PTPRN2 promote breast cancer metastasis in multiple breast cancer cell lines. (A) Western blot analysis of LM2 cells transduced with shrna targeting PTPRN2 or a control hairpin using anti-ptprn2. GAPDH was used as a loading control. Densitometry analysis below blot is adjusted for GAPDH levels and normalized to shcntrl. (B) LM2 cells were transfected with sirna targeting PLCβ1 or a control sirna. PLCB1 expression levels were determined by qrt-pcr. (C) Bioluminescence imaging quantification of lung colonization by 40,000 CNLM1a breast cancer cells transduced with shrnas targeting PTPRN2 or a control hairpin. For shcntrl and sh 1 PTPRN2, N = 6 mice/group. For sh 2 PTPRN2, N = 5 mice. Right, H&E staining of representative lung sections. (D) Bioluminescence imaging quantification of lung colonization by 40,000 CNLM1a breast cancer cells transfected with sirnas targeting PLCβ1 or a control sirna. N = 5 mice/group. Right, H&E staining of representative lung sections. Error bars represent S.E.M. Appendix Figure 2: PLCβ1 and PTPRN2 are required for migration and invasion in multiple breast cancer cell lines. (A-C) LM2 cells transfected with sirna targeting PTPRN2, PLCβ1, or a control sirna were analyzed for viability (A), cytotoxicity (B), and caspase 3/7 activity (C) using the ApoTox-Glo Triplex assay (Promega). Caspase signal was normalized to sicntrl values for each group. N = 5 wells/group with 10,0000 cells per well. NS = not statistically significant. (D) 100,000 LM2 cells transfected with sirna targeting PLCβ1, PTPRN2, both PLCβ1 and PTPRN2, or a control vector were subjected to the migration assay.
10 (E,F) Migration assay by 100,000 BT-549 cells transfected with sirna targeting PTPRN2 (E), PLCβ1 (F), or control sirna. Data normalized to control values. N = 5 inserts/group. (G,H) Migration assay by 100,000 CNLM1a cells transfected with sirna targeting PTPRN2 (G), PLCβ1 (H), or control sirna. Data normalized to control values. N = 5 inserts/group. (I,J) Migration assay by 100,000 HCC-1806 cells transfected with sirna targeting PTPRN2 (I), PLCβ1 (J), or control sirna. Data normalized to control values. N = 5 inserts/group. (K,L) Migration assay by 100,000 MDA-MB-468 cells transfected with sirna targeting PTPRN2 (K), PLCβ1 (L), or control sirna. Data normalized to control values. N = 5 inserts/group. (M) 100,000 MDA-MB-231 cells overexpressing PLCβ1, PTPRN2, both PLCβ1 and PTPRN2, or a control vector were subjected to the migration assay. Error bars represent S.E.M. Appendix Figure 3: PLCβ1 and PTPRN2 abundance changes membrane PI(4,5)P2 levels in multiple breast cancer cell lines. (A) Bioluminescence imaging quantification of lung colonization 1 day after injection of 40,000 LM2 cells treated with carrier incubated with PI(4,5)P2 or carrier alone. N = 6 mice/group. (B) ELISA quantification of PI(4,5)P2 from membrane fractions of LM2 cells transfected with sirna targeting PLCβ1, PTPRN2, or a control sirna and MDA-MB-231 cells overexpressing PLCβ1, PTPRN2, or a control vector. N = 5 wells/group. (C, D) Mean fluorescence intensity of membrane PI(4,5)P2 was analyzed in MDA-MB-468 (C) and CNLM1a1 (D) cells transfected with sirna targeting PLCβ1, PTPRN2, or a control sirna and immunostained with PI(4,5)P2 antibody (red) and DAPI (blue) using fluorescence microscopy. Left, representative images. N = 30 cells/group. Scale bar, 50 µm. Error bars represent S.E.M. Appendix Figure 4: PI(4,5)P2 abundance governs migration and invasive capacity.
11 (A) MDA-MB-231 cells transfected with Lyn 11 -FRB and INPP5E-FKBP, treated with either DMSO or 10 nm rapamycin, and immunostained with anti-pi(4,5)p2 antibody (green) and DAPI (blue). Left, quantification of membrane PI(4,5)P2 mean fluorescence intensity. Right, representative images. N = 50 cells/group. Scale bar, 10 µm. (B) MDA-MB-231 cells overexpressing PTPRN2 or a control vector were treated with carrier incubated with PI(4,5)P2, carrier incubated with PI4P, or carrier alone, and subjected to the migration assay. N = 5 inserts/group. (C, D) Western blot analysis of MDA-MB-231, LM2, CN34, and CNLM1a1 cells using anti- PIP5K1A, anti-pip5k1c (C), anti-pip5k1b (D), and anti-gapdh. Densitometry values below blots are adjusted for GAPDH levels and normalized to MDA levels. (E) Western blot analysis of LM2 cells overexpressing PIP5K1A or a control vector using anti- PIP5K1A. GAPDH was used as a loading control. Densitometry values below blot are adjusted for GAPDH levels and normalized to Cntrl value. (F) Mean fluorescence intensity of membrane PI(4,5)P2 was analyzed in LM2 cells overexpressing PIP5K1A or a control vector immunostained with PI(4,5)P2 antibody (red) and DAPI (blue) and analyzed using fluorescence microscopy. N = 50 cells/group. Scale bar, 50 µm. Error bars represent S.E.M. Appendix Figure 5: PLCβ1 and PTPRN2 regulate localization of cofilin, a PI(4,5)P2- binding protein. (A-E) Kaplan-Meier curves representing distal metastasis-free survival of a cohort of breast cancer patients (N = 1609) as a function of their primary tumor s indicated gene expression levels (Data from KMPlot(Gyorffy et al., 2010)). Patients primary tumors indicated gene expression levels were classified as low (blue) or high (red) expression. GSN (A), PFN1 (B), TWF1 (C), CAPZA1 (D), CAPZB (E).
12 (F) Membrane and membrane-associated proteins (MEM) and cytoplasmic proteins (CYTO) were collected from MDA-MB-231 cells overexpressing PTPRN2 or a control vector. Protein fractions were subjected to Western blot analysis for PTPRN2, EGFR, and Tubulin. (G, H) Western blot analysis of cytoplasmic fractions from LM2 cells with knockdown of PLCβ1 (G) or PTPRN2 (H) using anti-cfl1 and anti-gapdh. (I) Densitometry analysis of western blots in (G, H). (J, K) Western blot analysis of cytoplasmic fractions from MDA-MB-231 cells overexpressing PLCβ1 (J), PTPRN2 (K), or a control vector using anti-cfl1 and anti-gapdh. (L) Densitometry analysis of western blots in (J, K). Error bars represent S.E.M. Appendix Figure 6: PTPRN2 and PLCβ1 are negatively regulated by the metastasis suppressor microrna mir-335. (A) Spearman correlation of co-expression of PTPRN2 and PLCB1 in the primary tumors of a cohort of breast cancer patients (N = 528). Data from the TCGA Research Network (Cancer Genome Atlas, 2012). (B) Western blot analysis of PTPRN2 and PLCβ1 in whole cell lysate from LM2 cells overexpressing mir-335 or a control vector. Right, densitometry quantification of Western blots normalized to GAPDH.
13 Appendix Table 1: Cloning primers PTPRN2 F: CCGGCCGAATTCGGGCCGCCGCTCCCGCTGCTG Vector: pbabe-puro R: CCGGCCCTCGAGTCACTGGGGAAGGGCCTTGAG PLCB1 F: CCGGCCTACGTAATGGCCGGGGCTCAACCCGGA Vector: pbabe-puro R: CCGGCCGTCGACTCACAGAGGAGTATCAAATTC CFL1-Lck Vector: pegfp-n1 PIP5K1A C-terminal FLAG Vector: pbabe-puro F:CCGGCCGAATTCATGGGATGCGTCTGCTCAAGCGCCTCCGGT GTGGCTGTC R:CCGGCCGGATCCCGGGATAACAAAGGCTTGCCCTCCAGG GAG F: CCGGCCTACGTAATGGCGTCGGCCTCCTCCGGG R:CCGGCCGTCGACTTACTTGTCGTCATCGTCTTTGTAGTCATGG GTGAACTCTGACTCTGC Appendix Table 2: shrna sequences Control PTPRN2 #1 PTPRN2 #2 CCGGCAACAAGATGAAGAGCACCAACTCGAGTTGGTGCTCTTCATCTTGTT GTTTTT CCGGAGGTGCTAAAGAGATTGATATCTCGAGATATCAATCTCTTTAGCACC TTTTTT CCGGCGACGATGATAGACTTTACCACTCGAGTGGTAAAGTCTATCATCGTC GTTTTT Appendix Table 3: Mutagenesis primers PTPRN2 C945A F:GCCGTTCTTGTCCAATAATTGTTCATGCCAGTGACGGTGCAG R:CTGCACCGTCACTGGCATGAACAATTATTGGACAAGAACGGC PLCB1 H331Q F: ATTTCATTAATTCCTCGCAAAACACCTACCTCACAGCTG R: CAGCTGTGAGGTAGGTGTTTTGCGAGGAATTAATGAAAT
14 Appendix Table 4: sirna sequences Control PTPRN2 #1 PTPRN2 #2 PLCB1 #1 PLCB1 #2 CFL1 #1 CFL1 #2 CFL1 #3 (3 UTR targeting) CGUUAUCGCGUAUAUACGCGAU CCUACUGAGCGGACAGAAAGAAGCC GGCAUUGAGCAAGCUAUGAGGGUCC CGCUAAGAAAUAAUUGAUGGAGCCA GGCGUUAAUCAUAAAGAAGCAAGAA GCAAGCAAACUGCUACGAGGAGGUC ACGACAUGAAGGUGCGUAAGUCUUC CUCAUGGAAGCAGGACCAGUAAGGG Appendix Table 5: Quantitative PCR primers PTPRN2 F: GGCCAAAGGTGCTAAAGAGA R: TGTCAGCGCGAACTCAAA PLCB1 F:TCTGGAATGCAGGTTGTCAG R:GCCACTCTTCCCGTTGTATT CFL1 F: TGTCAAGATGTGCCAGATAA R: GCCCAGAAGATAAACACCAGAT PIP5K1A F: CGGCCCGATGATTACTTGTAT R: CGTCGCTGGACACATAGAATAG
15 APPENDIX SUPPLEMENTARY METHODS Cellular viability, cytotoxicity, and caspase activity Cellular viability, cyototoxicty, and caspase 3/7 activity were measured using the ApoTox-Glo Triplex Assay (Promega) according to the manufacturer s instructions. 10,000 cells were seeded per well. Caspase 3/7 luminescence activity was normalized to viability signal. PI(4,5)P2 Mass ELISA PI(4,5)P2 was extracted from breast cancer cells and quantified using a PI(4,5)P2 Mass ELISA (Echelon Biosciences) according to the manufacturer s instructions. To extract PI(4,5)P2, cell or membrane pellet was incubated on ice for 5 minutes with 1 ml ice cold 0.5 M TCA. Samples were centrifuged at 1,000 g for 7 minutes at 4 C. The resulting pellet was washed with 1 ml 5% TCA/1 mm EDTA twice. To extract neutral lipids, 1 ml MeOH:CHCl 3 (2:1) was added, the samples were vortexed for 10 minutes, and centrifuged at 1,000 g for 5 minutes. Neutral lipid extraction was performed twice. To extract acidic lipids, 750 µl MeOH: CHCl 3 :12 N HCl (80:40:1) was added and samples were vortexed for 25 minutes followed by centrifugation for 1,000 g for 5 minutes. 250 µl of CHCl 3 and 450 µl of 0.1 N HCl was added to the supernatant. The sample was vortexed for 30 seconds and centrifuged at 1,000 g for 5 minutes to separate organic and aqueous phases. The organic phase was collected and dried under argon. Dried lipids were stored at -20 C and reconstituted in assay buffer immediately prior to ELISA procedure. Membrane fractionation was performed as previously described (van Rheenen et al., 2007). Briefly, cells were lysed in ice-cold lysis buffer (50 mm Tris, ph 7.5, 300 mm NaCl, 5 mm EGTA, 20 mm DTT, 1% Triton X-100). A fraction of the lysate was measured for protein content by BCA assay (Thermo) to normalize cell number. The harvested cell lysate was mixed with 60%
16 OptiPrep (Sigma) to yield 40% OptiPrep final. The lysate containing 40% OptiPrep was transferred to the bottom of a centrifuge tube. 1 ml 30% OptiPrep was added on top of 40% OptiPrep lysate. 300 µl of 5% OptiPrep was added on top of 30% OptiPrep. Tubes were centrifuged for 12h at 4 C at 100,000 g. Gradients were collected, and low-density membrane (top) fractions were used in further analysis.
17 APPENDIX REFERENCES Cancer Genome Atlas N (2012) Comprehensive molecular portraits of human breast tumours. Nature 490: Gyorffy B, Lanczky A, Eklund AC, Denkert C, Budczies J, Li Q, Szallasi Z (2010) An online survival analysis tool to rapidly assess the effect of 22,277 genes on breast cancer prognosis using microarray data of 1,809 patients. Breast Cancer Res Treat 123: van Rheenen J, Song X, van Roosmalen W, Cammer M, Chen X, Desmarais V, Yip SC, Backer JM, Eddy RJ, Condeelis JS (2007) EGF-induced PIP2 hydrolysis releases and activates cofilin locally in carcinoma cells. J Cell Biol 179: