Spectral Counting Approaches and PEAKS
|
|
|
- Neil Fowler
- 5 years ago
- Views:
Transcription
1 Spectral Counting Approaches and PEAKS INBRE Proteomics Workshop, April 5, 2017 Boris Zybailov Department of Biochemistry and Molecular Biology University of Arkansas for Medical Sciences 1. Introduction to PEAKS software 1.1 Data Pre-processing and De novo sequencing 1.2 PEAKS database search 1.3 PEAKS Spider 1.4 Peptide mapping and PTM analysis in PEAKS 1.5 InChorus, integration with other proteomics workflows 1.6 Data export options. Export to Scaffold 1.7 PEAKS Q module: TMT-labeling workflow and label free quantification 2. Spectral Counting 2.1 Applicability 2.2 Spectral counting vs. IBAC and integrated XIC methods 2.3 What statistical tests are appropriate for the Spectral Count data 2.4 Inter-sample and intra-sample variation. What can be inferred from one biological replicate? 3. Metaproteomics Analysis workflow using PEAKS, Spectral Counting, and TMT-labeling
2 PEAKS Studio is The Desktop Proteomics Software Suite, Available from Bioinformatics Solutions The key feature: de novo interpretation of MS/MS spectra LC-MS- MS/MS data refinement De novo tags > Database Search To get started

3 PEAKS: Input Multiple vendor-specific formats are supported for input (we will focus on Thermo.RAW) MGF input is supported mzxml is supported

4 Low quality MS/MS data: q>0.65 is recommended Typical Orbtirap-Ion-trap or Orbitrap- Orbitrap experiment - no filtering of scans is needed Example: 60,000 to 240,000 resolving power in Orbitrap,HCD fragmentation, MS/MS in iontrap, Da fragment tolerance Data Refinement is done automatically and is not optional in the latest version of PEAKS Studio (v 8.0) Recalculation of multiply-charged fragments improves de novo quality In the latest version, X!Calibur is not required for Thermo files PEAKS: Data Refinement

5 PEAKS: Data Input and Refinement
6 PEAKS: De Novo Algorithm using platform-specific fragmentation model find the best sequence tags masses of the tags are the same as the precursor, given tolerance Use a, b, c, x, y, z, b-h2o, b-nh3, y-h2o, y-nh3, terminal, internal cleavage, and immonium ions Original PEAKS paper: Ma et al. Rapid Commun. Mass Spectrom. 2003; 17: years later: everything works faster, New features are available, essential de novo algorithm is the same

7 PEAKS: De Novo MS/MS spectra per second, ~1 hr for 300,000 MS/MS spectra a typical gel lane, 24 slices Timestamp is located in Peaks Projects\..\runProperties.txt Ma et al. Rapid Commun. Mass Spectrom. 2003; 17: Most of the details are proprietary, Most important steps can be inferred from the original and subsequent publications PEAKS: Optimal Configuration 32 computing threads Desktop, Windows 7 PEAKS: De Novo Speed

8 PEAKS: De Novo Parameters Trypsin specificity for de novo tags implies tryptic C- termini For Trypsin and/or Endo- LysC digests setting to no enzyme will produce lower number of tags Low accuracy (fragments acquired in ion trap, 0.5 Da tolerance) does not slow the De Novo speed Parameters affecting the de novo speed
 ranges from (15-100%) Local confidence score changes from 0 to")
9 PEAKS: De Novo Results In this example, Two population of high quality and low-quality De novo tags are evident Average Local Confidence Score (ALC) ranges from (15-100%) Local confidence score changes from 0 to 100%
10 PEAKS: Average Local Confidence Score, % Local Confidence is the confidence that a particular amino acid is present in the de novo peptide at a particular position. It is presented as a percentage. Total Local Confidence (TLC) is the sum of the local confidence scores (0 to 100%) from each amino acid in the peptide sequence. Average Local Confidence (ALC) is the average of the TLC. It is TLC divided by the number of amino acids in the peptide sequence.

11 PEAKS: Average Local Confidence Score, %

12 PEAKS: Average Local Confidence Score, %

13 PEAKS: Average Local Confidence Score, %

14 PEAKS: Database Search No support for the new Change in NCBI database just yet, Only old gi numbers are supported Relevant for taxonomy; Parsing rules can be customized

15 PEAKS: Configuration/Enzyme In the current version No Cleavage Does not exactly work in PEAKS


16 PEAKS: Database Search Peaks Decoy-Fusion method Allows for correct estimation of false positives rate Through a multi-step database search


17 PEAKS: Decoy-Fusion method works well for multistep Database Search target-decoy approach Decoy-fusion approach Zhang, J., et al. PEAKS DB: De Novo Sequencing Assisted Database Search for Sensitive and Accurate Peptide Identification. Molecular & Cellular Proteomics. 10(1074). 2011
18 PEAKS: Multi-Step Search is very well supported Example for metaproteomics of the gut analysis : Search full uniprot/tremble database, restricted by host taxonomy Transfer unmatched de novo tags to a new step, search against food protein database Transfer unmatched de novo tags from the previous step and search agains all bacteria Prepare custom fasta database of identified proteins across different steps Re-search the full dataset against the custom database

19 PEAKS: Result Summary
20 PEAKS: Result Summary
21 PEAKS: Result Summary

22 PEAKS: PTM and Spider SPIDER A homology search tool that is designed to match de novo tags directly to the database. This allows to identify peptides even when working with an unsequenced organism or highly variable proteins.
23 Using Spider to Sequence a Novel Protein a very useful application of SPIDER is to use it iteratively to sequence a complete protein (e.g. antibody sequencing). This is achieved by: Using PEAKS standard workflow (de novo + PEAKS DB + PEAKS PTM + SPIDER) to search in a homologous database. This will identify a homologous protein. Then in the coverage pane, select tools copy mutated protein sequence. This will copy the mutated protein sequence (after applying the confident mutations) to Windows clipboard. Invoke another standard search by paste the copied sequence as the protein database. Repeat the above procedure multiple times to gradually improve the sequence quality.

24 Peptide Mapping
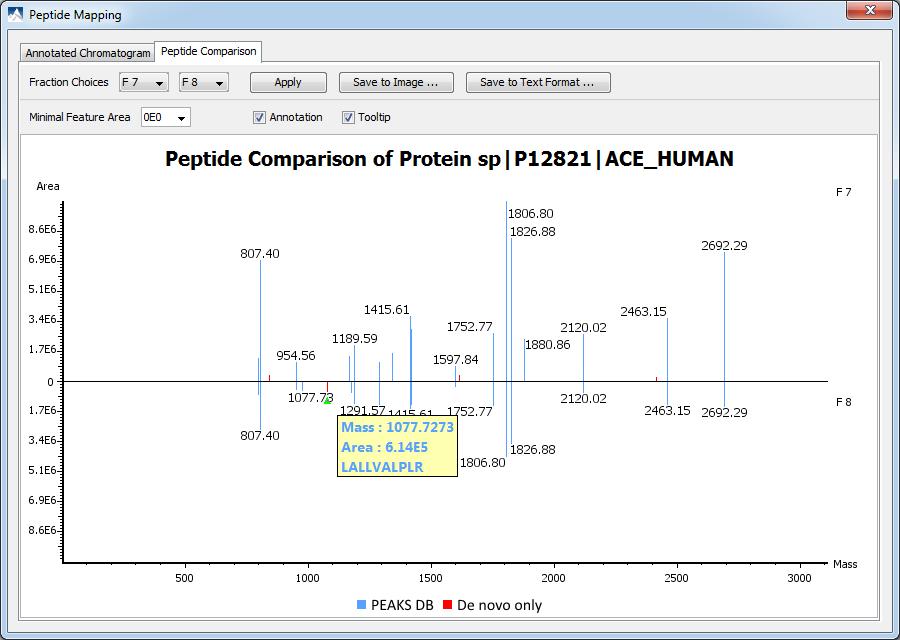
25 Peptide Comparison

26 PTM profiling


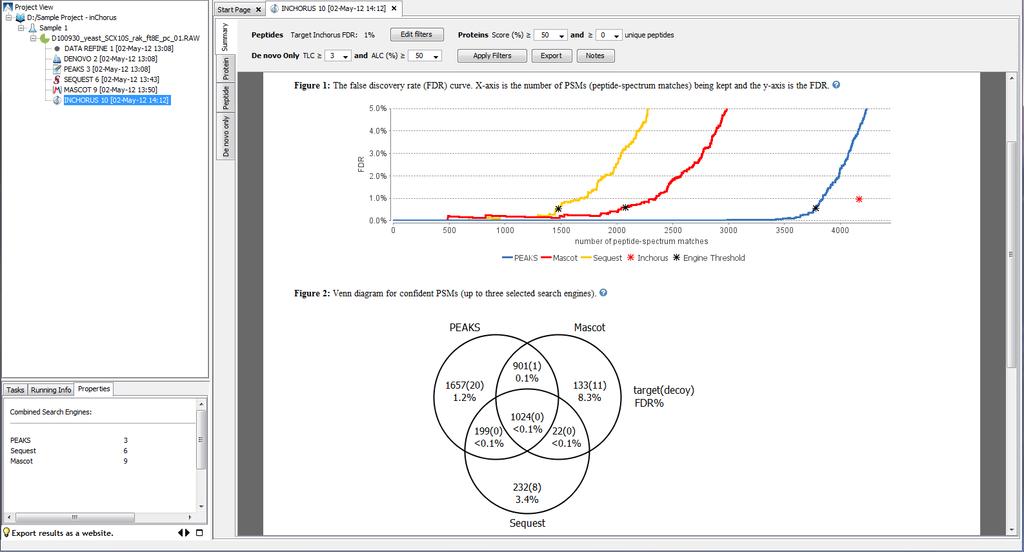
27 PEAKS: InChorus support for Multiple Search Engines

28 PEAKS: InChorus support for Multiple Search Engines
29
30 PEAKS Q No Support for Spectral Counts, But it is possible to export results into Scaffold Advanced support for stable-isotope labeleing, including TMT10-plex MultiNotch Moderate support for XIC integration and comparison
31 Metaproteomics Pipeline Sample preparation Fecal microbiome sample Collect an aliquote (~1 g). Split in 4 equal parts at the time of collection and freeze at -80 C Metaproteomics Analysis Protein extracts 1) SDS-Page in gel digestion 2) On-filter digestion 1 direct extraction Metaproteomics 2 bacterial enrichment 3 DNA extraction Metagenomics 4 archive LC-MS Orbitrap-Tribrid-Fusion 1)Identification method 2) Quantification (TMT tags) Metagenomics Illumina HiSeq 2000/2500 a) Assembly using reference genomes b) De novo assembly Sequence databases Sample-derived DNA sequence database NCBI_nr, taxonomy filters host+mircobiome protein database Peaks DB.RAW files PEAKS Studio Data Refinement De novo sequencing InChorus (Multi-step database searches).mgf files Mascot.DAT file Urestrictive Homology Search a) Relaxed precursor tolerance b) MS-Blast c) Add De novo DNA sequences translated in 6 frames De Novo Only peptides Data cross-validation peptides matched to proteins UniPept Results: 1)List of organisms (species-level resolution) and their relative abundance 2) List of proteins and their abundance ranks 3) Matched peptides and de novo only peptides relative concentrations
32 Multi Step Database Search Strategy Microbiome Sample Label Free Method Gel-LC20 Fusion.RAW PEAKS 8.0 DeNovo 5 ppm 0.5 Da DeNovo peptides ALC (%) 80 DeNovo Peptides, 80 Filtered list UniPept web advanced miss-cleavage Equate L and I Do not filter duplicates Taxonomy/diversity Exact matches in UniProt PEAKS DB NCBI_nr (host taxonomy) Strict filtering Unmatched DeNovo tags PEAKS DB NCBI_nr (bacteria) Relaxed filtering Prepare Custom Fasta Database From all protein matched


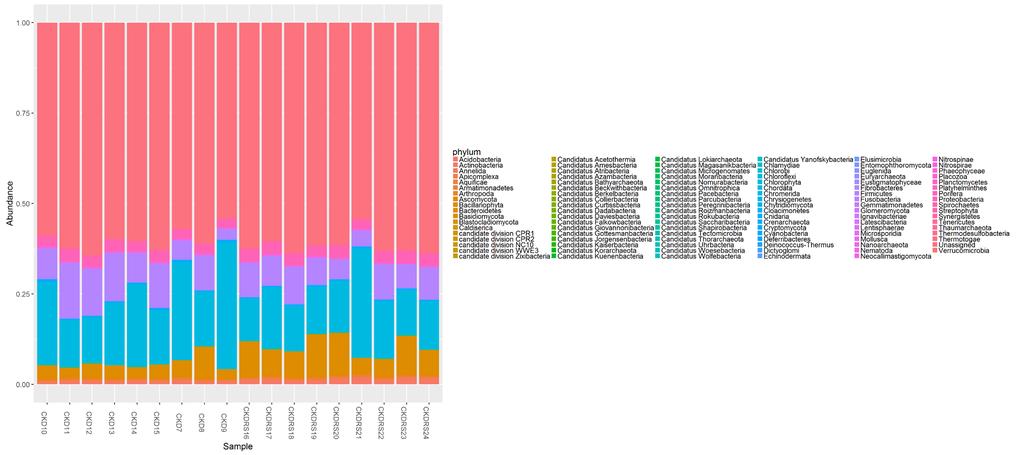
33 CKD7 CKD8 CKD9 CKD10 CKD11 CKDRS16 CKDRS17 CKDRS18 CKDRS19 CKDRS20 CKD12 CKD13 CKD14 CKD15 CKDRS21 CKDRS22 CKDRS23 CKDRS24
34

35

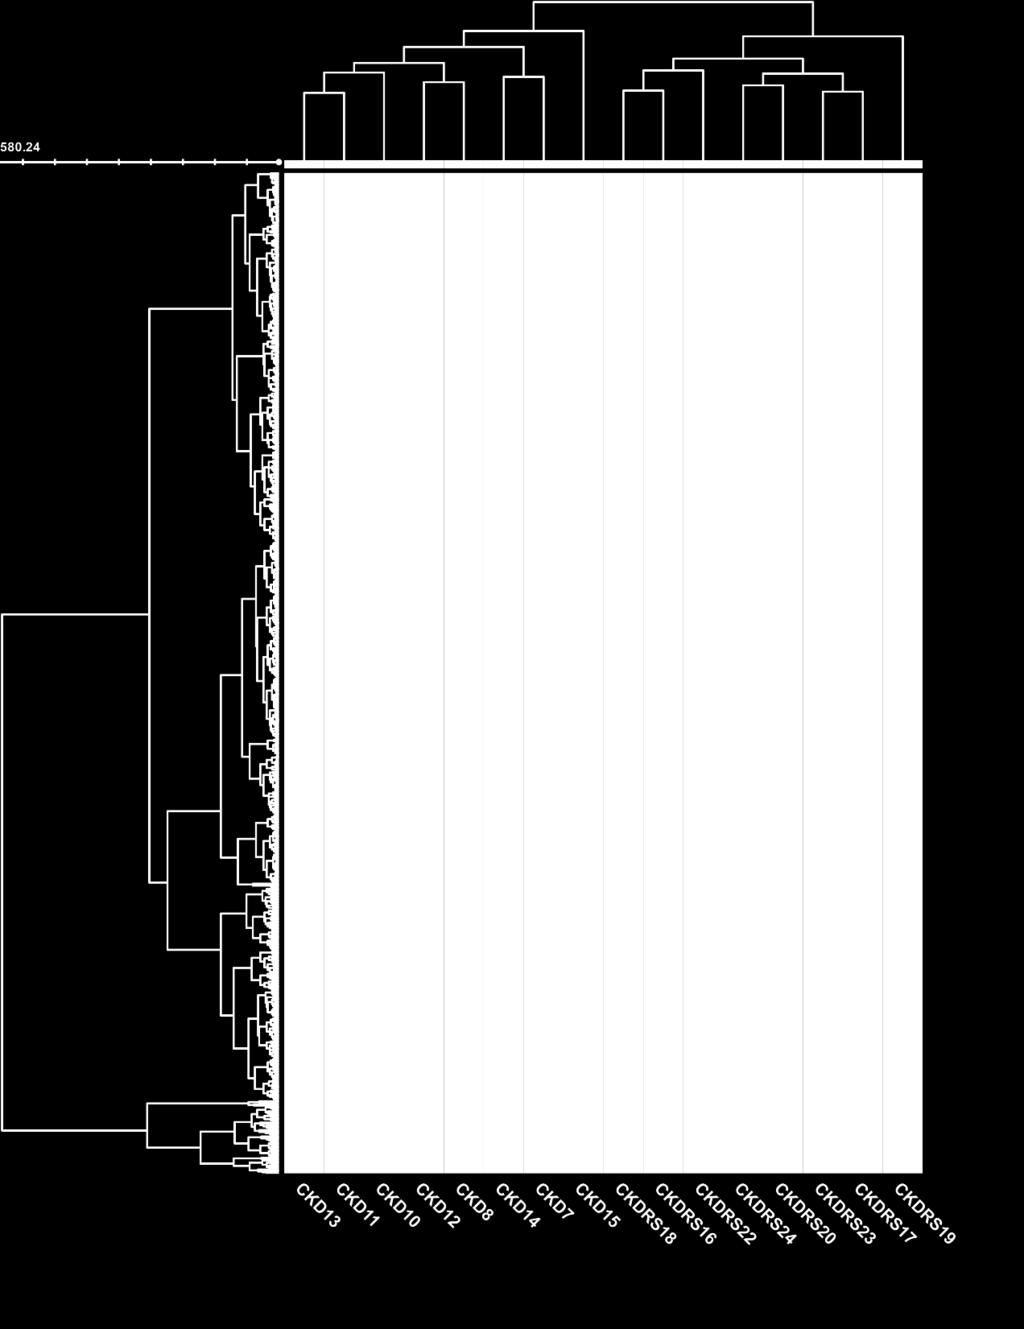
36 The 410 quantified proteins separate the two phenotypes (CKD vs CKDRS) very well Outlier test: CKD9 and CKDRS21 currently considering to re-run just these two rats T-test, 2 tails, unpaired, Equal variance p.adjust (Benjamini- Hochberg) Distance function: Eucledian or correlation eucledian is shown on this plot Clustering complete linkage Bioconductor package: Heatplus 107 proteins With adjusted.p<0.05
 Clustering: centroid Distance: correlation Mostly rat proteints Mostly bacterial")
37 107 most significant proteins (p.adjusted<0.05) Clustering: centroid Distance: correlation Mostly rat proteints Mostly bacterial proteins Next slide Shows the protein list
38 Conclusions PEAKS outperforms most of the existing search algorithms in terms of speed, sensitivity and accuracy However, protein grouping and spectral counting support is inferior to Scaffold PEAKS can be used for preparing MGF files and De Novo tags for downstream analyses