bronchial epithelial cells (I). Bronchi are outlined with dashed line. Scale bars = 25 µm, if not
|
|
|
- Gavin Carr
- 5 years ago
- Views:
Transcription
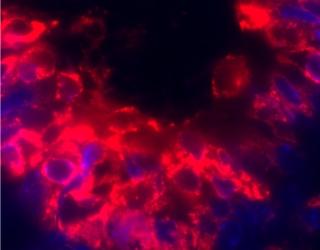
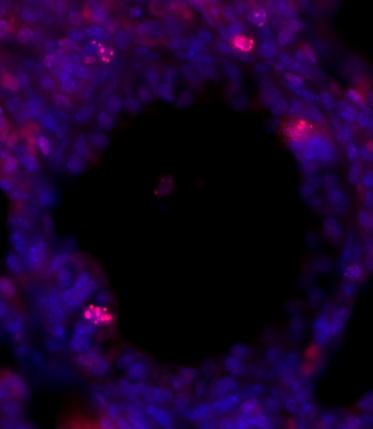
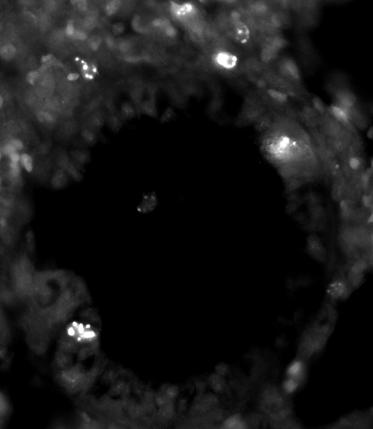
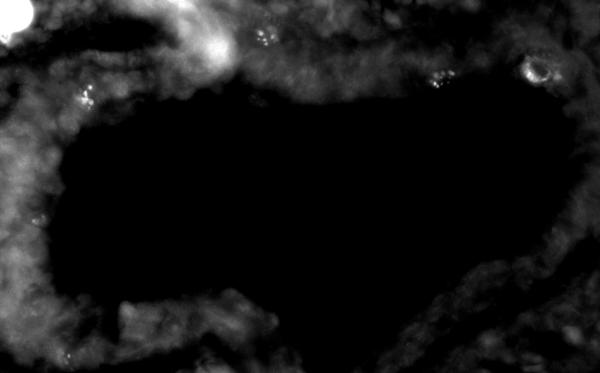
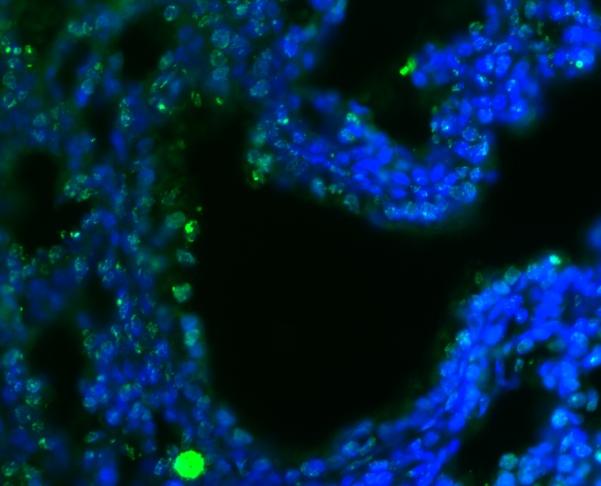
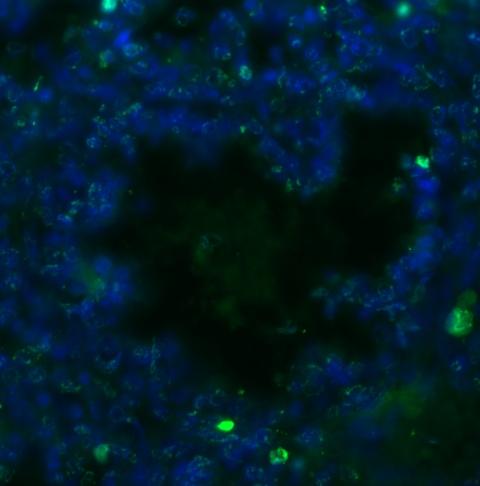
1 Supplemental Figure S1: ronchial epithelial cell polarity and integrity is maintained in bronchi. (A-E) Staining for selected markers of bronchial cell differentiation and intracellular compartments is shown in () and WT mice. Comparable smooth muscle actin (SMA, from n = 5 per genotype) (A) and pan-cytokeratin (pck, from n = 2 per genotype) () are indicative of an intact smooth muscle cell layer and epithelial cell identity, respectively, in the bronchi of lungs. The occluding vesicles are not positive for lysosomes (Lamp2, from n = 2 per genotype) (C), or the Golgi apparatus marker GM130 (E, green, n = 3 per genotype), but stained for the ER marker KDEL (from n = 3 per genotype) (D). Staining for ciliated cells using β-tubulin (red) shows no differences between WT and Adamtsl2- /- lungs. (F-I) Markers for spatial relationships of bronchial epithelium show that despite profound epithelial dysplasia in bronchi, the overall bronchial epithelial identity and orientation were maintained (from n = 2 per genotype), although bronchial epithelium shows reduced staining in H and I. Collagen IV staining indicates an intact basement membrane (F, arrows point to the epithelial/smc junction), cortical actin, stained with phalloidin-fitc, is distributed apically and laterally in WT and bronchial epithelium (G), PKCζ mainly stains the lumenal side of the bronchial epithelium (H). The zona occludens marker ZO-2, even though weaker in the lungs, indicates tight junctions between bronchial epithelial cells (I). ronchi are outlined with dashed line. Scale bars = 25 µm, if not indicated otherwise. WT, wild-type,, ;, bronchi; V, blood vessel. Supplemental Figure S2: No alteration in cell proliferation or apoptosis in the bronchial epithelium of lungs. Cell proliferation (top panels) was analyzed by staining with an antibody against phospho-histone H3, which marks proliferating cells (from n = 2 per 1
2 genotype). Positive (proliferating) cells are indicated with arrows. Apoptosis (bottom panels) was assessed with TUNEL staining (from n = 2 per genotype). TUNEL positive cells are indicated with arrows. Scale bars = 25 µm., bronchi. Supplemental Figure S3: Immunolocalization of FN1 in paraffin-embedded lung sections. FN1 predominantly localizes to the blood vessel walls and only a minor amount is found in the bronchial epithelium at E14.5 (from n = 3 per genotype), E17.5 (from n = 3 per genotype), and P0 (from n > 6 per genotype). Nuclei are counterstained with DAPI (blue). Quantification of mean integrated density of fluorescence signal for FN1 showed no statistically significant difference between the WT and lungs. Scale bars = 25 µm., bronchi; asterisk, blood vessel. Supplemental Figure S4: Non-canonical TGFβ-signaling pathways are not altered in lungs. (A) Western blots are shown for perk1/2 or pp38 and total Erk1 or p38, respectively, using total protein extracted from or WT lungs at E17.5 (left, n = 1 for WT, n = 4 for ; n = 4 for Adamtsl2+/-) and P0 (right, n = 3 for WT and ; n = 2 for Adamtsl2+/-). Equal amounts of protein were loaded and the mean intensity of the perk1/2 or pp38 bands was quantified using ImageJ and normalized to the amount of total Erk1or total p38, respectively. () Absence of nuclear psmad2 staining in NA treated lungs compared to IgG treated lungs is indicative of the efficiency of the NA for blocking TGFβ signaling (from n = 2 per genotype). Scale bars = 25 µm. 2
3 Supplemental Table S1. Frequencies of genotypes arising from Adamtsl2+/- intercrosses 1 Genotype Stage Adamtsl2+/+ Adamtsl2+/- E14.5 E (35.1) 34 (36.2) 27 (28.7) Postnatal day (33.3) 35 (38.9) 25 (27.8) 2 Postnatal day 7 60 (37.5) 95 (59.4) 4 5 (3.1) 3 Shown are the number of mice (percentage) at the indicated ages 1 Numbers are combined from intercrosses arising from Adamtsl2+/- mice before and after Neo deletion. 2 8/21 (38.1%) were found gasping and/or cyanotic, others were found dead. 3 These mice were small, with tight skin and joint contractures, and died before 14 days of age. 4 These mice were viable, fertile and most were indistinguishable from WT littermates. A few Adamtsl2+/- mice were small, with variably tight skin and excess collagen deposition around bronchi. 3
4 Supplemental Table S2. Primers used for genotyping and qrt-pcr Primer Sequence (5-3 ) Application Adamtsl2 WT F GTACCAGCTCTGCAGAGTGC Genotyping Adamtsl2 WT R AAGCTCCTCCCATCCGGTGG Genotyping Adamtsl2 KO F AGCTGCGTGTTGTCTCCCC Genotyping Adamtsl2 KO R CACTGAGTCTCTGGCATCTC Genotyping Adamtsl2 Exon2/3 F GCTGTAGCAGTTGTGGCT qrt-pcr Adamtsl2 Exon2/3 R CCTCTAGGCTGTTGGATGTG qrt-pcr Adamtsl2 Exon 8/9 F CCAGATTGTGGAGAGGAAGAAG qrt-pcr Adamtsl2 Exon 8/9 R GTCCACTTTGTAGTTGCCATTG qrt-pcr Fbn1 F GCCAGAAAGGGTACATCGG qrt-pcr Fbn1 R ACACACCTCCCTCCGTT qrt-pcr Fbn2 F GTGAAACCACACAGAAATGTGAA qrt-pcr Fbn2 R GAACAGTCGCCAGTCTCAC qrt-pcr Fn F GTCTAGGCGAAGGCAATGG qrt-pcr Fn R CCTATAGGATGTCCGGGTGT qrt-pcr Magp1 F CATCCACAAGCCTTGCAAAC qrt-pcr Magp1 R CAGACAGTGCGGACACATATT qrt-pcr Ltbp1 F GGTTATTTGCCATCTTCCGTGTA qrt-pcr Ltbp1 R GAAATTTGGAGGGCACTGACA qrt-pcr mhprt1 F GATCCATTCCTATGACTGTAGAT qrt-pcr mhprt1 R AGATCATCTCCACCAATAACTT qrt-pcr mgapd F GTGCTGAGTATGTCGTGGAG qrt-pcr mgapd R GCGGAGATGATGACCCTTT qrt-pcr 4
5 Supplemental Table S3. Antibodies used for immunostaining and western blotting Antibody Host Supplier Product number Dilution Application (Embedding) Antigen retrieval α-smooth muscle actin Ms Sigma A2547 1:300 IF (P) - (SMA) pan-cytokeratin Rab Dako Z0622 1:200 IF (P) H/E KDEL Ms ENZO ADI-SPA- 1:200 IF (P) H/E 827 Magp1 Rab - - 1:200 IF (P) H/E fibronectin Rab Millipore A2033 1:200 IF (P) H/E fibrillin-1 Rab - - 1:250 IF (P, F) H/E fibrillin-2 Rab - - 1:300 IF (P, F) H/E Lamp2 R Abcam AL-93 1:200 IF (F) - Ltbp1-K Rab - - 1:250 IF (F) GM130 Rab Abcam ab :250 IF (P) H/E β-tubulin-iv Ms iogenex MU178-US 1:500 IF (P) - and H/E Col IV Rab Rockland :500 IF (P) proteinase K Phalloidin-FITC - Life F432 1:500 IF (F) - Technologies PKCζ Ms Santa Cruz sc :200 IF (P) - ZO-2 Rab Santa Cruz sc :200 IF (P) - psmad2 Rab Cell :600 IHC (P) H/E phospho-histone H3 Rab Millipore :250 IF H/E psmad2 Rab Cell :1000 W - Smad2/3 Rab Cell :1000 W - psmad1/5/8 Rab Millipore A3848 1:500 W - Smad1 Ms Millipore :1000 W - perk1/2 Rab Cell :1000 W - Erk1 Rab Santa Cruz sc-94 1:1000 W - pp38 Rab Cell :500 W - p38 Rab Cell :1000 W - ADAMTSL2 (C3) Rab GeneTex GTX :500 W - Ms: mouse; Rab: rabbit; R: rat; IF: immunofluorescence, paraffin (P) or frozen (F) sections; IHC, immunohistochemistry; ICC: immunocytochemistry; W: western blotting; H/E: 4 x 1.5 min at 50% power with 30 sec intermission in 10 mm citric acid, 2 mm EDTA, 0.05% Tween-20, ph 6.2, in a microwave oven; Proteinase K: 2 min incubation with 20 mg/ml proteinase K solution at room temperature 5


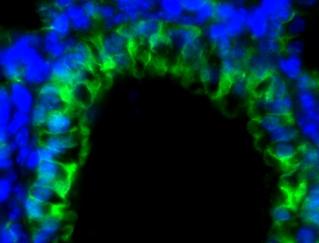


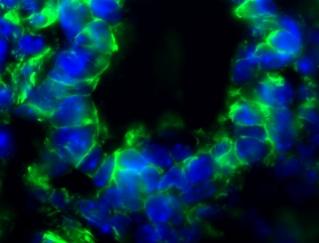
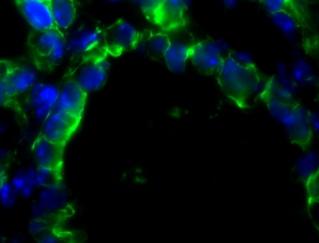


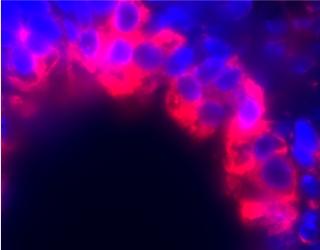
6 A V V SMA V pck WT C Lamp2 V D KDEL E GM130 Tubulin F Col IV G Phalloidin-FITC H I PKC ZO-2 25 m Supplemental Figure S1


7 WT cell proliferation ph3 merge apoptosis TUNEL merge 25 m Supplemental Figure S2
 E16.")

 E17.")


8 WT n.s. (p = 0.055) E16.5 * mean integrated density WT n.s. (p = 0.069) E17.5 * * mean integrated density WT P0 * * mean integrated density n.s. (p = 0.128) 0 WT Supplemental Figure S3


9 A E17.5 P0 WT +/- WT +/- Erk1/2 perk1/2 Erk1 perk1/2 Erk1 p38 pp38 pp38 p38 p38 PO E PO E17.5 perk1/2 / Erk1/2 1.0 pp38 / p WT +/- 0.0 WT +/- WT NA IgG NA IgG psmad2 Supplemental Figure S4