Simulation-based statistical inference in computational biology
|
|
|
- Charlene Fleming
- 5 years ago
- Views:
Transcription


1 Simulation-based statistical inference in computational biology Case study: modeling the genome evolution of Streptococcus pneumoniae Pekka Marttinen, Nicholas J. Croucher, Michael U. Gutmann, Jukka Corander, William P. Hanage* October 3, 2016
2 Simulation-based inference Statistical inference, the common way Assume some likelihood: p(data parameters) Learn parameters that best fit the data Example: bivariate normal distribution Sometimes likelihood can not be defined or computed, but simulating data from the model is possible Example: population genetics Applications: genetics, economics, material physics,...
3 Case study: population genomics Background: the number and size of bacterial genome collections is increasing rapidly. Issue: understanding how genomes evolve to produce the patterns observed in the data sets is incomplete. Our goal: to increase understanding on the evolutionary processes that shape the bacterial genomes. Results: We present a simulation model that helps to understand some high-level summaries in a collection of 616 Streptococcus pneumoniae whole genomes.
4 Overview Summary Biological concepts Background Data Model & Model fitting Results and conclusions
5 Concepts (1/2) Core genome: collection of genes shared by all genomes of a bacterial species Accessory genome: collection of genes present in some but not all genomes of a species For example only 11% of all Escherichia coli genes are core. Gene 1 Gene 2 Gene 3... Gene K Strain Strain Gene presenceabsence matrix Strain Strain N


6 Concepts (2/2) Recombination shuffles bits of DNA between different chromosomes. Horizontal gene transfer permits the exchange of DNA between different species
7 Background Fraser et al. (2007) presented a model for the core genome showing how recombination holds a population together Low recombination rate High recombination rate
8 Overview Summary Biological concepts Background Data Model & Model fitting Results and conclusions
 Croucher et al.")
9 Data (1/2) 616 Streptococcus pneumoniae strains sampled in Massachusetts Gene presence-absence matrix Sequence alignments at core genes (COGs) Croucher et al. (2013)


10 Streptococcus pneumoniae Lives in human upper respiratory system Multidrug resistant strains exist Infections Pneumoniae Meningitis Etc

11 Data (2/2) Sequence alignments for core genes Core gene 1 Core gene 2... Core gene G Strain 1 A C G G A - T C C Strain 2 A C C G A C T C C... Strain N Phylogenetic tree can be estimated using the core genome 15 distinct strain clusters can be identified
12 Data summaries (1/2) Core
13 Observed population structure 14 equidistant strain clusters (SCs) One divergent strain cluster, SC12 within-cluster distances between-cluster distances (excl. SC12) distances between SC12 and other clusters
14 Data summaries (2/2) The blob (86 percent of points)
15 Overview Summary Biological concepts Background Data Model & Model fitting Results and conclusions
 gene introduction gene deletion gene transfer Compare Efficient likelihood-free inference, see, e.g., Gutmann and Corander (2015). Observed summaries")
16 Modeling approach Population at time t Population at time t+1 Population at time T Compute summaries Simulated summaries... mutation recombination (homol.) gene introduction gene deletion gene transfer Compare Efficient likelihood-free inference, see, e.g., Gutmann and Corander (2015). Observed summaries
17 Inference Parameters affecting gene content (deletion rate, novel gene introduction rate, gene transfer rate) fitted by matching Gene frequency histogram Median clonality score (explained later) between real data and data simulated from the model. Parameters affecting core genome (mutation rate, homologous recombination rate) by matching Slope of the Jaccard vs. Hamming plot Median linkage score (explained later)

18 Model fitting illustrated Maximize the similarity between simulated and real data summaries. Here the similarity is defined as log s simu s real 2 log l simu l real 2
19 Aspects of model fitting How to select the next point to evaluate? ->Bayesian optimization. How to get most of the existing model evaluations? ->GP-ABC. Example below. Active research topics
20 Overview Summary Biological concepts Background Data Model & Model fitting Results and conclusions
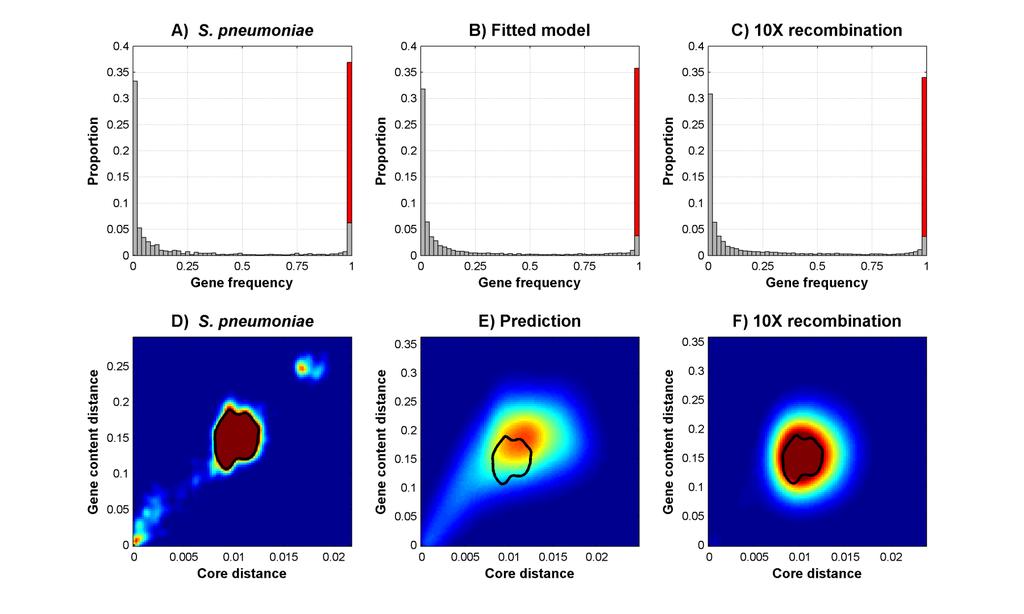
21 Results

22 Deviations from the model the second mode represents a divergent strain cluster that has been recognized as a distinct species. excess of closely related strains can be explained, e.g., by a recent bottleneck or biased sampling.
23 Another aspect that does not fit Consider genes present in exactly two strains. Histograms show distributions of distances between the two strains in real and simulated data sets. S. pneumoniae Simulated data The deviation is caused by frameshift mutations, not included in the model.
24 Conclusions Simulation-based modeling was found useful in helping to understand the genomic structure of a bacterial population The model was fitted using likelihood free inference We saw the observed gene content arising without explicit selection, suggesting that caution should be employed not to over-interpret features of the genomic distribution. The model predicts the existence of equidistant strain clusters, and this follows from an equilibrium between Diverifying forces: mutation, gene deletion, introduction of genes Cohesive force: recombination, gene transfer
25 References Marttinen, P. et al. (2015). Recombination produces coherent bacterial species clusters in both core and accessory genomes. Microbial Genomics, 1, doi: /mgen Croucher, N.J. et al. (2013). Population genomics of post-vaccine changes in pneumococcal epidemiology. Nature Genetics 45, Croucher, N.J. et al. (2014). Diversification of bacterial genome content through distinct mechanisms over different timescales. Nature Communications, Article number, Fraser, C. et al. (2007). Recombination and the nature of bacterial speciation. Science 315, Gutmann, M.U. and Corander, J. (2015). Bayesian optimization for likelihood-free inference in simulator-based statistical models. arxiv:
26 Linkage scores Used for fitting homologous recombination rate Measures the similarity of distances at different genes
27 Clonality scores Used for fitting gene transfer rate Measures the excess of closely related strains in groups sharing a COG