Utility of the dual-specificity protein kinase TTK as a therapeutic target
|
|
|
- Tyrone Lyons
- 5 years ago
- Views:
Transcription
1 Utility of the dual-specificity protein kinase TTK as a therapeutic target for intrahepatic spread of liver cancer Ruoyu Miao, 1,2* Yan Wu, 2* Haohai Zhang, 1 Huandi Zhou, 3 Xiaofeng Sun, 2 Eva Csizmadia, 2 Lian He, 1 Yi Zhao, 4 Chengyu Jiang, 3 Rebecca A. Miksad, 5 Tahereh Ghaziani, 2 Simon C. Robson 2 and Haitao Zhao 1. 1 Department of Liver Surgery, Peking Union Medical College Hospital, Chinese Academy of Medical Sciences and Peking Union Medical College, Beijing , China. 2 Liver Center and The Transplant Institute, Department of Medicine, Beth Israel Deaconess Medical Center, Harvard Medical School, Boston, MA 02115, USA. 3 State Key Laboratory of Medical Molecular Biology, Institute of Basic Medical Sciences, Chinese Academy of Medical Sciences and Peking Union Medical College, Beijing , China 4 Key Lab of Intelligent Information Processing of Chinese Academy of Sciences, Institute of Computing Technology, Beijing , China 5 Division of Hematology/Oncology, Department of Medicine, Beth Israel Deaconess Medical Center, Harvard Medical School, Boston, MA 02115, USA. * These authors contributed equally to the work. Corresponding authors. ZhaoHT@pumch.cn (H.Z.); srobson@bidmc.harvard.edu (S.C.R.) 1
2 SUPPLEMENTARY TABLES Table S1. Clinical characteristics of HBV- patients. Clinical Variable Western Blot (n = 34) IHC (n = 18) No. % No. % Age 55 years % % >55 years % % Gender Female % 1 5.6% Male % % HBV HBsAg % % HBsAg+HBeAg % % HBsAg+HBeAg % % HBsAg Negative % % Positive % % ALT 40 U/L % % >40 U/L % % Bilirubin 17 µmol/l % % >17 µmol/l % % Albumin <35 g/l % % 35 g/l % % AFP 20 ng/ml % % >20 ng/ml % % Cirrhosis No % 1 5.6% Yes % % Edmondson grade I % % II % % III/IV % % Tumor number Solitary % % Multiple % % Tumor size 5 cm % % >5 cm % % Tumor encapsulation Complete % % Absent/incomplete % % Satellite No % % Yes % % Vascular invasion No % % Yes % % HBV, hepatitis B virus; HBsAg, hepatitis B surface antigen; HBeAg, hepatitis B e antigen; ALT, alanine aminotransferase; AFP, alpha-fetoprotein. 2
3 SUPPLEMENTARY FIGURE LEGENDS fig. S1. Evaluation of TTK protein levels in human tissues. Comprehensive Western blot images of TTK in 34 pairs of matched snap-frozen cancer and nonmalignant tissue specimens of patients (n = 34). fig. S2. Pathological images of biopsies from study subjects with. The different histological grades indicative of tumor differentiation are shown on the right axis. Scale bar, 20 µm. n = 18. fig. S3. Expression of TTK gene transcripts in human tissues. RNA ISH assessment of TTK gene expression. Two representative images are shown for each sample. Scale bar, 20 µm. fig. S4. TTK expression at both mrna and protein levels in various human cell lines. (A) mrna expression of TTK. (B) Western blotting and densitometric analysis of TTK protein expression. Error bars, mean ± s.e.m. AU, arbitrary units. fig. S5. Validation of TTK knockdown in HepG2 and Huh7 cells by qpcr. n = 3; error bars, mean ± s.e.m, Student s t-test. **P < 0.01; ***P < fig. S6. Decreased growth of cells caused by TTK deficiency. Representative bright field images of live cells by Celigo Cell Counting application. n = 8. 3
4 fig. S7. Migration and invasion assays of HepG2 TTK KD cells. (A-B) Quantifications of migratory (A) and invasive capacity (B) of TTK KD cells. Data are presented as relative to Ctrl cells. n = 3-8; error bars, mean ± s.e.m, One-way ANOVA. **P < 0.01; ***P < fig. S8. Increased senescence in TTK KD cells. (A-B) Quantifications of cellular senescence by Celigo in situ cellular analysis (A) and SA-β-Gal activity measurement (B). Data are presented as relative to Ctrl cells (A) or absolute number of SA-β-Gal + cells per counting field (B). n = 3; error bars, mean ± s.e.m, One-way ANOVA. *P < 0.05; **P < 0.01; ***P < fig. S9. Apoptosis and cell cycle analyses of HepG2 TTK KD cells. (A-B) Population of early apoptotic (Annexin V + ) (A) and total apoptotic (Annexin V + PI + ) (B) TTK KD cells by Celigo Apoptosis application. Data are presented as relative to Ctrl cells. (C) Proliferation and cell cycle analysis of TTK KD and Ctrl cells by Celigo Cell Cycle application. n = 3; error bars, mean ± s.e.m, One-way ANOVA. **P < fig. S10. Representative immunopathological images of intrahepatic xenografts (Ctrl and TTK KD HepG2 cells), human Ki67 (hki67), mouse Ki67 (mki67), and Tunel. Scale bar, 40 µm. n = 4-5 per group. 4
5 fig. S11. Intrahepatic HepG2 xenograft tissues from tumor-bearing mice. Experimental animals received Ctrl sirna or TTK sirna s120. Scale bar, 40 µm. n = 3 per group. fig. S12. Representative immunohistological images of intrahepatic xenograft tissues from tumor-bearing mice received Ctrl sirna or TTK sirna s120 by IHC of human Ki67 (hki67), mouse Ki67 (mki67), and Tunel. Scale bar, 100 µm. n = 3 per group. fig. S13. Representative images of pathology staining of intrahepatic xenografts from tumor-bearing mice received Ctrl sirna or TTK sirna s120 by IHC of human Ki67 (hki67), mouse Ki67 (mki67), and Tunel. Scale bar, 40 µm. n = 3 per group. 5
6 fig. S1 TTK Actin Pt#1 Pt#2 Pt#3 Pt#4 Pt#5 Pt#6 Pt#7 Pt#8 (KDa) Pt#9 Pt#10 Pt#11 Pt#12 Pt#13 Pt#14 Pt#15 Pt#16 TTK Actin Pt#17 Pt#18 Pt#19 Pt#20 Pt#21 Pt#22 Pt#23 Pt#24 TTK Actin TTK Actin Pt#25 Pt#26 Pt#27 Pt#28 Pt#29 Pt#30 Pt#31 Pt# TTK Actin Pt#33 Pt#34 (KDa) 97 42


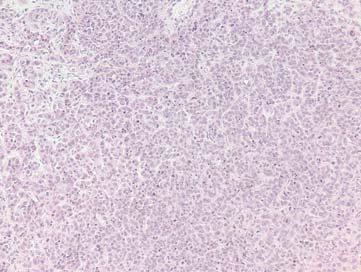
7 fig. S2 Poor H&E Moderate High


8 fig. S3 TTK PPIB DapB Image #2 Image #1
9 fig. S4 A mrna expression TTK/Actin (AU) B TTK HepG2 HepG2 Huh7 Huh7 Hep3B Hep3B PLC/PRF/5 PLC/PRF/5 SK-HEP-1 (KDa) 97 SK-HEP-1 Actin TTK/Actin (AU) HepG2 Huh7 Hep3B PLC/PRF/5 SK-HEP-1
10 fig. S5 TTK mrna (fold) HepG2 ** *** Ctrl TTK KD#1 TTK KD#2 Ctrl TTK KD#1 TTK KD#2 ** Huh7 **


11 fig. S6 24 hr 48 hr 72 hr 96 hr Ctrl TTK KD#1 HepG2 TTK KD#2 Ctrl TTK KD#1 Huh7 TTK KD#2
12 fig. S7 A Relative to control 1.5 Migration ** B 0.0 Ctrl TTK KD#1 TTK KD#2 Invasion Relative to control 1.5 ** *** Ctrl TTK KD#1 TTK KD#2
13 fig. S8 A Dying/senescent cells (Fold change) ** HepG2 * 3 ** 2 1 Huh7 ** 0 Ctrl TTK KD#1 TTK KD#2 0 Ctrl TTK KD#1 TTK KD#2 B Number of SA-β-Gal+ cells (per counting field) ** *** HepG2 * *** Huh7 Ctrl TTK KD#1 TTK KD#2
14 fig. S9 A B C Early apoptosis (Annexin V+) (Fold change) Apoptosis (Annexin V+PI+) (Fold change) Percent of cells ** Ctrl TTK KD#1 TTK KD#2 Ctrl TTK KD#1 TTK KD#2 Ctrl TTK KD#1 TTK KD#2 0 G1 S G2/M


 mki67")


15 fig. S10 Ctrl TTK KD Tunel (Field #2) Tunel (Field #1) mki67 hki67 H&E


16 fig. S11 Ctrl sirna TTK KD s120 #3 #2 #1


17 fig. S12 Ctrl sirna TTK KD s120 Tunel mki67 hki67


18 fig. S13 Ctrl sirna TTK KD s120 Tunel mki67 hki67 hki67