Introduc)on to ChIP- seq analysis
|
|
|
- Jerome Houston
- 5 years ago
- Views:
Transcription

1 Introduc)on to ChIP- seq analysis Shamith Samarajiwa Integra/ve Systems Biomedicine Group MRC Cancer Unit University of Cambridge Analysis of High- throughput sequencing data with BioConductor 1-3 June 2015

2 Where to get help! hkp://seqanswers.com hkp:// hkp:// list/ Read the pos/ng guide before sending !
3 Important!!! Good Experimental Design Op/mize Condi/ons (Cells, An/bodies, Sonica/on etc.) Biological Replicates (at least 3)!! sample biological varia/on / improve signal to noise capture the desired effect size sta/s/cal power to test null hypothesis ChIP- seq controls KO, Input or IgG
4 What is ChIP Sequencing? l Combina/on of chroma/n immunoprecipita/on (ChIP) with ultra high- throughput massively parallel sequencing. l Allows mapping of protein DNA interac/ons in vivo on a genome scale. l Enables mapping of transcrip/on factors binding, RNA Pol II occupancy or Histone modifica/on marks on a genome scale. l The typical ChIP assay usually take 4 5 days, and require approx ~ 10 7 cells.
5 Origin of ChIP- seq technology Barski, A., Cuddapah, S., Cui, K., Roh, T. Y., Schones, D. E., Wang, Z., et al. High- resolu/on profiling of histone methyla/ons in the human genome. Cell 2007 Johnson, D. S., Mortazavi, A., Myers, R. M., and Wold, B. Genome- wide mapping of in vivo protein- DNA interac/ons. Science 316, 2007 Mikkelsen, T. S., Ku, M., Jaffe, D. B., Issac, B., Lieberman, E., Giannoukos, G., et al. Genome- wide maps of chroma/n state in pluripo- tent and lineage- commiked cells. Nature 2007 Robertson et al., "Genome- wide profiles of STAT1 DNA associa/on using chroma/n immunoprecipita/on and massively parallel sequencing." Nat Methods. 2007

6

7

8

9
10 ChIP- seq methodology Cross- link cells Isolate genomic DNA Sonica)on Immuno- precipita)on Park 2009 Nat. Rev Genet.

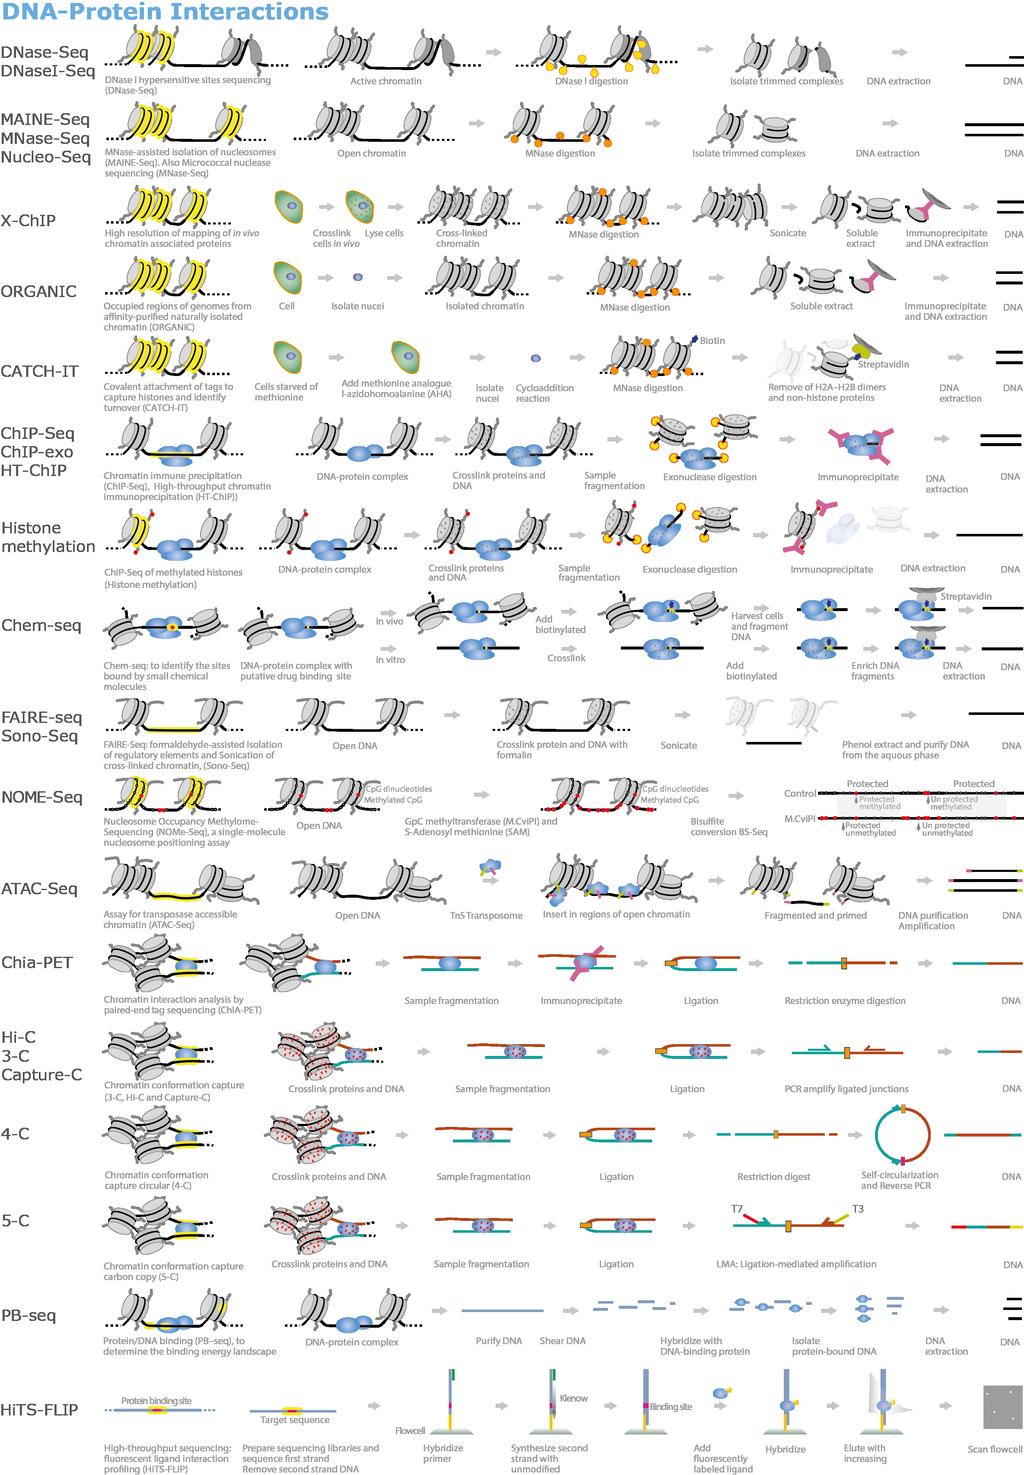
11 Advances in technologies for nucleic acid- protein interac)on detec)on ChIP- chip : combines ChIP with microarray technology. ChIP- PET : ChIP with paired end tag sequencing ChIP- exo : ChIP- seq with exonuclease diges/on CLIP- seq / HITS- CLIP : cross- linking immunoprecipita/on high throughput sequencing ATAC- seq : Assay for Transposon Accessible Chroma/n Sono- seq : Sonica/on of cross linked chroma/n sequencing. Hi- C: High throughput long distance chroma/n interac/ons

12
13 Sta)s)cal aspects and best prac)ces Experimental guidelines: Landt et al., ChIP- seq guidelines and prac/ces of the ENCODE and modencode consor/a. Genome Res Marinov et al., Large- scale quality analysis of published ChIP- seq data G3 Rozowsky et al., "PeakSeq enables systema/c scoring of ChIP- seq experiments rela/ve to controls" Nat Biotechnol Sta)s)cal aspects: Cairns et al., Sta/s/cal Aspects of ChIP- Seq Analysis. Advances in Sta?s?cal Bioinforma?cs, Carroll TS et al., Impact of ar/fact removal on ChIP quality metrics in ChIP- seq and ChIP- exo data. Front Genet Bailey T et al., "Prac/cal guidelines for the comprehensive analysis of ChIP- seq data. PLoS Comput Biol These guidelines address : An/body valida/on, Experimental replica/on, Sequencing depth, Data and metadata repor/ng, Data quality assessment. Replicates
14 ChIP- seq workflow overview I l ChIP- seq 'wet- lab processing and library prepara/on Sequencing and Data processing: l Quality control of raw reads l Mapping reads to a reference genome l Remove artefacts and technical noise l Visualiza/on and Replicate comparison l Binding site iden/fica/on: peak calling and other methods l Peak QC l Iden/fy replicated, high confidence binding sites (IDR and other methods).

15 Illumina Genome Analysis System
 -GAII, HiSeq 1-n Gb of sequences in a single run 35-100 bases in length 454 Life Sciences (Roche Diagnostics) 25-50 MB of")
16 Sequencers hkp://omicsmaps.com Solexa (Illumina) -GAII, HiSeq 1-n Gb of sequences in a single run bases in length 454 Life Sciences (Roche Diagnostics) MB of sequences in a single run Up to 500 bases in length SOLiD (Applied Biosystems) 6 GB of sequences in a single run 35 bases in length


17 Sequencing Bridge Amplification Sequencing Cluster growth Incorporation of fluorescence, reversibly terminated tagged nt

18 Sequencer Output Quality Scores Sequence Files


19 FASTQ formats A FASTQ file normally uses four lines per sequence. Line- 1 begins with a '@' character and is followed by a sequence iden/fier and an op/onal descrip/on. Line- 2 is the raw sequence lekers. Line- 3 begins with a '+' character and is op/onally followed by the same sequence iden/fier again. Line- 4 encodes the quality scores (ASCII) for the sequence in Line 2. Historically there are a number of different FASTQ formats. These include the Sanger Format, Illumina/Solexa 1.0, Illumina 1.3, 1.5 and 1.8. The Sanger FASTQ file format for sequences with quality scores, and the Solexa/Illumina FASTQ variants. Cock PJ, Fields CJ, Goto N, Heuer ML, Rice PM. Nucleic Acids Res Apr;38(6):
20 Mul)plexing Number of reads per run con/nue to increase. Mul/plexing gives the ability to sequence mul/ple samples at the same. Useful when sequencing small genomes or specific genomic regions. Different barcode adaptors are ligated to different samples
21 Quality control of short reads l If samples were mul/plexed on flow- cells, use barcodes to de- mul/plex reads. l Detect and trim adapters. l Remove primers and other artefact sequences. l Check for PCR duplicates. Tools: De- mul/plexing: FASTX toolkit, QIIME, ea- u/ls Artefact detec/on: FASTQC, NGSQC Artefact removal: CutAdapt, TrimGalore, ShortRead, Useq, TagDust, FASTX toolkit
22 Get external sequencing data via SRA tool- kit Extract data sets from the Sequence Read Archive or dbgap (NCBI) These repositories store sequencing data in SRA format Fastq- dump: Convert SRA data into Fastq format sam- dump: Convert SRA data to SAM format sra- stat: Generate sta/s/cs about SRA data (quality distribu/on, etc.) vdb- validate: Validate the integrity of downloaded SRA data
23 Map to reference genome
24 Aligners
25 Alignment to Reference Genome BWA & SAMtools example make reference genome index: bwa index - p hg19bwaidx - a bwtsw hg19.fa align to hg19 reference: bwa aln - t 4 hg19bwaidx sequence.fq.gz > sequence.fq.sai generate SAM file: bwa samse hg19bwaidx sequence.fq.sai sequence.fq.gz > sequence.fq.sam make BAM file: samtools view b sequence.fq.sam > sequence.fq.bam sort: samtools sort o O bam T sorted sequence.fq.bam index: samtools index b sequence.fq_sorted.bam sequence.fq_sorted.bai BWA (Li & Durbin 2009) SAMtools (Li et al., 2009)
26 Sequencing Depth Rozowsky 2009 More prominent peaks are iden/fied with fewer reads, versus weaker peaks that require greater depth Number of puta/ve target regions con/nues to increase significantly as a func/on of sequencing depth Narrow Peaks: million reads, Broad Peaks: million reads hkps://genohub.com/recommended- sequencing- coverage- by- applica/on/
27 Mappability *Calculated based on 30nt sequence tags Rozowsky, (2009) Not all of the genome is available for mapping when reads are aligned to the unmasked genome. Alignability: This provide a measure of how o{en the sequence found at the par/cular loca/on will align within the whole genome. Uniqueness: This is a direct measure of sequence uniqueness throughout the reference genome.

28 Strand dependent bimodality Wilbanks et al PLOS One
29 Open chroma/n regions are more easily fragmented than closed regions. Uneven read distribu/on Why we need control samples Repe//ve sequences may appear to be enriched. Compare ChIPseq peak with same region in Input control.
30 Artefact removal 1 A{er reads have been aligned to the reference genome, blacklisted regions are removed from BAM files before peak calling. Blacklisted regions are genomic regions with anomalous, unstructured, high signal or read counts in NGS experiments, independent of cell type or experiment. The blacklisted regions typically appear uniquely mappable, so simple mappability filters do not remove them. These regions are o{en found at repe//ve regions (Centromeres, Telomeres, Satellite repeats) and are troublesome for high throughput sequencing aligners and when compu/ng genome wide correla/ons. These regions also confuse peak callers and result in spurious signal.
31 Artefact removal 2 The DAC Blacklisted Regions aim to iden/fy a comprehensive set of regions in the human genome that have anomalous, unstructured, high signal/read counts in NGS experiments, independent of cell line and type of experiment. 80 open chroma)n tracks (DNase and FAIRE data- sets) and 20 ChIP- seq input/control tracks spanning ~60 human )ssue types/cell lines in total used to iden)fy these regions with signal artefacts. These regions tend to have a very high ra/o of mul/- mapping to uniquely mapping reads and high variance in mappability. The DAC Blacklisted Regions track was generated for the ENCODE project. The Duke Excluded Regions contains problema/c regions for short sequence tag signal detec/on (such as satellites and rrna genes). Grey Lists represent regions of high artefact signals that are specific to your cell- type or sample, and can be tuned depending on the stringency required.
32 Artefact removal 3 Resources: Where to get Blacklist BED file: hkp://genome.ucsc.edu/cgi- bin/hgfileui?db=hg19&g=wgencodemapability How they were generated: hkp:// blacklist- README.pdf ChIPseq Quality control : Carroll et al., Impact of ar/fact removal on ChIP quality metrics in ChIP- seq and ChIP- exo data. Front Genet GreyListChIP ChIPQC

33 Visualizing binding sites and replicates Integrated Genome Viewer (IGV)


34 Peak Calling Iden/fies TF binding sites Count based - Define regions. Count the number of reads falling into each region. When a region contains a sta/s/cally significant number of reads, call that region a peak. Shape based - Consider individual candidate binding sites. Model the spa/al distribu/on of reads in surrounding regions, and call a peak when the read distribu/on conforms to the expected distribu/on near a binding site. Sharp Peaks Broad Peaks
35 Peak Shapes Different ChIPseq applica/ons have different peaks shapes. TF and regulatory element binding epigene/c marks are narrow, while histone modifica/ons marking transcribed or repressed domains are broad. Most peak callers have been designed to find narrow peaks. The same TF may have different peak shapes reflec/ng different biological proper/es of binding. Replicates should have similar binding pakerns. Evalua/on of algorithm performance in ChIP- seq peak detec/on. Wilbanks EG, Faccio~ MT. PLoS One Jul 8;5(7):e11471.
36 Peak Callers There are dozens of peaks callers. Some are good, others bad, none perfect! Sharp TF & regulatory element associated epigene)c mark peaks: MACS v1.4.2 & MACS v2: model based analysis for ChIP- seq (Zhang et al., 2008; Feng et al., 2011) BayesPeak: A Bayesian peak caller (Cairns et al., 2011) Jmosaics: Joint analysis of mul/ple ChIP- seq datasets (Zeng et al., 2013) SPP (Kharchenko et al., 2008) T- PIC (Hover et al.) Diffuse chroma)n modifica)on peaks: RSEG, SICER
37 ChIPseq Quality Control