seminar
|
|
|
- Theresa Greene
- 5 years ago
- Views:
Transcription
1 seminar


2
3 Flow cytometry Process or measurement method can measure discrete properties physical, chemical, biochemical, biological parameters of separate particles, e.g. biological cells in flow. Flow Sorting cells or particles separation by measured parameters FACS: Fluorescence-Activated Cell Sorting
4
5 Particles cells - count in cell suspension. Biological and non biological separation. Live and dead particles, cells separation particles measured in 1 minute. Measurement of scattering and/or inner fluorescence of particles. Sorting: separation of discrete particles.
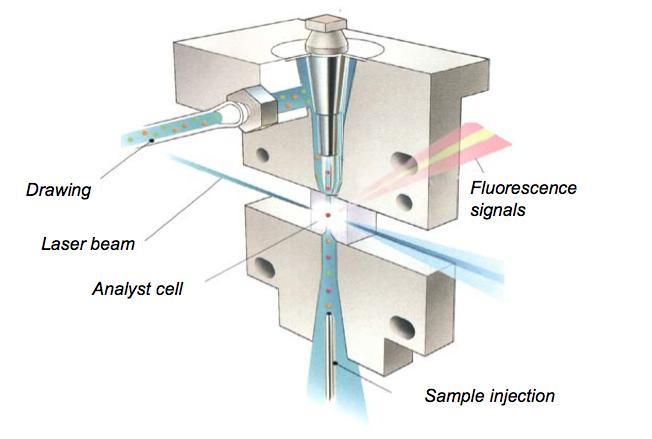
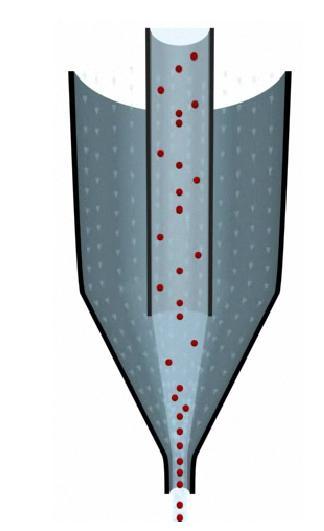
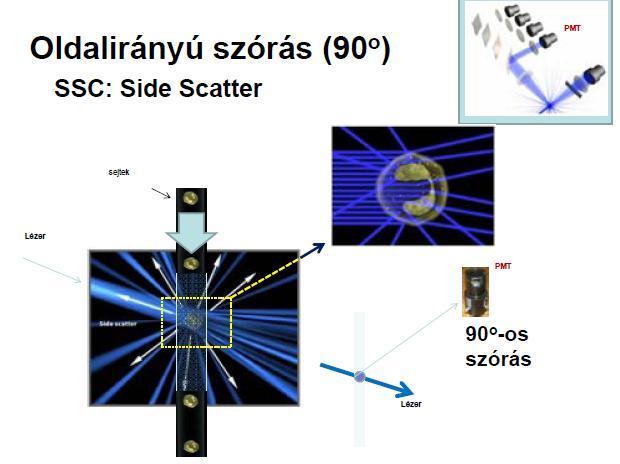
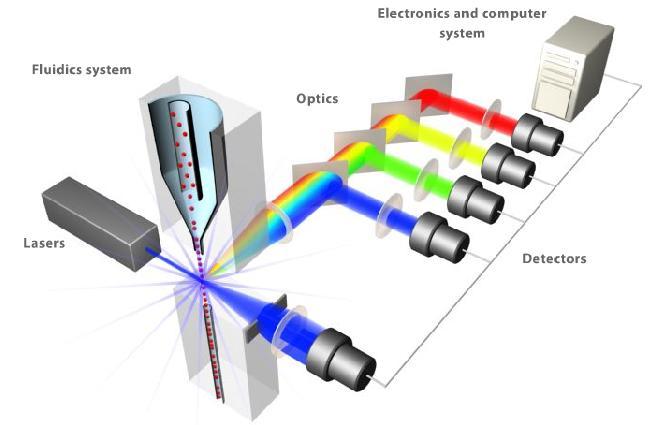
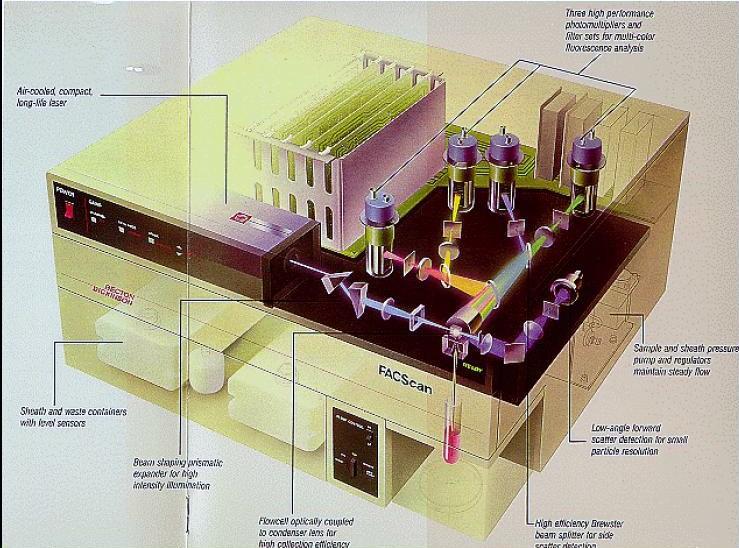
6 The particles pass through a hydrodynamically focused flow in an exciting light beam (laser, Hg-vapour lamp, etc.). Scattering signals detection. Specific fluorescence detection Multiparameter data analysis. Electrostatic or mechanic particles separation: sorting.
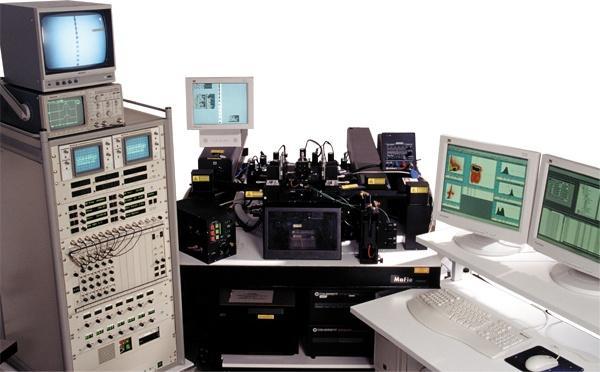
7 Light source Flow system Optics Detection system Data collection Data analysis Sorting
8
9
10 Piezzoelectric vibrator (30-40 khz) decomposes the fluid column into droplets The fromation of the droplets will be stationary Based on the fluorescent/light scattering data the droplets will be charged with positive or negative charge
11
12
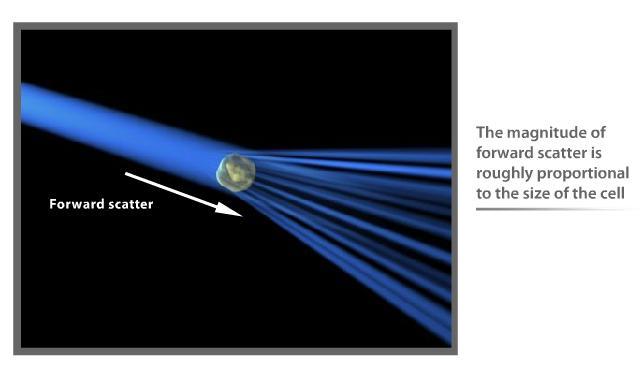
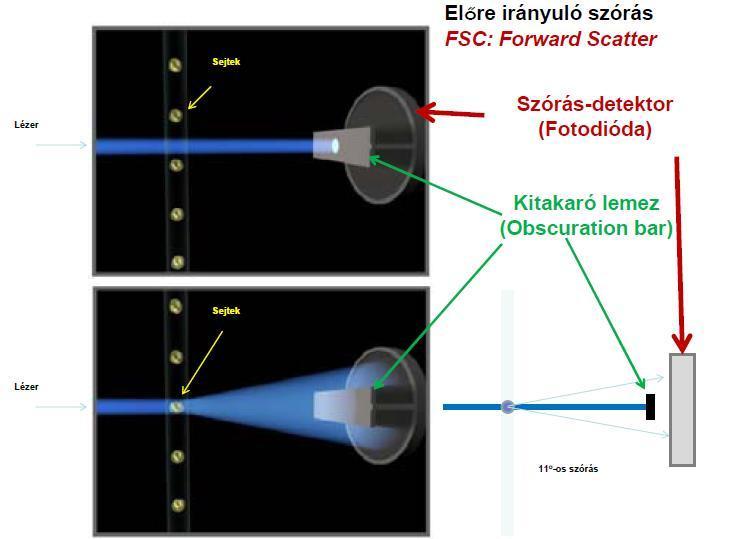
13 Light: Exciting/illuminating system lasers( , 420, 457, 488, 514, 532, 600, 633 nm) Argon ion, Krypton ion, HeNe, HeCd, Yag, solid state Arc-lamps Mercury-vapour, Hg-Xenon (right lines) Detecting system Photomultiplier tubes (PMTs) Formerly 1-2 tubes Currently tubes. Photodiods Forward scatter (FSC) measurement

14
15 photodiod
16 scatter
17


18
19
20

21 FSC SSC FITC Lézer Laser delay késleltetés APC
22 Laser delay
23 Signal width : Peak height : Area : No deadtime!!!! The number of the sample The biggest value The sum of the numbers signal area height width
24
25 FCS (flow cytometry standatrd) file contains all the data measured = list mode file


26 Plotting methods: 1. Dotplot: : 2 axis, 1 parameter on each axis, one data regards to one cell 2. Density plot: the color of the dots means the number of the cells 3. Contour plot: dots with the same values are bound with lines. 4. 3D (surface) plot: the cell numer is on the z axis
27 Distribution of the whole FL4 measured through the red gate Distribution of the whole FL4 measured
28

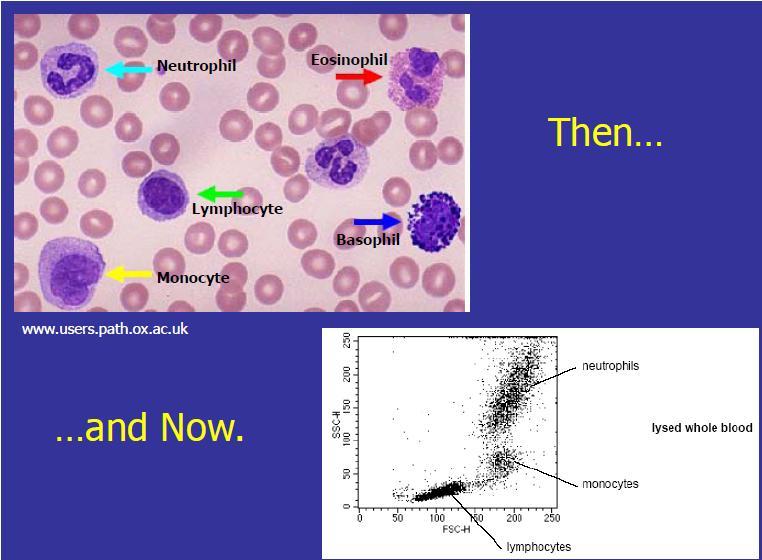
29 The leucocytes and (other cells) express specific molecule combination on a surface of a cell, which depends on: types of the cells, stage of differentiation of cells, active and inactive state of cells other functional state of cells, pathological mutations, differentiation mechanisms. Typically detection happen by monoclonal antibodies. The antibodies are labeled by fluorescence stain for flow cytometry.
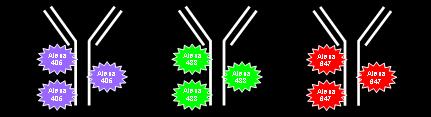

30 Single fluoreszcens festékkel Tandem festékkel
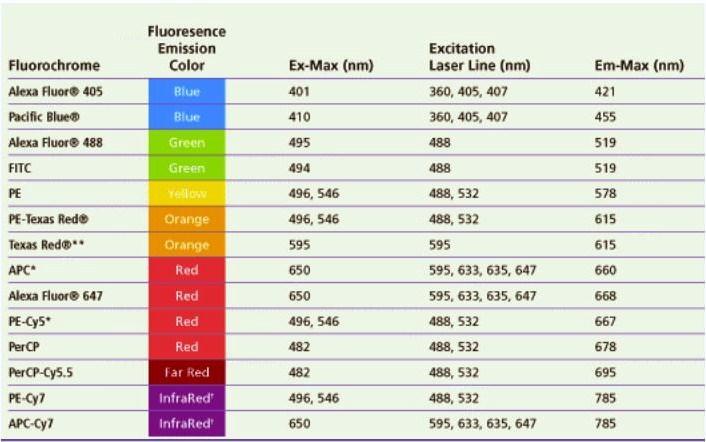
31 Emits the wavelength, where the auto fluorescence is small. The emission spectrum has to have minimal overlap with the spectrum of the other stains (compensation). Have to have high quantum efficiency, absorption coefficient, so they must generate strong, detectable fluorescence (sensitivity). Have to have small nonspecific binding. Have to have a simple protocol to label the proteins (antibodies). Do not modify the properties of labeled molecule significantly. Have to be cheap
32
33
34
 bindingto the DNA 3.")

35 1. Fixation and permeabilization of cells (immobilize the antigens, maintaining the cellular and subcellular architecture 2. The fluorophore penetrates into the nuclei (f.e. propidium jodid) bindingto the DNA 3. The fluorescence intensity measured proportional to the DNA content of the nuclei Application field: Cancer cells Have higher DNA content higher S and G2/M ratio
36
 whilst suspended cells pass through across a thin slit")
37 Patented technique in 1953: It can detect the fluctuation of the electric conductance (resistance) whilst suspended cells pass through across a thin slit in buffer.
38 Flow cytometer to detect bacteria in aerosol. This innovation happened during the II. World War, it was published in The aim was the fast detection of the mid-air spreading bacteria, for statement of biological weapons. Instrument: The filtered air was circulated through the cell of a dark-field vision microscope. The lamp was a headlight from the Ford factory, they used PMT for detecting.

39 He built probably the first fluidic cell-sorter to value the cells identified in his RCS. Kamensky s first bench top instrument the Cytograph. This measured scatter using a He-Ne laser. This particular instrument was a model prior to the fluorescence detection model.
40 The separation of cells happens by their volume, by the principle of Coulter counter. The partition of the elected cells happened by electrostatic diversion. (The principle of the turbo sorting is the same nowadays too). It can separate neutrofil cells and limfocytes from blood.