Tuning and predicting mesh size and protein. release from step growth hydrogels
|
|
|
- Ashley Reeves
- 5 years ago
- Views:
Transcription
1 SUPPLEMENTARY INFORMATION Tuning and predicting mesh size and protein release from step growth hydrogels Matthew S. Rehmann, Kelsi M. Skeens, Prathamesh M. Kharkar, Eden M. Ford, Emanual Maverakis#, Kelvin H. Lee, April M. Kloxin * Department of Chemical and Biomolecular Engineering, University of Delaware, 150 Academy Street, Newark, Delaware 19716, United States Department of Materials Science and Engineering, University of Delaware, 201 DuPont Hall, Newark, Delaware 19716, United States # Department of Dermatology, School of Medicine, University of California, Davis, California Delaware Biotechnology Institute, University of Delaware, 15 Innovation Way, Newark, DE * akloxin@udel.edu. Tel:
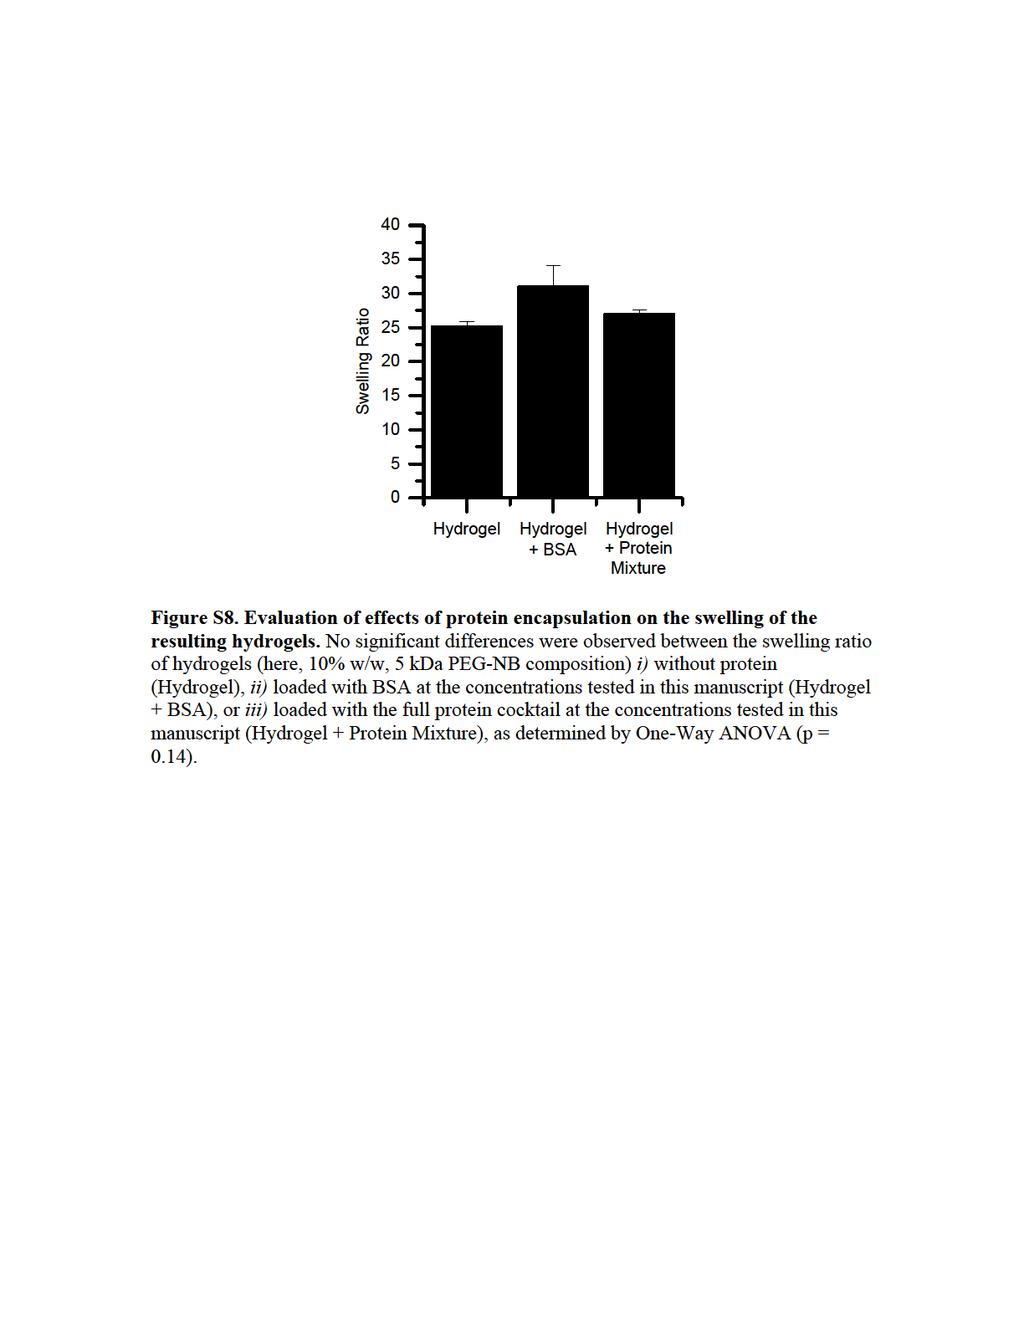
2 Supplemental Materials and Methods Evaluation of swelling ratio and calculation of mesh size of protein-loaded hydrogels Swelling measurements were performed on hydrogels formed in cylindrical molds according to the protocol described in Section 2.2. Hydrogels were formed at a final composition of 10% w/w for PEG-4Nb (5k molecular weight), 40 mm PEG-2SH (i.e. equimolar Nb and SH), and 0.05% w/w LAP. Proteins were added to hydrogel precursor solutions at one of three concentrations: (i) no protein, (ii) BSA at 0.06 mg/ml, or (iii) the protein cocktail (i.e. aprotinin at 0.35 mg/ml, myoglobin at 0.60 mg/ml, BSA at 0.06 mg/ml, lactoferrin at 0.07 mg/ml, and thyroglobulin at 0.09 mg/ml). Swelling measurements were conducted as described in Section 2.3, and mesh sizes were calculated by equilibrium swelling theory as described in Section 2.6. Generation of BSA ribbon structure In order to generate a ribbon structure of BSA, the PDB file of the structure of BSA was obtained from the Research Collaboratory for Structural Bioinformatics Protein Data Bank 1,2 deposited by Majorek et al. 3 The PDB file was imported into Maestro software (version , Schrödinger, LLC, New York, NY, 2016). The options for Show Ribbons for All Residues and Undisplay Atoms were selected. Evaluation of PDGF bioactivity In order to evaluate the bioactivity of PDGF after exposure to free radicals, mimicking the gelation protocol, 23.3 ng/µl PDGF-BB was first mixed with 20% w/w, 10k molecular weight PEG-4Nb, 80 mm L-cysteine (Sigma-Aldrich), and 0.05% w/w LAP photoinitiator in PBS. These concentrations represent concentrations used to form 20% w/w, 10k MW hydrogels (which are equal to concentrations used to form 10% w/w, 5k MW hydrogels), except with the monofunctional cysteine used instead of the difunctional
3 crosslinker, to avoid gelation after polymerization. After mixing, the solutions were irradiated at 365 nm light and 10 W/cm 2 for 1 minute, again mimicking the gelation protocol. Human mesenchymal stem cells (hmscs; Lonza) were seeded on tissue culture plates at 2000 cells/cm 2, mimicking a procedure for assessing PDGF bioactivity from Gharibi and Hughes. 4 hmscs were cultured for 14 days in low-glucose DMEM (Gibco) with 10% FBS (Gibco), 1% penicillin/streptomycin (Gibco), and 0.2% Fungizone (Gibco), with the addition of either i) no exogenous PDGF-BB, ii) 10 ng/ml pristine PDGF-BB, or iii) 10 ng/ml PDGF-BB exposed to PEG and radicals as described above. Medium was changed every 2 days. After 14 days of culture, cells were stained with DAPI, collagen I, and tenascin-c following a previously published protocol. 5 Briefly, samples were fixed overnight in 4% paraformaldehyde (Alfa Aesar). Samples were washed with PBS, permeabilized for 10 minutes in PBS + 0.1% Triton-X (Fisher Scientific), washed, blocked in PBS + 50 mg/ml bovine serum albumin (Sigma-Aldrich) for 2 hours, washed again, and incubated overnight at 4 C with rabbit polyclonal to collagen I (Abcam) and mouse monoclonal to tenascin-c (Abcam), each diluted 1:200 in PBS + 15 mg/ml BSA. The next day, samples were washed with PBS % Tween-20 (Sigma-Aldrich), incubated for 1 hour in Alexa Fluor 647 goat anti-rabbit (Life Technologies) and Alexa Fluor 488 goat antimouse (Life Technologies), each diluted 1:500 in PBS + 15 mg/ml BSA, and stored overnight at 4 C in PBS. Lastly, cells were stained with 700 nm DAPI (4',6-diamidino-2- phenylindole; Life Technologies) in PBS, washed, and imaged immediately on an Axio Observer Z1 microscope (Zeiss, Germany). The DAPI images were analyzed using the Cell Counter module on ImageJ (National Institutes of Health, Bethesda, MD).
4
5
6
7 [M + H] = Relative Abundance [M + 2H] 2+ /2 = [M+Na] + = m/z Figure S4. ESI-MS of synthesized NondegXlink. Expected MW: g/mol. Observed MW: [M+H] + = g/mol; [M + 2H] 2+ /2 = 415.5; [M+Na] + = 851.4
8 [M + 4H] 4+ /4 = % [M + 3H] 3+ /3 = [M + 2H] 2+ /2 = Figure S5. ESI-MS of synthesized DegXlink. Expected MW: g/mol. Observed MW: [M + 2H] 2+ /2 = ; [M + 3H] 3+ /3 = ; [M + 4H] 4+ /4 = ;

9 Figure S6. A schematic of the molds used to form hydrogels for swelling and protein release measurements in this study.
10
11 Table S1. Extinction coefficients used to calculate the concentrations of protein stock solutions. Protein Extinction Coefficient Reference (g/100 ml) -1 cm -1 Aprotinin 8.4 Manufacturer Myoglobin 8.2 Manufacturer BSA 6.6 Manufacturer Lactoferrin 14.6 Manufacturer Thyroglobulin 10.0 Ref. 6
12 Table S2. Mesh sizes (presented as mean ± standard error) for the hydrogel compositions displayed in Figure 2. Calculated Mesh Size (nm) Composition Equilibrium Swelling Rubber Elasticity Theory Theory 10 kda PEG-4Nb; 4 wt% 12.3 ± ± kda PEG-4Nb; 10 wt% 9.8 ± ± kda PEG-4Nb; 20 wt% 7.6 ± ± kda PEG-4Nb; 10 wt% 6.6 ± ± kda PEG-4Nb; 10 wt% 15.2 ± ± 0.5
13 Table S3. Mesh sizes (presented as mean ± standard error) for the hydrogel compositions displayed in Figure 3. Calculated Mesh Size Identity of Crosslinker-2SH Rubber Elasticity Theory Equilibrium Swelling Theory PEG-2SH 7.6 ± ± 0.2 NondegXlink 6.9 ± ± 0.3 DegXlink 7.7 ± ± 0.2
14
15

16
17
18 Supplementary Information References (1) Berman, H. M.; Westbrook, J.; Feng, Z.; Gilliland, G.; Bhat, T. N.; Weissig, H.; Shindyalov, I. N.; Bourne, P. E. Nucleic Acids Res. 2000, 28 (1), (2) Research Collaboratory for Structural Bioinformatics. RCSB Protein Data Bank (accessed Oct 6, 2016). (3) Majorek, K. A.; Porebski, P. J.; Dayal, A.; Zimmerman, M. D.; Jablonska, K.; Stewart, A. J.; Chruszcz, M.; Minor, W. Mol. Immunol. 2012, 52 (3 4), (4) Gharibi, B.; Hughes, F. J. Stem Cells Transl. Med. 2012, 1 (11), (5) Rehmann, M. S.; Luna, J. I.; Maverakis, E.; Kloxin, A. M. J. Biomed. Mater. Res. Part A 2016, 104 (5), (6) Shifrin, S.; Consiglio, E.; Laccetti, P.; Salvatore, G.; Kohn, L. D. J. Biol. Chem. 1982, 257 (16), (7) Wright, A. K.; Thompson, M. R. Biophys. J. 1975, 15 (2), (8) Peters Jr., T. In All About Albumin: Biochemistry, Genetics, and Medical Applications; Academic Press: San Diego, CA, 1996; pp (9) Branco, M. C.; Pochan, D. J.; Wagner, N. J.; Schneider, J. P. Biomaterials 2010, 31 (36),