Xpose Validation F. Martins & J-J. Maoret
|
|
|
- Violet Wilkinson
- 5 years ago
- Views:
Transcription

1 Xpose Validation F. Martins & J-J. Maoret 1
 and contamination of residual genomic DNA. All samples were also measured on our NanoDrop 2000 as comparative technique.")
 0,03-200µg/µl) Xpose slide-40 Xpose slide-200 1 micro-cuvette : 0.5 mm path length range : 0.")
2 These tests were performed to validate the Xpose for RNA quantification under conditions of contamination by common elution buffer components (Tris, EDTA, Ethanol), carry-over from the extraction protocol (Qiazol) and contamination of residual genomic DNA. All samples were also measured on our NanoDrop 2000 as comparative technique. There are 2 types of slides on Xpose with a wide range of linearity: - slide-40 : 0,03 to 40 OD (DNA : 1,5-2000ng/µl, RNA : 1,2-1600ng/µl and protein (E1% = 1) 0,03-40µg/µl) - slide-200 : 0,03 to 200 OD (DNA : 1, ng/µl, RNA : 1,2-8000ng/µl and protein (E1% = 1) 0,03-200µg/µl) Xpose slide-40 Xpose slide micro-cuvette : 0.5 mm path length range : 0.03 to 40 OD (10mm) 2 micro-cuvette : mm path length; range : 0.03 to 200 OD (10mm) 2

3 The UV/VIS spectrum obtained on Xpose (white curve) is the result of four specific profiles : - In blue, molecule of interest (total RNA, gdna or total protein) - In orange, impurities : molecules which absorb at the same wavelength region as molecule of interest, being other nucleotides, thiocyanate salts, EDTA, phenol, citrate and azide. - In gray, sample background indicating turbidity of the sample and the presence of beads, hemoglobin residues and others carry-over constituents absorbing in the VIS region. - In yellow, residues corresponding to the portion of the unidentified spectrum in % of the white spectrum. The white curve is the sum of blue + orange + yellow. The gray background is subtracted from the measured spectrum before the establishment of other profiles. 3
 and Xpose (right, 230-450nm).")
4 RNA used for these tests is an BioRad mouse liver RNA. Its initial concentration is 500 ng/µl but for the purposes of manipulation, we diluted it to 100 ng/µl. Below the RNA spectrum : NanoDrop (left, nm) and Xpose (right, nm). Sample name RNA (ng/ul) Nucleic acids (ng/ul) Impurities (A260) Background (A260) Residue (%) A260 A260/A280 A260/A230 ARN 102,3 2,558 1,99 2,24 ARN The table above shows the equivalent results from the 2 devices : NanoDrop and Xpose (highlighted in yellow). We first looked at the effect of several most commonly used buffers on the absorbance spectrum of RNA. 4
 Nucleic acids (ng/ul) Impurities (A260) Background (A260) Residue (%) A260 A260/A280 A260/A230 ARN Tris100mM 83,3 2,083 1,95 1,88 ARN Tris100mM 78.3 80.")

5 Effect of Tris contamination We have established a dilution range of Tris from 10mM (Tris concentration in TE) to 100 mm. Sample name RNA (ng/ul) Nucleic acids (ng/ul) Impurities (A260) Background (A260) Residue (%) A260 A260/A280 A260/A230 ARN Tris100mM 83,3 2,083 1,95 1,88 ARN Tris100mM ARN Tris50mM 83,5 2,088 2,01 2,01 ARN Tris50mM ARN Tris20mM 85,7 2,142 2,05 2,15 ARN Tris20mM ARN Tris10mM 95,1 2,378 2,1 2,12 ARN Tris10mM All this shows that Tris contamination often present in samples does not influence the RNA absorbance spectrum significantly. 5
 (ng/ul) (A260) (A260) (%) A260 A260/A280 A260/A230 ARN EDTA 1% 99,7 2,491 2,17 0,51 ARN EDTA 1% 97.3 97.3 0.11 0.00 0.7 2.54 2.19 0.")
6 Effect of EDTA contamination We performed 2 tests : one at 0.2% corresponding to 1 mm (EDTA concentration in TE) and a second at 1% or 5 mm. Nucleic acids Impurities Background Residue Sample name RNA (ng/ul) (ng/ul) (A260) (A260) (%) A260 A260/A280 A260/A230 ARN EDTA 1% 99,7 2,491 2,17 0,51 ARN EDTA 1% ARN EDTA 0.2% 105,4 2,636 2,08 1,48 ARN EDTA 0,2% EDTA has an inhibitory effect on the MgCl2 dependent reactions such as Reverse Transcription and Q-PCR. EDTA has no effect on the RNA quantification but on the A260 / A230 ratio. 6

7 Effect of ethanol contamination Nucleic acids Impurities Background Residue Sample name RNA (ng/ul) (ng/ul) (A260) (A260) (%) A260 A260/A280 A260/A230 ARN Ethanol 5% 103,8 2, ,26 ARN Ethanol 5% We diluted RNA in 5% ethanol and we did not see any influence of ethanol on the RNA absorbance spectrum. 7


8 Effect of genomic DNA contamination For this test, we used a fixed concentration of genomic DNA of 8ng/µl, spiked into varying RNA concentration. 8% = 100ng/µl RNA; 40% = 20ng/µl RNA et 100% = 8ng/µl RNA. 8
9 Nucleic acids Impurities Background Residue Sample name RNA (ng/ul) (ng/ul) (A260) (A260) (%) A260 A260/A280 A260/A230 ARN ADN 8% 118,6 2,964 2,11 1,67 ARN ADN 8% ARN ADN 40% 30,2 0,754 2,14 0,94 ARN ADN 40% ARN ADN 100% 14 0,349 2,25 0,55 ARN ADN 100% In this specific case of genomic DNA contamination, the Xpose cannot tell the difference between DNA and RNA and as the NanoDrop it gives an overall concentration of nucleic acids. 9

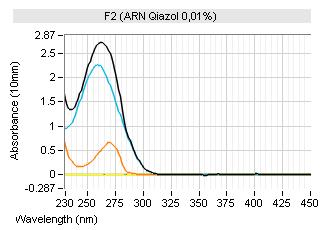
10 Effect of Qiazol contamination 10
11 Nucleic acids Impurities Background Residue Sample name RNA (ng/ul) (ng/ul) (A260) (A260) (%) A260 A260/A280 A260/A230 ARN Qiazol 0.5% 807,1 20,177 1,67 0,78 ARN Qiazol 0,5% ARN Qiazol 0.1% 250 6,249 1,77 0,96 ARN Qiazol 0,1% ARN Qiazol 0.01% 112,9 2,823 1,88 1,71 ARN Qiazol 0,01% This test shows the dramatic effect of Qiazol on the RNA absorbance spectrum. Qiazol is composed of guanidine isothiocyanate and phenol. Guanidine isothiocyanate has a very large effect on the A260/A230 ratio, a ratio below 1 means that its concentration can inhibit enzyme reactions. Phenol has an effect on the RNA quantification and its absorption peak at 270 nm affects the A260/A280 ratio. For a contamination of 0.5%, the measured concentration on NanoDrop is 8 times higher than the expected value of 100 ng/µl. The Xpose shows a better specificity in terms of RNA quantification in Qiazol contaminated samples compared to the NanoDrop who sees nothing. Although the Xpose does tend to underestimate the RNA concentration in samples with 0.1 and 0.5% of contamination. 11
12 Particular case : In some cases, the Xpose cannot discriminate the nucleic acid of interest from other nucleic acids: 1- when the sample had an OD at 260nm less than 0.5 (10 mm) 2- when the amount of residue is greater than 2.5% due to an unknown component. In these two cases the total amount of nucleic acids is shown in pink and then the concentration is calculated by multiplying the A260 by the factor of concentration of the desired nucleic acid: 40 for RNA and 50 for dsdna. 12
13 All these results clearly show that Xpose permits to : - give the same results as NanoDrop for quantification of pure/non-contaminated nucleic acids - subtract the spectrum of carry-over chemicals and better assess the real amount of nucleic acids compared with NanoDrop in case of EDTA or Qiazol (guanidine isothiocyanate + phenol) contamination - measure 1 to 16 samples simultaneously, in 1 minute and without risk of cross contamination - store loaded samples for 2 hours in the Slides before readout on the instrument without effects of evaporation - distribute micro-volumes (2µl) samples quickly on the slides with an 8 channel pipette - measure samples in a wide range of linearity ( OD or 1.5 à ng/µl for dsdna) - specifically quantify DNA, RNA in a extraction kit independent manner - export the results to USB key in several formats including HTML (data table + curves) In addition, the Xpose doesn't requires maintenance, it is not sensitive to fluctuations of the optical path because these are determined within the properties of the slides. Contact : get-tq@genotoul.fr 13