Daniel Cuthbertson Agilent Technologies Denver, Colorado
|
|
|
- Ezra Howard Gordon
- 5 years ago
- Views:
Transcription
1 Daniel Cuthbertson Agilent Technologies Denver, Colorado

2 Biology is Transitioning Into the Era of Big Data Agilent Mass Spectrometry (MS) technology can provide information on hundreds and potentially thousands of biomolecules in a single analysis Multivariate statistics are required to mine the data for useful correlations that can be interpreted in a biological context Use your statistical plan to influence your experimental design in the era of Big Data Agilent Mass Profiler Professional and Pathway Architect provides you with a MS centric multivariate statistics platform that provides biological context


3 Prevailing Paradigm for Biological Information Flow Genomics Transcriptomics Proteomics Metabolomics Genes mrna Proteins Metabolites 3 April 2013

4 Agilent Software MPP and Pathway Architect: Changing Data Into A Pathway Visualization Start here Finish here
5 Work Flow To Convert Data To A Pathway Visualization Acquire Data Analyze Metabolomics or Proteomics samples Use GC/MS or LC/MS to analyze samples Analyze Data Mine data using either MassHunter or Spectrum Mill Analyze in Mass Profiler Professional Identify Compounds Use Mass Profiler Professional s ID Browser Search METLIN or Fiehn to Annotate Metabolites Pathway Analysis Select data and interpretation for pathway mapping Specify species, select pathway database and go

6 MassHunter Profinder: Achieving High Data Fidelity is Crucial for Multivariate Statistics Challenges: Incomplete peak separation Isomeric and Isobaric Compounds Unresolved peaks contributing to: False peak detection Missing values Wasted Time Identification Errors False Biomarker Discovery

7 The MassHunter Profinder Solution: Key improvements Batch centric untargeted and targeted feature extraction Designed specifically for metabolomics and differential analysis users. Recursive analysis in a single program. Compound group centric: Easy manual review and editing It s FREE!

8 Batch Molecular Feature Extraction Process Related isotopes, adducts and dimers are grouped into a single compound. -> Reduces Noise Profinder uniquely aligns the compounds, builds a consensus library which enables recursive, re-extraction of the batch data.

9 The Three Primary Workflows in Profinder 1. Batch Molecular Feature Extraction Reduces False Positives 2. Batch Recursive Feature Extraction Reduces False Negatives, Allows Editing 3. Batch Targeted Feature Extraction Uses database targets, Allows Editing

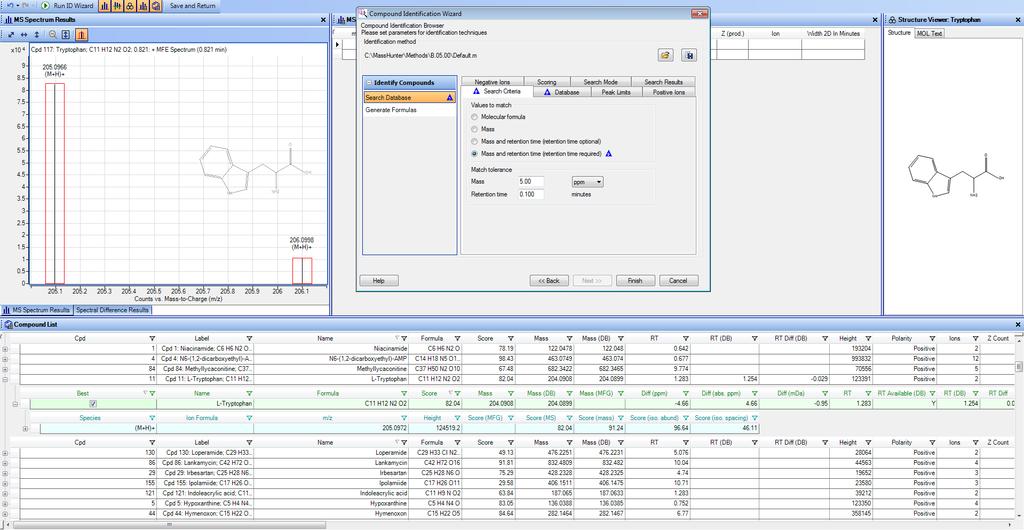
10 Profinder Interface : Compound Centric Visualization and Editing

11 Bakers Yeast is an Ideal Model Organism For Studying Pathways Saccharomyces cerevisiae is an extensively used model organism. Biochemisty and pathways extensively studied. Fully sequenced genome. Ideal for Multi-Omics studies with the goal of facilitating research for other organisms.


12 Calcinuerin Inhibitors Were be Used to Study Pathways Related to Immunosuppression Cyclosporin A FK-506 Goal: Determine additional metabolites, proteins and pathways affected by the drug treatment
13 CaCl2 200mM Wild Type BJ5459 Calcium Control Cyclosporin A FK-506 Drug Treatment 4 ug/ml Metabolomics N=9 each condition ESI /APCI- Positive ESI- Negative Proteomics N=4 each condition Mass Profiler Professional
 of 20,000 -- not dependent on spectral acquisition rate Fast data acquisition ( = 10 MS/MS spectra/sec) compatible with UHPLC liquid chromatography Broad mass range from m/z 25 to")
14 Agilent 6530 QTOF and 1260 series HPLC is a Robust Choice for Metabolomics High femtogram-level sensitivity Better than 1-ppm MS mass accuracy Better than 3-ppm MS/MS mass accuracy; Mass resolution (resolving power) of 20, not dependent on spectral acquisition rate Fast data acquisition ( = 10 MS/MS spectra/sec) compatible with UHPLC liquid chromatography Broad mass range from m/z 25 to 20,000.
")
15 Metabolomics Data Acquired using Accurate Mass Retention Time (AMRT) Methodology


16 Consistency in MS Acquisition Methodology is Key For Reproducible Results Between Experiments


17 FK1.d Treatment Positive Negative WT Ca Control FK Cyclosporin A Total

18 Mass Profiler Professional (MPP): Mass Spec Centric Data Analysis Designed for Mass Spectrometry data from multiple platforms Import, store, and visualize Agilent LC/MS TOF, QTOF, and QQQ Agilent GC/MS Quad, QQQ, and QTOF Agilent ICP/MS Agilent CE/MS Generic file format import Data Filtering, Multivariate Statistical Tools and Class Prediction ID Browser for compound identification Pathway Architect for biological contextualization Customizable with R and Python Editors 19 2/13/2014

19 Data Reduction is an Essential Part of Any Omics Experiment All Entities

20 Data Reduction is an Essential Part of Any Omics Experiment Responds to Drug Treatment
21 Correlation-Covariance Plot Can Help Uncover the Most Important Features in PCA Clusters Selected the 23 with the Highest P-Cor and P-Cov scores for PC1 Top 10 shown below Name Formula Score Mass Coenzyme A C21 H36 N7 O16 P3 S Ethyl 3-hydroxyoctanoate O-[glucosyl-(1->6)-glucoside] C22 H40 O Pandamarilactone 31 C19 H25 N O Chenodeoxycholic acid sulfate C24 H40 O7 S Glycinoeclepin B C31 H42 O Lucidenic acid D2 C29 H38 O '(±)-2',4',5,7-Tetrahydroxy-3',8-diprenylisoflavanone' C25 H28 O Biocytin C16 H28 N4 O4 S C55 H48 N8 O28 S C34 H2 N2 O19 S C30 H40 N2 O
22 Compound Annotation is a Critical Challenge in Metabolomics Increasing Annotation Confidence: 1.Database matching using accurate mass measurement Accurate Mass, Retention Time and MS/MS libraries can be searched via Agilent Personal Compound Database and Library and IDBrowser 2.Database matching with isotope pattern matching 3.Database matching with isotope pattern matching and retention time 4.Accurate Mass and MS/MS library matching 5.MS/MS library and retention time matching Confidence Metlin Library has over metabolites and roughly ~8000 have MS/MS spectra. Molecular Structure Correlator software can assist in MS/MS structural confirmation.
23

24 CaCl2 200mM Wild Type BJ5459 Calcium Control Cyclosporin A FK-506 Drug Treatment 4 ug/ml Metabolomics N=9 each condition ESI /APCI- Positive ESI- Negative Proteomics N=4 each condition Mass Profiler Professional

25 Agilent 6550 and Nano-Flow Chip Cube Bring Enhance Sensitivity for Targeted or Shotgun Proteomics High attogram to low femtogram sensitivity Sub ppm mass accuracy (MS) Scan Speeds up to 50 Spectra/s while maintaining 40k resolving power 5 orders of magnitude dynamic range Low injection volumes and nanoflow for enhanced sensitivity for proteomics applications
26 1200 HPLC-Chip Method: 120 min Gradient Parameter HPLC-Chip Autosampler Mobile phase (both pumps) Cap pump (loading) Nanopump Stop time Settings Polaris C-18A, 3 µm, 75 µm x 150 mm analytical and 500 nl enrichment column; Gradient delay reduction: On; IFV = 4 µl; to enrichment at 135 min Injection volume = 2 µl; Autosampler temp = 4 ºC; needle wash in flushport (methanol:water 50:50) for 10 seconds A = 0.1% formic acid in water B = 0.1% formic acid in 90:10 acetonitrile:water 2 µl/min of 3% B Flow rate = 300 nl/min Gradient: Time (min) %B 150 min
27 6550 Q-TOF Method Parameter Ion Mode Source conditions MS MS/MS Settings positive, GHz mode Drying gas 250ºC at 12 L/min; Vcap = 2000 V , 8 spectra/ , 3 spectra/sec Precursor Narrow (~1.3 isolation width); Max precursors = 20; Threshold: 1000 (Abs) and (Rel); Active Exclusion: After 1 spectra, release after 0.25 min; Abundance based ON, Target 25k, MSMS accumulation time limit ON, Time limit OFF, Purity stringency 100%, cutoff 30%; Peptide isotope model; Sort precursors by abundance only, z = 2, 3, >3 Collision energy Used equation based on m/z: for z=2, (m/z* 0.031)+1; for z=>3, (m/z*0.036) 4.8.

28 Spectrum Mill B March 2013
29 Spectrum Mill Workflow For MS/MS Data File_1.d File_2.d File_3.d... File_n.d Raw MS/MS spectra Extraction Filtered MS/MS spectra Database search High scoring spectra Medium scoring spectra Low scoring spectra 30 March 2013
30 Spectrum Mill Workflow For MS/MS: Iterative Approach to Reducing Complex Datasets High scoring spectra Medium scoring spectra Autovalidate Manually validate Validated matches Create.res file containing list of all identified proteins Low scoring spectra Database search spectra not validated Remaining MS/MS spectra Iterative database searches: in homology mode against previous protein hits in identity or homology mode against a different database 31 March 2013
31 Spectrum Mill Protein Database Search Conditions Search engine: Agilent Spectrum Mill Fixed modification: carbamidomethylation of Cys Variable modification: oxidation of Met, deamidation (N) Extraction: no merge, MS Noise TH=200 Database: SwissProt human database (April 2011) Mass tolerances: 20 ppm precursor, 50 ppm product ion Other search settings: Agilent Q-TOF defaults Validation (reporting): auto score adjustment to 1% FDR
 Export results to MPP Injection Protein Group CY CA FK WT Treatments: CY = Cyclosporin A treated CA = Calcium control FK = FK506 treated")
32 Label-free Protein Discovery Results for Yeast Lysates Protein database search in Spectrum Mill Protein-protein comparison in Spectrum Mill groups proteins across the entire set Color coding = abundance (based on EIC of peptides assigned to the protein) Export results to MPP Injection Protein Group CY CA FK WT Treatments: CY = Cyclosporin A treated CA = Calcium control FK = FK506 treated WT = wild type 33 April 2013


33 An ANOVA Analysis Was Used to Determine Peptides Responding to Drug Treatment Blue = Significant Difference in Post-hoc Comparison Orange = No Significant Difference in Post-hoc Comparison Significance Cut-Off= Compounds Pass

34 Calcium Vector Introduces Changes to the Metabolic Profile Versus Wild-Type 204 Compounds had a P-Value of Less Than 0.1 when comparing Calcium Treated Groups and Wild Type.

35 Venn Diagrams Were Used to Determine 93 Metabolites that Uniquely Respond to Drug Treatment in Positive Polarity Protein p (corr) Raw FC vs Control Log FC vs Control Mitochondrial import receptor subunit TOM5 5.85E Ubiquitin-conjugating enzyme E Probable E3 ubiquitin-protein ligase HUL Damage response protein E Protein transport protein sec Phosphatidylinositol transfer protein SFH5 1.03E C-5 sterol desaturase Replication factor A protein Probable 1-acyl-sn-glycerol-3-phosphate acyltransferase ER membrane protein complex subunit


36 Hierarchical Cluster Can Help Uncover Relationships Between Compounds or Protiens Subtree (1)

37 Pathway Architect 12.5: Canonical Pathway Data Mapping and Visualization Central Carbon Metabolism Browse, filter, and search Analyze one or two types of omic data Supports biological pathways from publicly available databases WikiPathways BioCyc Supported formats BioPAX 3 Pathway Commons, Reactome, NCI Nature Pathway GPML PathVisio custom drawing Export compound list from pathways Easy Mining of Complex Pathways for Biological Understanding

38 Agilent-BridgeDB: Enhanced Metabolite and Protein Mapping Metabolites Identifiers more coverage KEGG MetaCyc PubChem LMP HMDB ChEBI CAS Proteins Identifiers: Swiss-Prot UniProt UniProt/TrEMBL Genes Identifiers : Entrez Gene, GenBank, Ensembl EC Number, RefSeq, UniGene, HUGO HGNC, EMBL Resolve the Mapping Problem Between Databases
 WikiPathways: building research communities on biological pathways. NAR doi: 10.")
39 Wikipathways WikiPathways is an open, collaborative platform Kelder T, van Iersel MP, Hanspers K, Kutmon M, Conklin BR, Evelo C, Pico AR. (2011) WikiPathways: building research communities on biological pathways. NAR doi: /nar/gkr1074 Number of Organisms: 13 Public pathways: 1780, Private pathways: 13 Analysis Collection Reviewed manually at Evelo lab GenMAPP Reviewed by Pico/Conklin at UCSF Reactome Reviewed by Reactome consortium Agilent Pathway Architect downloads the database from Wikipathways site

40 BioCyc Pathways Produced by SRI under the direction of Peter Karp BioCyc content Number of species 2037 Curated and computationally derived pathways Tier 1 literature assembled and manually reviewed Tier 2 computationally generated with moderate review Tier 3 computationally generated no review Pathway Architect downloads BioCyc database from Agilent server Pathway Source that has a Large and Deep Species Coverage


41 Pathway Analysis Directed Experiment Experimental Design Biological Relevance / Network Expansion Genes Proteins Metabolites Data Measurement Statistical Analysis Enabling hypothesis-driven experimental design by incorporating prior biological knowledge from multiple measurement technologies

42 Pathway Directed Experiment: Target Protein List Is Exported To Skyline Copy protein accession numbers from Pathway Architect Generate peptide lists and MRM transitions for QQQ MRM using: Spectrum Mill results as a library in Skyline MRM Atlas for yeast 43 April 2013
 and Metabolomics Data 44")
43 Multi-omics Analysis Using Targeted Proteomics (QQQ) and Metabolomics Data 44 April 2013

44 Thank you! 45 April 2013