|
|
|
- Garry Ferguson
- 5 years ago
- Views:
Transcription


1
2


3


4


5
6
7
8
9 Hazard identification Dose-response assessment Exposure assessment Risk characterization In vivo animal experiments Endpoint assays (mortality) Epidemiological studies Environmental monitoring Extrapolation of in vivo animal results to humans Receptors Pathways of exposure Concentration, duration Internal dose Quantitative risk assessment models Chemical characterization Toxicity pathway identification Some targeted animal testing Population context Modeling based on a battery of in vitro assays, systems biology and reverse toxicokinetics Population data Exposure data (biomonitoring and personal exposure monitoring) Biologically relevant health risk assessment

10 Emerging Technologies
11
12


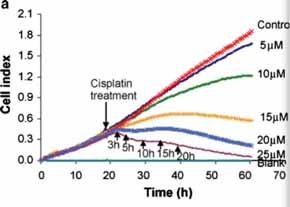
13 0 cell
14
15
&3# %")


16 $ # &/ +0 )&3# %

 Log-5 (RC12) Log +5 (RC12) RC(282) Prediction line (r = 0.67, r 2 = 0.")

 vs KC 50 (mm)_geomean")
17 EC Efficiency EC RATE PLOT OF EC EFFICIENCY BY EC ADOPTATION BY EC RATE EC Adoptation cluster: CLUSTER ONE CLUSTER TWO CLUSTER THREE CLUSTER FOUR CLUSTER FIVE CLUSTER SIX CLUSTER SEVEN logld 50 (mmol/kg) = 0.560xlogKC regression line (r = 0.86, r 2 = 0.74) RC(12) Prediction Line (r =0.87, r 2 = 0.77) Log-5 (RC12) Log +5 (RC12) RC(282) Prediction line (r = 0.67, r 2 = 0.45) Chemical Characterization Toxicity Profiling Hazard Identification Risk Characterization Cell Population Kinetics Cluster Analysis Mode of Action Population Exposure Mutagenicity Assay Chemicals Metabolites HTS Cell Panel Toxic Effect Dose-Response Cytochalasin B - VSMC hr 48 hr hr 96 hr Mean Graph Mean Graph For CytochalasinB VSMC SKNS HEPG BEAS ARPE A In Vitro Dose Reverse Toxicokinetics GHS Classification Exposure Standards; Health Risk Assessment In Vivo LD 50 LD 50 (mmol/kg) vs KC 50 (mm)_geomean in 6 Human Cell Lines Specialized Assays Log 10 concentration (um) log LD 50 Rat (mmol/kg) log KC 50 (mm)_geomean Bioinformatics


18 1. Human exposure standards 2. Prediction of in vivo starting doses 3. GHS Classification of chemicals

19 Cytochalasin B - VSMC hr 48 hr 72 hr 96 hr Toxic Effect Log 10 concentration (um)
20 Cell Line (* Origin Cell Type

21


22
23 PLOT OF EC EFFICIENCY BY EC ADOPTATION BY EC RATE EC Efficiency 2.34 cluster: CLUSTER ONE CLUSTER TWO CLUSTER THREE CLUSTER FOUR CLUSTER FIVE CLUSTER SIX CLUSTER SEVEN EC RATE EC Adoptation -4.99
24 Mean Graph For CytochalasinB Mean Graph For CytochalasinD VSMC VSMC SKNS SKNS HEPG HEPG BEAS BEAS ARPE ARPE A549 A Mean Graph For LatrunculinA Mean Graph For LatrunculinB VSMC VSMC SKNS SKNS HEPG HEPG BEAS BEAS ARPE ARPE A549 A
25
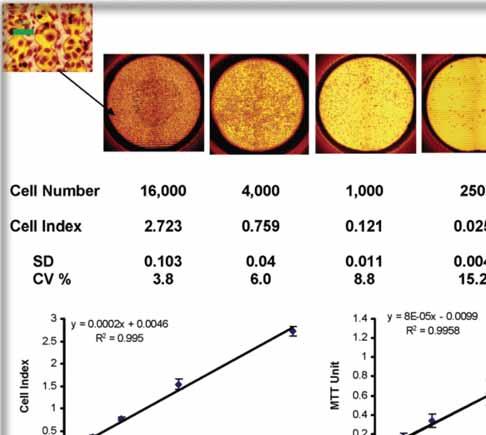
26 Slope Intercept RC-IC NRU RTCA Dose Finding RTCA Definitive RTCA Definitive Measure IC 50 IC 50 KC 50 KC 50 KC 50 Cell Line M HNK 9 Human ACHN HepG2 Geomean Chemical RC (374) % 29% 50% 42% 36% Over-predicted 34% 40% 50% 50% 46% Under-predicted 26% 31% 0% 8% 9% Correlation with LD 50 values ( r ) ACHN r = 0.91, HepG2 r = (*
27 LD 50 (mmol/kg) vs KC 50 (mm)_geomean ean in 6 Human Cell Lines 4 2 log LD 50 Rat (mmol/kg) LD log KC 50 (mm)_geomean logld 50 (mmol/kg) = 0.560xlogKC regression line (r = 0.86, r 2 = 0.74) RC(12) Prediction Line (r =0.87, r 2 = 0.77) Log-5 (RC12) Log +5 (RC12) RC(282) Prediction line (r = 0.67, r 2 = 0.45)

28 Toxicity pathway Molecular initiating event Organelle responses Cellular effects Systems biology Reverse toxicokinetics Receptor binding Ligands Protein adducts DNA adducts Ligand binding Enzyme activity Co-activators Chemical x-actions Gene activation Protein production Signaling Gene mutation Reporter gene Gene expression Biomarkers Injury Stress Apoptosis Autophagy Necrosis Transformation Cytotoxicity Flow cytometry Imaging Point of departure concentration in vitro Acceptable concentration in vitro (µg/l) In vivo human exposure standard (mg/kg/day) Biochemical assays Molecular assays Cellular assays

29
30
31

32


33 Standard Water Toxicity Bioassays

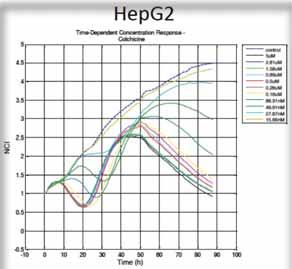
34 Develop and demonstrate the utility of a human cellbased screening assay to assess toxicity of various source waters Introduce a toxicity index to evaluate degrees of toxicity in various types of water TCRC Curve Dose-response Curve Toxicity Heat Map Water Toxicity Index Bar Colormap for Toxicity Index in HepG2 9 8 S1 S2 8 7 S3 7 6 S4 Water Samples S5 S6 S7 S Toxicity Index S9 S S11 S % 60% 40% 30% 20% 10% Concentration 1 0 S1 S2 S3 S4 S5 S6 S7 S8 S9 S10 S11 S12 Water Samples
35 Sorry, the data will be shared once it is published.
36 Sorry, the data will be shared once it is published. once it is
37 Sorry, the data will be shared once it is published.
38 Sorry, the data will be shared once it is published.
39 Sorry, the data will be shared once it is published. once it is
40 Sorry, the data will be shared once it is published.
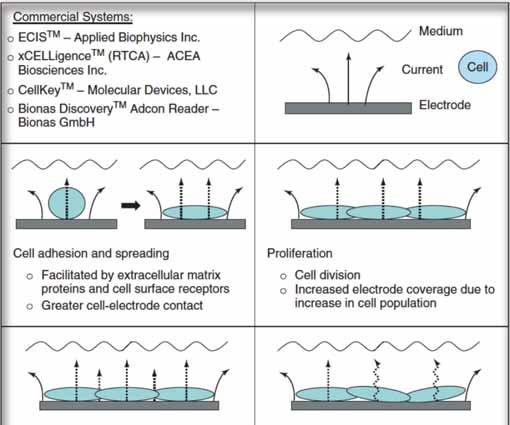
41 Speed (High-throughput screening) Early indication of hazard Human relevance Multiple cell types (Cell panel) Exposure relevance Mixtures Quick evaluation of environmental incidents Cost-effective


42


43
44

45
46

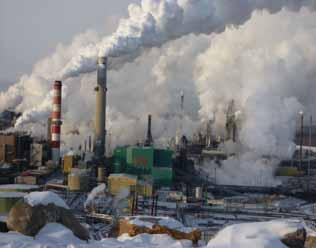
47 Urban dust Diesel exhaust
48
49
 Urban dust")
50 Concentrated air particles (CAPs) Quartz particles (Q66) Urban dust (SRM1649a)


51


52
53
54

55
56
57
58
59

60


61


62