Ballast Water Management Compliance in California: An Eleven Year Perspective
|
|
|
- Chester Greene
- 5 years ago
- Views:
Transcription


1 Ballast Water Management Compliance in California: An Eleven Year Perspective Christopher Brown Marine Invasive Species Program California State Lands Commission MISP Customer Service Meeting August 2015

2 Outline How Compliance is Assessed Brief Intro to GIS Software 11 Years of Compliance Data Overview of Compliance Regulations Questions
 200 NM from land (non-pcr arrivals) 50 NM from land (PCR arrivals) 100 90 80 70 60 50 40 % Retaining % Discharging 30 20 10 0 2004 2005 2006 2007 2008 2009 2010 2011 2012")
3 Ballast Water Management Options Retain all ballast on board/no discharge Discharge to a shore or barge-based reception facility (none currently exist) On board ballast water treatment systems Ballast water exchange (BWE) 200 NM from land (non-pcr arrivals) 50 NM from land (PCR arrivals) % Retaining % Discharging

4 Current California BWE Requirements Ballast Water Exchange Requirements: As of 2006, vessels discharging ballast in CA must manage in accordance with the rules of the Pacific Coast Region (PCR) Arrivals from within PCR, ballast water from within: Exchange >50 nm Arrivals from within PCR, ballast water from outside: Exchange >200 nm Arrivals from outside PCR: Exchange >200 nm There are no exempted commercial vessels (e.g. Domestic oil tankers)

5 Evaluating Compliance Ballast water reporting forms: Forms contain information on source, exchange and discharge locations whether in port or open ocean (Jackie Mackay, next talk) Quality controlled database extending back to 2002 On board ship inspections: 25% of arrivals are mandated to be inspected by SLC inspectors Perform outreach, check ballast logs/management plan, verify exchange locations, test ballast salinity GIS analysis: Evaluates compliance for a large number of vessels Identifies potential underlying reasons for violations Great toolbox for analyzing trends and patterns of very large datasets
6 So, What is GIS? A geographic information system (GIS) is a system designed to: capture, store, manipulate, analyze, manage, and present large amounts of spatial or geographical data.


7 Quarterly GIS compliance analyses are run using ArcGIS 10.2 software Began in 1 st quarter of 2014 Results are used both for informational and enforcement purposes Violation letters are sent to owners and agents of noncompliant vessels

8 In 2014: 1,510 vessel arrivals discharged a total of 9,875 separate ballast water tanks
9 Compliance Evaluation Flowchart Vessel is discharging in CA Vessel not discharging in CA Last Port of Call is Unknown (e.g. Lat/long on land) Last Port of Call is In the Pacific Coast Region (PCR) Last Port of Call is In outside Pacific Coast Region Next Slide Exchange conducted outside of any EEZ No exchange Exchange conducted in any EEZ Exchange No Exchange Exchange location wrong/not known Exchanged outside of any EEZ Exchanged within any EEZ Source location unknown Or wrong Source is within any EEZ Source is outside of any EEZ Exchanged Within the PCR (200 nm) Exchange conducted outside the PCR (200 nm) Source is within the PCR (200nm) Source is outside of the PCR (200 nm) Exchange <50 nm from shore in PCR Exchanged >50 nm from shore in PCR Source is <50 nm from shore in PCR Source is >50 nm From shore in PCR Source is within the PCR Source is outside the PCR Source location is same as discharge location Source location not the same as discharge location
10 Compliance Evaluation Flowchart From Previous Last port of call is outside of the Pacific Coast Region (PCR) Exchange conducted Exchange not conducted Exchange location Is outside of any EEZ Exchange location Is unknown Exchange location Is within any EEZ Source location is outside of Any EEZ Source location Is unknown Source location is Within an EEZ Source location is the same as discharge location Source location is not the same as discharge location
11 Compliance Data
12 Total Discharge Volume Discharged MMT Year Average discharge of 10.5 MMT per year
13 Total Discharge * * * 10.0 Volume Discharged MMT Year Average discharge of 10.5 MMT per year Volume is increasing over time 3 out of last 4 years have seen highest reported discharge amounts since the inception of MISP
14 Tankers and bulk vessels account for 88.7% of the ballast water discharge volume Volume Discharged per Year MMT Avg volume per discharge
15 Compliant vs. Noncompliant Compliant Noncompliant Volume Discharged MMT Compliant discharges Noncompliant discharges PCR
16 Discharge by Vessel Type 4.5 Volume MMT Compliant Noncompliant Auto Bulk Container General Other Passenger Tank Unmanned Barge
17 Millions Compliant Noncompliant % of Discharges that are compliant Since 2009, average compliance rate of 89%
18 3.0 Volume Discharged MMT Exchanged Wrong Location No Exchange PCR

 - Calculates")

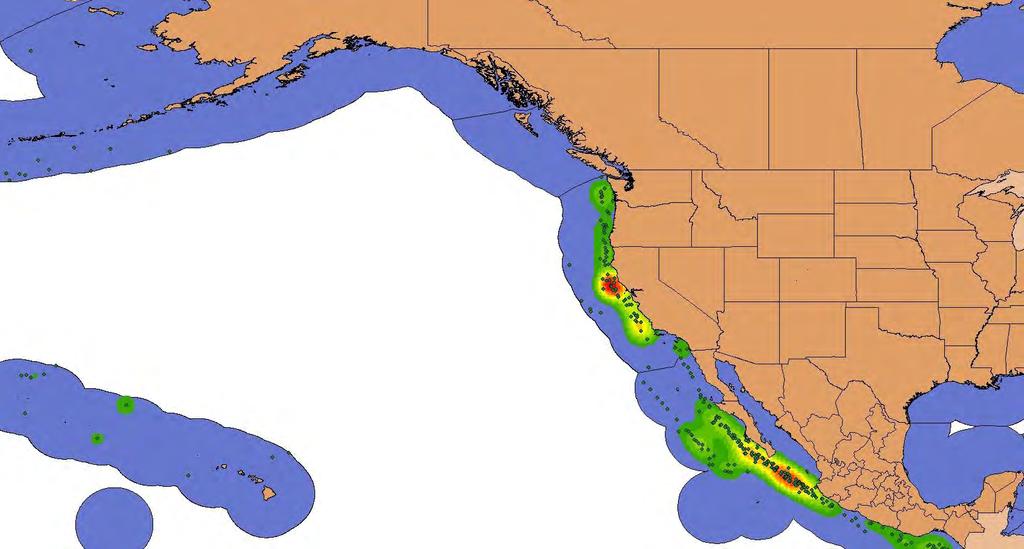
19 Noncompliant Ballast Water Exchange: GIS Where are illegal exchanges concentrated/clustered? What vessels are responsible? ESRI ArcGIS/ArcMap 10.2 Kernel Density Function (Spatial Analyst) - Calculates density of events per unit area Inputs: Point locations of illegal exchanges Search radius: 2 degrees Cell Size: 0.2 degrees Weighted by ballast water discharge volumes
20
21

22

23 Incorrect exchange violations are often due to ships being too close to islands Legal exchange must occur at the proper distance from ANY land Often misinterpreted as distance from mainland coast


24 Volume MT Bulk Tank Container General Other Passenger Auto
25 3.0 Volume Discharged MMT Exchanged Wrong Location No Exchange
26 Unexchanged Ballast Water - Source 2% 4% Cold Temperate East Pacific Warm Temperate East Pacific Tropical East Pacific 47% 43% Cold Temperate West Pacific Warm Temperate West Pacific Western Indo-Pacific Central Indo-Pacific Eastern Indo-Pacific Temperate North Atlantic


27 Unexchanged Ballast Water - Source Tank Bulk Container Passenger General Other Auto
28 Enforcement Regulation
 Amended forms/clerical error/safety - 27")
29 2014 Enforcement Numbers: Total Arrivals 9,345 Discharged 1,510 Vessels with Operational Violations Field Inspections -21 GIS 108 Vessel responses to date 121 (94%) Amended forms/clerical error/safety - 27

30 2014 Enforcement Numbers: Total number of noncompliant tanks < 200 NM 388 < 50 NM 51 Within 10% - 76 Unexchanged 118 Vessels with multiple violations 13 Accounted for 31 occasions and 164 separate tanks
31 CA Public Resources Code section 71216: a person who intentionally or negligently fails to comply with the requirements of this division may be liable for an administrative civil penalty in an amount that shall not exceed twenty-seven thousand five hundred dollars ($27,500) for each violation. Each day of a continuing violation constitutes a separate violation.
32 ARTICLE 4.9: MARINE INVASIVE SPECIES ACT ENFORCEMENT AND HEARING PROCESS Purpose: To classify violations and penalties of MISA and establish policies and procedures CSLC shall undertake in assessing and commencing administrative enforcement actions pursuant to CA PRC section Class 1 (operational) Minor a vessel incorrectly exchanges ballast water within 10% of the limits Moderate a vessel incorrectly exchanges ballast water between 10-50% of the limits Major (I) a vessel incorrectly exchanges ballast water more than 50% of the limits Major (II) a vessel does not exchange water before discharging at receiving port
33 ARTICLE 4.9: MARINE INVASIVE SPECIES ACT ENFORCEMENT AND HEARING PROCESS 2. Class 2 (administrative) Occurs as a result of a vessel failing to properly maintain required documents (e.g. ballast water management plan) on board. 3. Class 3 Occurs as a result of a vessel failing to submit required form (e.g. Ballast Water Reporting Form) in the given time period after receiving official notification Rulemaking anticipated to begin late 2015
34 The Good News! # violations Year-Quarter


35 Questions? Christopher Brown