Developmental Reprogramming in Mesenchymal Stromal Cells of Human Subjects with Idiopathic Pulmonary Fibrosis
|
|
|
- Maryann Owen
- 5 years ago
- Views:
Transcription
1 Developmental Reprogramming in Mesenchymal Stromal Cells of Human Subjects with Idiopathic Pulmonary Fibrosis Diptiman Chanda 1*, Ashish Kurundkar 1, Sunad Rangarajan 1, Morgan Locy 1, Karen Bernard 1, Nirmal S. Sharma 1, Naomi J. Logsdon 1, Hui Liu 1, David K. Crossman 2, Jeffrey C. Horowitz 3, Stijn De Langhe 4, and Victor J. Thannickal 1*


2 Supplementary Figure S1: Protocol for isolation of mesenchymal stromal cells (MSCs) from human subjects with IPF. IPF subjects underwent bronchoscopy with bronchoalveolar lavage (BAL) and recovered fluid subjected to centrifugation and re-suspension of the cell pellet in media prior to plating and ex vivo culture as described in Methods; RNA for Affymetrix analysis was isolated from MSCs at passage 2.
 are shown at serial dilutions.")
3 Supplementary Figure S2: Morphology and mesenchymal phenotype of MSCs. Top panels, MSCs plated from re-suspended cell pellet following BAL fluid centrifugation; colony-forming units (CFU-MSCs; Giemsa stain) are shown at serial dilutions. Lower panels, MSCs display fibroblastoid morphology and uniformly stain for the mesenchymal markers, prolyl-4- hydroxylase and vimentin.


4 Supplementary Figure S3: Mesodermal lineage differentiation of BAL-MSCs obtained from stable and progressive IPF patients. Early passage MSCs were grown in 24-well dishes and cultured in either adipocyte or osteogenic differentiation medium for days. Lipid granules in the adipocytes were visualized with Oil Red O stain (arrows) whereas calcium depositions in the newly formed osteoblasts were visualized with Alizarin Red stain. For chondrogenesis early passage MSCs were pelleted in conical bottom tubes and maintained in chondrogenic differentiation medium for 14 days. The cell pellet was fixed in neutral buffered formalin and stained with Safranin-O to visualize proteoglycans within the newly formed chondrocytes (original magnification 200x).
5 Supplementary Figure S4: Principal Components Analysis (PCA) of gene expression values. PCA was used to visualize the overall structure of the high dimensional data which determines if the replicated samples (stable IPF and progressive IPF) are relatively similar in their gene expression profiles. Based on PCA, sample # 3 and sample # 8 were excluded from gene network analysis.
6 Supplementary Figure S5: Total RNA was isolated from MSCs, isolated from BAL of lung transplant recipients (n=3), stable IPF (n=7) and progressive IPF (n=8), and subjected to realtime PCR analysis for FGF-10. Data were normalized to 18S rrna and represented graphically as fold change compared to stable IPF (s-ipf). FGF-10 gene expression in normal MSCs isolated from lung transplant recipients were significant higher (*p < 0.03) compared to MSCs isolated from BAL of IPF subjects.
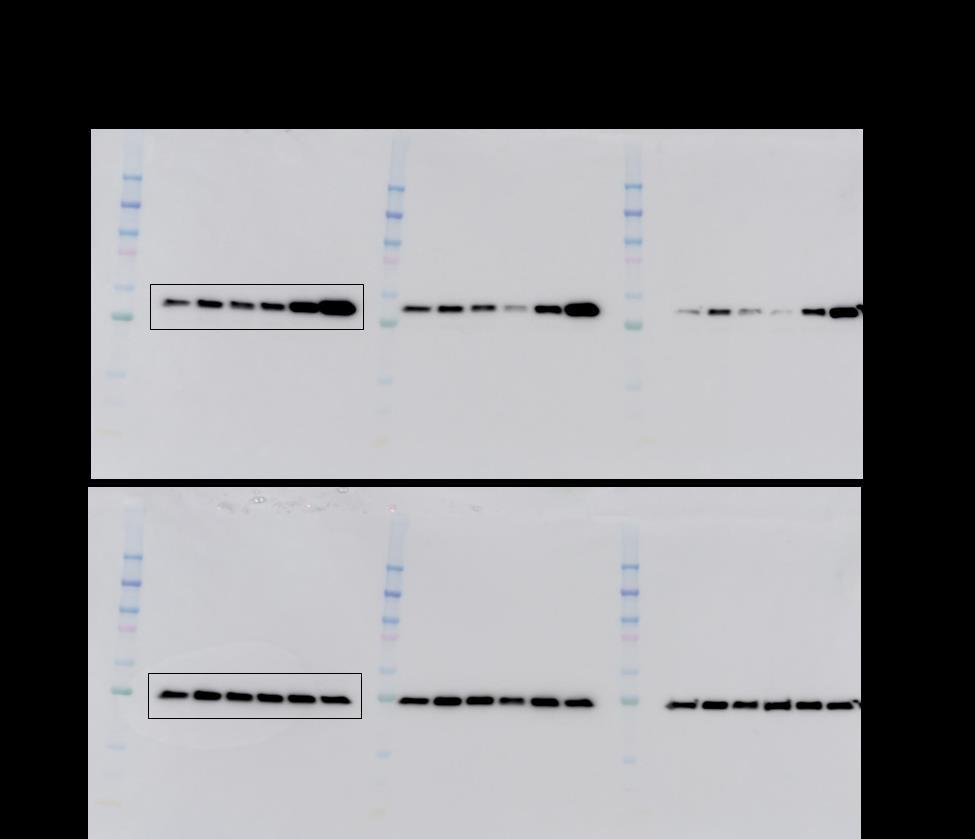
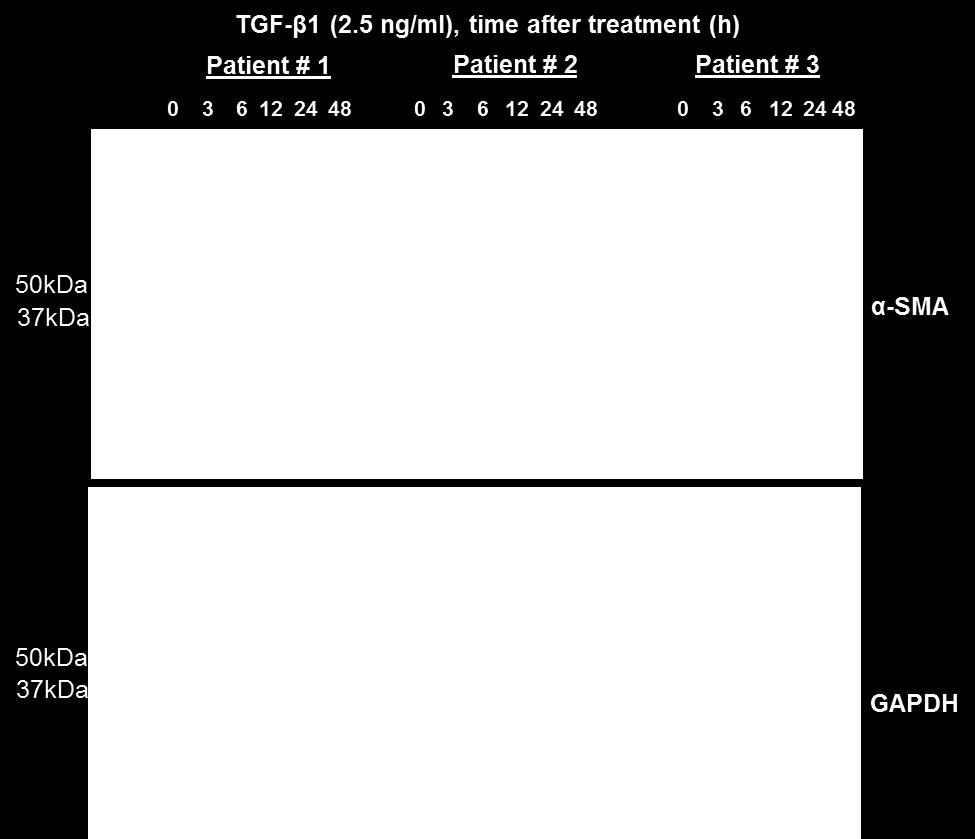
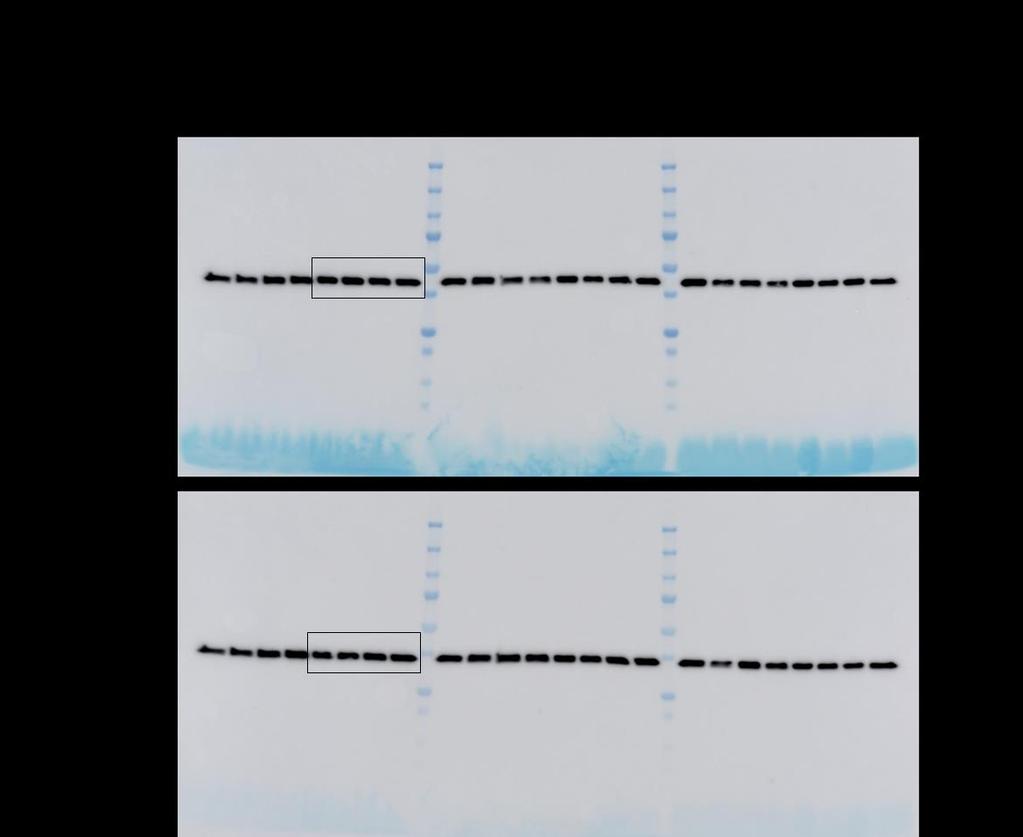

7 A B
8 Supplementary Figure S6: Effects of TGF-β1 (A) and SHH (B) on myofibroblast differentiation of BAL-derived MSCs. MSCs were isolated from surveillance bronchoscopies and BAL from lung transplant recipients without bronchiolitis obliterans or infection. MSCs were seeded in 6-well tissue culture plates and serum deprived for 24 h followed by either TGFβ1 treatment (2.5 ng/ml) or SHH (0, 50, 100, 500 ng/ml) for 48 h. Cell lysates were prepared in RIPA buffer and subjected to SDS-PAGE and western blot analysis for α-sma; GAPDH antibody was used as loading control. The protein bands outlined here are presented in Figure 4 A&B. Densitometry was performed to quantitate the ratio of α-sma and GAPDH and plotted graphically (n = 3).
 sections were obtained from normal (n=4; failed donor lungs) and IPF (n=4; explants during lung transplantation) lungs.")
9 Supplementary Figure S7: Immunofluorescence staining for vimentin and FGF-10 in normal and IPF lungs. Six micron (6µ) sections were obtained from normal (n=4; failed donor lungs) and IPF (n=4; explants during lung transplantation) lungs. In IPF lung tissue, FGF-10 expression was observed in the interstitial mesenchymal cells in regions with less fibrotic remodeling. FGF-10 expression in these cells also co-localized with MSC marker, vimentin. Although vimentin expression was detected in the interstitial mesenchymal cells in normal lungs, FGF-10 expression was largely undetected in normal lungs. IgG isotype controls were used to determine specificity of the FGF-10 and vimentin antibodies (Original magnification X400).

10 Supplementary Table S1: Gene ontology networks identified by ingenuity pathways analysis. Total RNA was isolated from MSCs from s-ipf and p-ipf and transcriptomic analysis performed by Affymetrix arrays. Genes that were significantly up-regulated or down-regulated (n = 3 in each group; 2-fold change, p < 0.005) were subjected to ingenuity pathway analysis (IPA). The top functioning networks, related IPA score for each network and the specific network genes that were either up- or down-regulated are shown. The score is based on a p- value calculation that defines the likelihood that network eligible molecules that are part of the network are found therein by random chance alone. Depicted in bold are developmental genes (FGF-10, BMP-4, Meox2 and HoxA2) that were selected for further analysis.
11 Gene Name and Accession Number FGF-10 NM_ BMP-4 NM_ Meox2 NM_ HoxA2 NM_ S rrna X Primer Sequence (5-3 ) Product Size (bp) Annealing/ Extension Temperature (ºC) Forward ATGTCCGCTGGAGAAAGCTA Reverse CCCCTTCTTGTTCATGGCTA Forward TGATACCTGAGACGGGGAAG Reverse CCAGACTGAAGCCGGTAAAG Forward TCTCACCAGACTGAGGCGAT Reverse TTGCTGTCCACCCTTTACCC Forward TTCAGCAAAATGCCCTCTCT Reverse TAGGCCAGCTCCACAGTTCT Forward GTCTGCCCTATCAACTTTCG Reverse ATGTGGTAGCCGTTTCTCA Supplementary Table S2: List of PCR primers used in this study and conditions