Biological Indicators and Their Application in Clinical Sterilization Spores Don t Lie 1
|
|
|
- Isaac Jacobs
- 5 years ago
- Views:
Transcription
1 Biological Indicators and Their Application in Clinical Sterilization 2010 Spores Don t Lie 1

2 SGM Biotech, Inc. 10 Evergreen Drive, Suite E Bozeman, MT Tel: Fax: info@sgmbiotech.com Web: A Global Company 2
 Buenos Aires,")

3 ST-Pack S.R.L. Llerena 3192 (C1427DEP) Buenos Aires, Argentina Tel: Fax: Web: June
4 We make too many assumptions about sterilization processes. 4
5 Every time we make an assumption about a sterilization process we are setting ourselves up for failure. It s not if but when. 5
6 Why is this? It takes too much time It costs too much money We don t really understand the risks we are taking 6
7 We are asked to make decisions. The more knowledge we have the better judgment decisions we make. 7
8 This seminar is designed to enhance your knowledge and understanding about sterilization and the use of biological indicators. 8
9 There are many scientists and engineers that underestimate the value of the use of bacterial spores in monitoring the sterilizing process. 9
10 We have three levels of evaluation of a sterilization process effectiveness. 10
11 Physical measurements Chemical measurements Biological measurements 11
12 Definitions From ISO 11139:2006 Biological Indicator test system containing viable microorganisms providing a defined resistance to a specified sterilization process 12
13 Biological indicators are not immediate, they require time for incubation of the viable microorganisms so we can determine if they have survived the process. 13
14 Physical measurements are the only way to calculate a sterility assurance level for any sterilization process. 14
15 A biological measurement is the only way to demonstrate that a sterilization process was effective. 15
16 We use bacterial endospores (spores) to measure the effectiveness of the sterilization process. 16
17 Why? 17
18 Spores are the most resistant life forms to sterilization processes Spores are stable Spores are predictable Spores are consistent 18
19 Spores The only tool available to integrate all critical process parameters whether known or unknown. 19
20 When the spores are killed the process is acceptable. 20
21 When the spores survive the process is not acceptable. 21
22 What is a catastrophic sterilization failure? A positive BI when all physical measured parameters meet their specified values 22
23 The bacterial spore is the only device that is available to pick up a catastrophic failure in the process. 23
24 When a catastrophic failure occurs, there is a high probability that non-sterile goods are in the load. 24
25 Physical measurements are necessary, but they can t detect catastrophic sterilization failures. BIs tell you when a cycle fails (positive BI). When a BI doesn t grow (negative) we assume it was killed. BI results are available between 3 and 10 hours. BIs are the most accurate determiners of acceptable sterilization. International standards have verbally eliminated outliars and rogue spores. BIs annual expense is much less than the cost of one hospital acquired infection. 25
26 When we remove the bacterial spore from the process monitoring data we lose the ability to detect catastrophic process failures. 26
27 So why aren t BIs always used? Perception is: Physical measurements are more accurate and more dependable BIs are the messengers of bad news (positive BIs) BIs take too long to provide a result BIs are not dependable BIs have rogue spores BIs have outliars BIs cost a lot of money 27
28 More complex processes should require greater use of BIs. 28
29 Processes that are not well understood should require greater use of BIs. 29
30 Why BIs work and instruments don t always work. 30
31 Temperature Dissection of a Sterilization Cycle Temperature Set Point Start ALL BIs Survive ALL BIs Killed End Exposure Time 31
32 Temperature Dissection of a Sterilization Cycle Most common way to develop a cycle is the half cycle approach Temperature Set Point Start ALL BIs Killed End Time 32
33 Temperature Temperature Set Point F 0 Biological Measurements ALL BIs Killed Physical /10 1/100 Measurements 1/10,000 1/1,000,000 1/1,000 1/100,000 Time Spores per BI ALL (+) BIs Probability of a Positive BI Probability of a Non-Sterile Unit (PNSU) F/N ALL (-) BIs 33
34 Temperature If BI is Positive in a Validated Cycle Temperature Set Point Start Lethality Zone for a Positive BI ALL (+) BIs Minimum Loss of Lethality to Observe a Positive BI F/N ALL BIs Killed ALL (-) BIs End Parametric Sensitivity Time 34
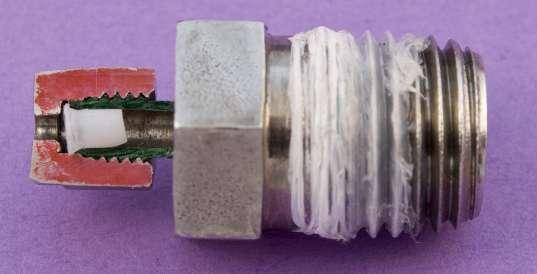
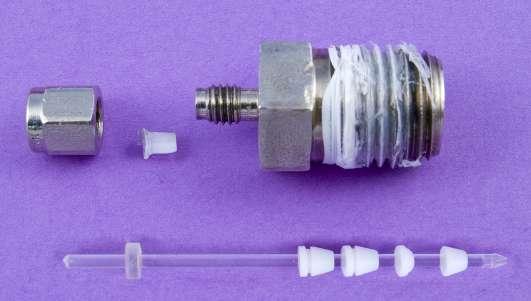
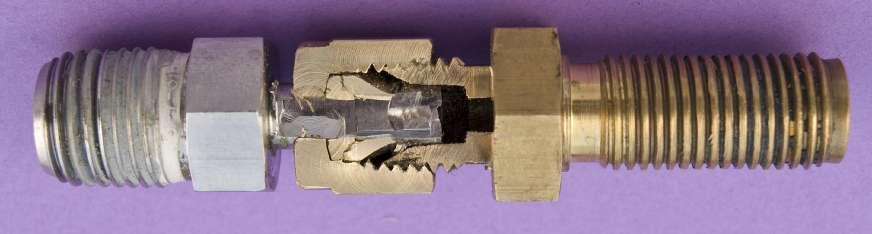
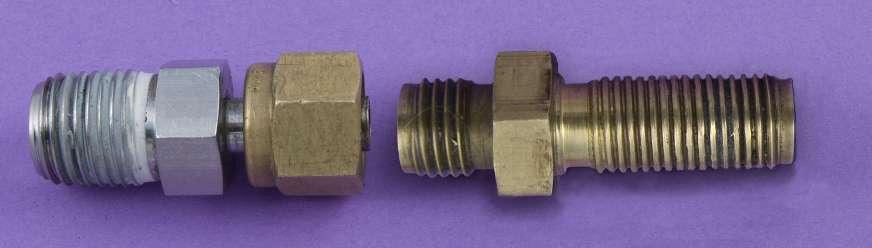
35 Temperature Sensitivity of Parametric Measurements Temperature Set Point Lethality Loss ½ cycle Time Parametric Sensitivity 35
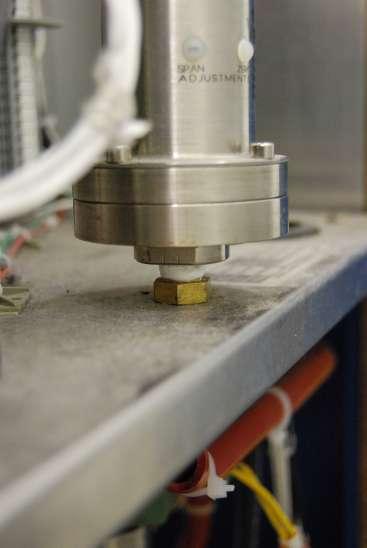
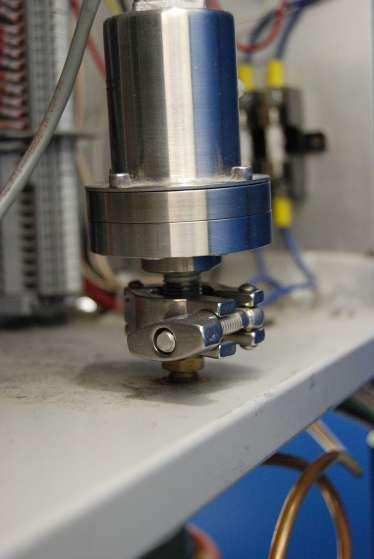
36 We all know that residual air creates problems in steam sterilizers. *Bowie & Dick test used daily. 36
37 Temperature Sensitivity Positive BI in of Air Parametric Pocket (steam Measurements process) or Positive BI in Low Moisture Area (EtO process) Temperature Set Point Actual Lost Lethality (90%) Lethality Loss /10 1/100 1/10,000 1/1,000,000 1/1,000 1/100,000 Parametric Sensitivity Time 37
38 Summary Process failures are easily identified when parametric measurements are not within specifications. Parametric measurements are necessary to support Sterility Assurance Levels (SAL). Biological Indicators are only capable of identifying catastrophic sterilization failures. If BIs are not used you will not be able to identify these catastrophic failures. Any process that does not use both (parametric and biological) measurements is inadequate. 38
39 In an adequate sterilization cycle all spores are killed and BIs test negative Sterilization failure results in surviving spores 39
40 If you don t use BIs for routine monitoring, you have no means of detecting a catastrophic failure. 40
41 When a catastrophic failure occurs with a BI, there is a high probability that you have non-sterile goods. 41
42 Identifying Causes of Sterilization Failures 42
43 Steam Sterilization Failures Load configuration Product/product container changed Poor air removal Steam trap failure Gasket failure Check valve failure Pipefitting leaking (all possibilities) Vacuum pump wearing 43
44 44
45 45
46 46
47 47
48 Steam Air is the most common cause for failure 48
49 EO Sterilization Failures Load configuration changed Product changed Product package changed Poor humidification Check ambient temperature and humidity Check preconditioning Check cycle phase change rates Check chamber leak rate Check chamber vacuum rate Warmer than normal process temperature Pallet wrapping Product master cartons (general corrugate) 49
50 EO Humidity (moisture) is the most common cause for failure 50

51 Revolutionizing sterilization monitoring Introduces Smart-Read TM technology 51
52 Sterilization is a process that renders a product or material free from living microorganisms 52
53 Sterilization can not be expressed only as time and temperature 53
54 Sterilization is not as simple as 121 C for 15 minutes or 132 C for 4 or 10 minutes 54
55 Sterilizing items in hospitals and clinics is becoming more complicated because of advances in medical instruments and supplies 55
56 A new biological indicator monitoring system that will simplify your sterilization monitoring program is now available 56
57 Smart-Read EZTest Biological Indicator Monitoring System 57
58 Smart-Read Technology Smart-Read EZTest biological indicators are positioned in the load according to facility procedure 58
59 59

60 60
61 61
62 62
63 63

64 Retrieve exposed Smart-Read BIs from the load 64
65 Smart-Read Technology The biological indicator is the only tool capable of integrating all critical process parameters. Steam temperature Pressure Exposure time Presence of trapped air It is recommended to use a minimum of one Smart-Read EZTest BI per cycle to guarantee greatest assurance of sterility 65
66 This TRUE biological indicator monitoring system rapidly detects ONLY spore growth 66
67 67
68 Use the Smart-Read BI as you would use any other self-contained BI 68
69 Smart-Read does NOT rely on a correlated chemical or enzyme result to predict microbial activity 69
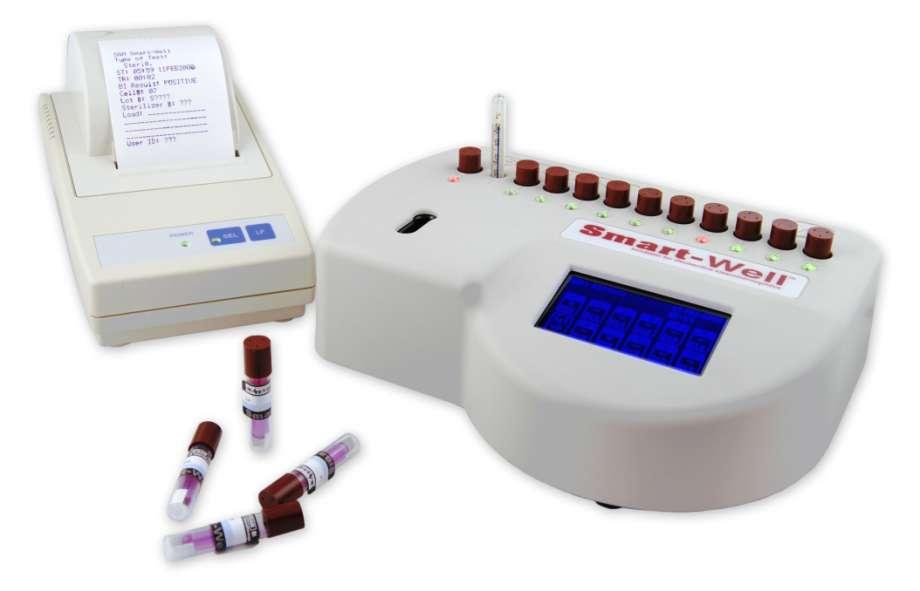
70 Smart-Read EZTest Biological Indicator Monitoring System Smart-Read EZTest biological indicator Smart-Well incubator kit includes: Smart-Well incubator Printer Thermometer Record book Stylus Power packs and system manual 70
71 Smart-Read EZTest Biological Indicator Monitoring System Smart-Read EZTest biological indicator Smart-Well incubator kit includes: Smart-Well incubator Printer Thermometer Record book Stylus Power packs and system manual 71


72 Smart-Read EZTest Biological Indicator Monitoring System Smart-Read EZTest biological indicator Self-contained BI with Geobacillus stearothermophilus spores ONE indicator for all cycle types and temperatures 121 to 135 C Pre-vacuum Gravity Flash 72


73 Smart-Read EZTest Biological Indicator Monitoring System Smart-Well incubator kit includes: Smart-Well incubator Ten incubation cells for exposed BIs and one for positive control Each cell has dedicated electronics to continuously monitor BI status Crushing cavity to activate BI Touch sensitive screen with stylus for ease of user programming 73
74 Always Printed User Programable Printer receives signal from Smart-Well and documents the exact time the positive result was obtained Record includes: Incubation start time/date Hours of incubation elapsed BI test result (positive/negative) Incubation cell number Cycle type BI Lot number Sterilizer ID number User ID number 74

75 Printer Printer receives signal from Smart-Well and documents the exact time the positive result was obtained The rapid detection of biological growth is 100% visually verifiable by the operator 75
76 Results are: 100% Accurate 100% Reliable 100% User Verifiable The Smart-Well incubator detects true biological activity 76
77 Potential outcomes when chemical/enzyme methods are correlated to biological results: Chemical/enzyme reaction: 1) Predicts sterility / spores grow (false-negative) 2) Predicts sterility / spores do not grow 3) Predicts sterilization failure / spores grow 4) Predicts sterilization failure / spores do not grow (false-positive) 77
78 With Smart-Read Biological Indicator Monitoring System, the rapid reaction IS the biological activity Results are either: 1. Positive BI indicates sterilization failure 2. Negative BI indicates adequate sterilization 78
79 Definitions From ANSI / AAMI / ISO 14161:2000 Sterile free from viable microorganisms Sterilization validated process used to render a product free from viable microorganisms 79
80 Definitions From ISO 11139:2006 Chemical Indicator, non-biological indicator system that reveals change in one or more predefined process variables based on a chemical or physical change resulting from exposure to a process 80
81 Definitions From ISO 11139:2006 Biological Indicator test system containing viable microorganisms providing a defined resistance to a specified sterilization process 81
82 Definitions From U.S. FDA 510(k) for Biological Indicators, Draft Guidance Biological Indicator Device intended for use by a health care provider to accompany products being sterilized through a sterilization procedure and to monitor adequacy of sterilization. (continued) 82
83 Definitions From U.S. FDA 510(k) for Biological Indicators, Draft Guidance The device consists of a known number of microorganisms, of a known resistance to the mode of sterilization, in or on a carrier and enclosed in a protective package. (continued) 83
84 Definitions From U.S. FDA 510(k) for Biological Indicators, Draft Guidance Subsequent growth or failure of the microorganisms to grow under suitable conditions indicates the adequacy of sterilization. 84
85 Definitions From U.S. FDA 510(k) for Biological Indicators, Draft Guidance The FDA Guidance Document specifies Exclusions: This document does not provide information on enzyme-type chemical indicators, also known as rapid readout indicators. (continued) 85
86 Definitions From U.S. FDA 510(k) for Biological Indicators, Draft Guidance Although some enzyme-type chemical indicators are incorporated into devices that also contain a biological indicator, the results of enzyme-type chemical indicators are read separately from (and typically before) the spore growth reading. 86
87 Sterile, Sterilization, and Biological Indicator all contain the words viable microorganisms in their definition 87
88 Smart-Read system: IS a biological system that rapidly detects spore growth readings 88
89 Smart-Read Technology Use crushing cavity in Smart-Well incubator to activate Smart-Read BIs Insert Smart-Read BI into a Smart-Well incubation cell 89

90 Smart-Read Technology 90
91 Temperature Dissection of a Sterilization Cycle Most common way to develop a cycle is the half cycle approach Start Total Cycle Lethality ½ - Cycle Lethality Temperature Set Point End Time ALL BIs Killed 91
92 Temperature Positive BI due to Trapped Air in Steam Process Temperature Set Point Actual Lost Lethality (90%) from trapped air Total Cycle Lethality ½ cycle /10 1/100 1/10,000 1/1,000,000 1/1,000 1/100,000 Instrument Sensitivity Time 92
93 Biological & Physical Release Biological Indicators identify catastrophic sterilization failure Physical measurements are necessary to support Sterility Assurance Levels (SAL) Both physical and biological measurements are necessary Any process that does not use both measurements is inadequate 93
94 A sterilization failure occurs when the first positive BI is detected A positive BI is a catastrophic cycle failure 94
95 Why? Cycles are designed to kill all BIs and include an additional safety factor The failed sterilization cycle must lose a significant portion of the cycle lethality where the BI is intended to survive 95
96 Summary of Smart-Read EZTest Biological Indicator Monitoring System The Smart-Read Biological Indicator Monitoring System provides rapid biological detection of failed sterilization cycles 96
97 Summary of Smart-Read EZTest Biological Indicator Monitoring System User convenience: Once incubated, no additional manipulation at specific timed intervals 97
98 Summary of Smart-Read EZTest Biological Indicator Monitoring System Automatic printed documentation 98

99 Summary of Smart-Read EZTest Biological Indicator Monitoring System Easy to peel unit label can be attached to printed document 99
100 Summary of Smart-Read EZTest Biological Indicator Monitoring System ONE indicator for all steam cycle types and temperatures 100
101 Summary of Smart-Read EZTest Biological Indicator Monitoring System The Smart-Read BI rapidly detects failures using true biological results to allow resterilization of the load 101
102 These results allow timely re-sterilization of the load 102
103 Rapid Biological Detection by Smart-Well Incubator 10 hours Meets U.S. FDA Reduced Incubation Time Protocol for sterile product release 103
104 Summary of Smart-Read EZTest Biological Indicator Monitoring System NO False Negatives NO False Positives 104
105 Summary of Smart-Read EZTest Biological Indicator Monitoring System Results are 100% User Verifiable 105
106 Summary of Smart-Read EZTest Biological Indicator Monitoring System Releasing materials based upon biological results provides the greatest assurance of sterilization 106
107 Reduced Incubation Time USFDA (RIT) Protocol 100 units per test Perform test 3 times (3 different lots) Achieve fractional exposure At least 30/100 survivors No more than 80/100 survivors Read results daily up to 7 days When 97% of BI s read same as 7 days you have achieved the reduced incubation time 107

108 Survivor Curve RIT Zone Sterilizing Value, Minutes Probabilistic Zone (No biological measurements) 108
109 RIT Protocol No more than 80/100 positives OR at least 20 sterile BIs No less than 30/100 positives OR no more than 70 sterile BIs 109
110 The more spores present on the BI the faster a positive sample will be detected 110
111 # of Positive Units Positive Controls (10 5 spores/bi) Incubation Time Data 3 Positive Controls (10 5 ) 0 Time 111
112 # of Positive Units Sub-lethal exposed units between 10 4 and 10 2 spores/bi Data 4 Positive Controls Sublethal Exposure (10 5 ) ( ) 0 Time 112
113 # of Positive Units Sub-lethal exposed units between 10 1 and 10 0 spores/bi Positive Controls Sublethal Exposure 1-10 Spores (10 5 ) ( ) ( ) Time (Hours) 113
114 # of Positive Units Quantal zone (FDA RIT Protocol) between 30 to 80 positive BIs per 100 tested (10 5 ) ( ) Positive Controls Sublethal Exposure 1-10 Spores ( ) 30-80% (+) FDA RIT Protocol Time (hours) 114
115 Time to Positive Incubation Test Geobacillus stearothermophilus Time To Positive Incubation Test Positive Controls 3:12 Mean Time to Positive in White Sublethal Exposure 3:49 Mean Time to Positive in White 1-10 Spores 5:16 RIT 6: Time (hours) 115
116 # of Positives All data to date fits this picture when media is controlled Data 8 (10 5 ) ( ) Positive Controls Sublethal Exposure (+) FDA RIT Protocol Time 7 Days 116
117 Lethality Maps 117

118 118

119 Kaye Validator 2000 Thermocouple Data Acquisition System 119
120 Maps Use F O Calculated From Each Thermocouple Location 120
121 Lethality Map Flat Surface Display 9% Thermocouple Density Run 1 Run 2 Run 3 Run 4 Run 5 Run 6 Run 7 Run 8 Run 9 121
122 When BI s are individually dispersed throughout the load, there is a good chance each BI is exposed to different conditions and therefore a replicate of one 122
123 Random BI Distribution BI BI BI BI BI 123
124 Cluster BI s in the areas documented to be worst case 124
125 Cluster BI Distribution BI s 125
126 Hospitals typically lack the equipment and skilled personnel to perform this classical validation. 126
127 Biological validation is the next best approach. 127
128 Use biological indicators to identify worst case location in the sterilizer. 128
129 Prepare typical loads to be used in these tests. 129


130 Mixed Load All-textile Load Wrapped Instrument Load: Perforated or wire-mesh bottom trays Loading paper/plastic peel-down packaging, using wire-type baskets to keep the packages in position 130
131 Place two BI (replicates) into your best estimate location as the worst-case in each pack. 131
132 Document the loading pattern. Document contents or each pack and where the two BIs are located. 132
133 Perform Abbreviated Cycles Shortest cycle expected results = all BIs (+) Longer cycle expected results = some packs all BIs (+); some packs all BIs (-) Longer cycle than above expected results = all BIs (-) Double the above cycle time, use only packs and locations that showed the last to die BIs; place 2 BIs in this pack Expected results = worst case pack all BIs (-) Repeat this test three times 133
134 Temperature Dissection of a Sterilization Cycle Most common way to develop a cycle is the half cycle approach Temperature Set Point Start ALL BIs Killed End Time 134
135 Repeat this series of tests with each different load configuration you have identified. 135
136 Spores Don t Lie 136