Use of Host Specific Fecal Indicator Bacteria Microbial Source Tracking Data to Suggest Remediation Efforts in Withers Swash, Myrtle Beach, SC
|
|
|
- Jonah McDaniel
- 5 years ago
- Views:
Transcription


1 Use of Host Specific Fecal Indicator Bacteria Microbial Source Tracking Data to Suggest Remediation Efforts in Withers Swash, Myrtle Beach, SC J. Michael Trapp, Susan Libes, Erin J. Burge, Janet Wood, Amanda Sturgeon, and Saalem Adera 04/25/13
2 Microbial Source Tracking Pathogen Contamination What is it? Where is it coming from? Who is making it? How can we address it?


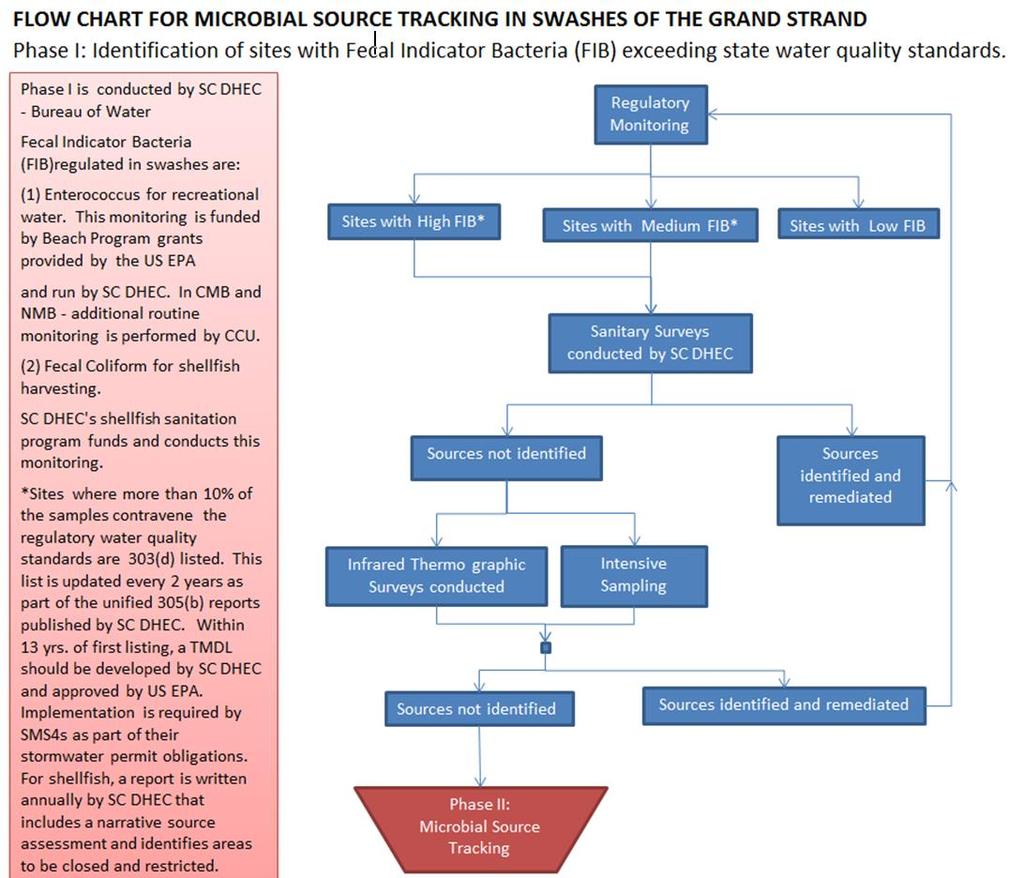
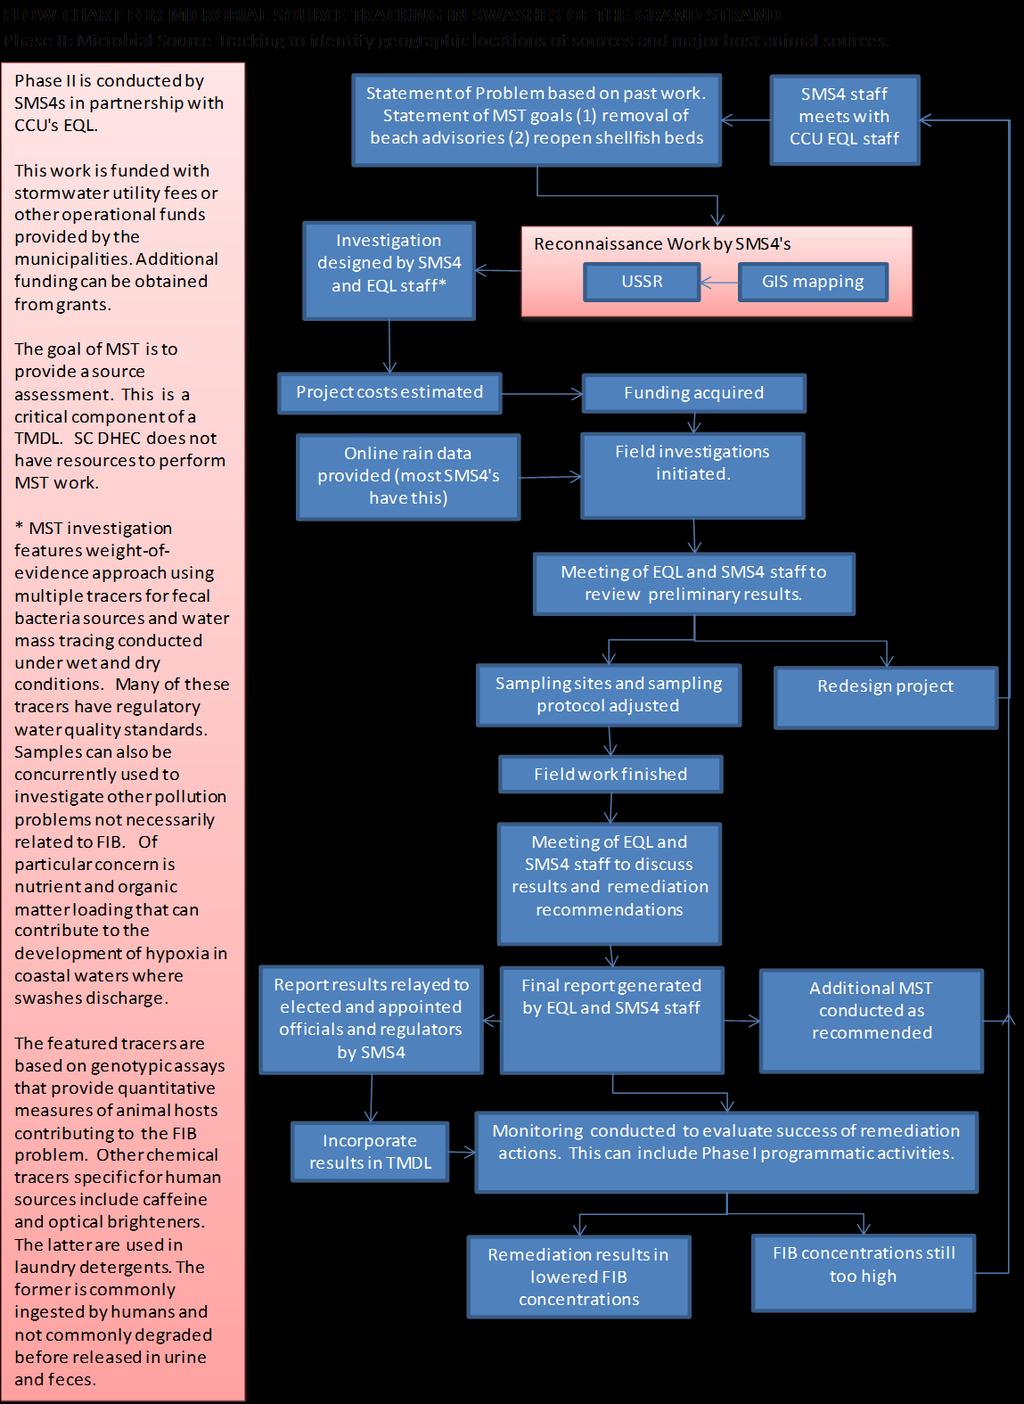
3 Tiered Approach Weight of Evidence Microbial Source Tracking Intensive sampling using standard FIB measurements; Infrared thermography Sanitary Survey Identification of impaired areas based on long-term monitoring


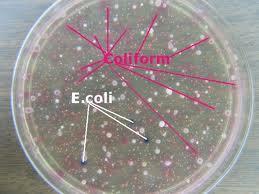
4 Traditional Culturing Methods
 markers Method A targets Enterococcus Method B targets")
5 EPA Rapid Methods Quantitative Polymerase Chain Reaction (qpcr) 16S ribosomal RNA (16S rrna) markers Method A targets Enterococcus Method B targets Bacteroidales
6

7 qpcr in Microbial Source Tracking 16S rrna gene found in nearly all bacteria and Archaea Small changes in genes allow for identification of hosts qpcr allows for quantification of specific host inputs
8 qpcr Basics Low detection limit Pro: very sensitive Con: low levels are not likely to be health risks Detects living and dead cells Pro: conveys source information Con: might be outdated source information Can detect lots of sources Pro: potentially unlimited host tracking ability Con: each host detection requires a separate assay Provides quantitative information Pro: enables evaluation of relative contribution of host animals Con: requires innovative calibration work


9 Year One- Method Validation
10 Year Two Pilot Project: Withers Swash Source Tracking Strategies Space and Time Targeted wet and dry weather sampling Tracers Bacteria concentrations Chemical concentrations Water mass indicators Optical brighteners Caffeine Host animals Multiple antibiotic resistance of fecal bacteria Genetic markers of fecal bacteria
")
11 Illicit Discharge Detection and Elimination: A Guidance Manual for Program Development and Technical Assessments (CWP and Pitt, 2004)


12 Sampling 2 dry 3 wet First flush sampling Nalgene stormwater sampler Hobo

13 Site-Specific Storm Hydrographs Hobo water level loggers Figure : Hydrograph showing the response to a rain event at Site 1 as recorded by an insitu Hobo water level 13 logger.
14 Figure : Concentration of Enterococcus (MPN/100 ml) as a function of sampling site. Black circles represent dry samples and white circles represent wet samples.

15 Figure : Enterococcus concentrations (MPN/100 ml) in Withers Basin sub-watersheds.
16 Figure : Enterococcus and E. coli concentrations
 in Withers Basin sub-watersheds.")
17 Figure : BacHum concentrations (genome copies/100 ml) in Withers Basin sub-watersheds. Results below the reporting limit are in the dark green-shaded grouping.
 in Withers Swash")
18 Figure : BacCan concentrations (genome copies/100 ml) in Withers Swash subwatersheds. Concentrations grouped into quartiles.
19 Weight-of-evidence approach using indices By Parameter Data grouped into quartiles with the bottom bin set at regulatory threshold Each data group assigned an integer value aka a grade Table : Concentration ranges used to assign rank orders to E. coli and Enterococcus concentrations. These values were used to create Table


20 Weight-of-evidence approach using indices By Parameter By Site Each parameter assigned a grade Parameter grades summed to determine site grade Averaged Wet vs Dry Averaged Overall Table Fecal Indicator Bacteria (E. coli + Enterococcus) Grades


21 Weight-of-evidence approach using indices By Parameter By Site Visualizing sites to prioritize for remediation Color coded matrixes Qualitative rankings Table : Qualitative descriptors


22 Weight-of-evidence approach using indices By Parameter By Site Visualizing which sites to prioritize for remediation Color coded matrixes Qualitative rankings Every site with a very strong detection of FIB had a strong or very strong detection for at least one of the qpcr assays Table : Summary of the results of the qualitative descriptors for regulatory FIB and qpcr markers. Sites with very strong qualitative rankings are in red font.


23 Table : Sites with strong and very strong levels of BacHum concentrations. Percentages determined by dividing the average rank order by the maximum rank order for each tracer. Percentages greater than 50% are shaded red. Table : Sites with very strong levels of BacCan. Percentages determined by dividing the average rank order by the maximum rank order for each tracer.
24 Table : Sites with strong evidence for either human or canine sourced Bacteroides.
25
26
27 Watershed Assessment Report and Appendices available at:


28 Thank you to our Partners
 in Withers Basin")
29 Figure : GenBac concentrations (genome copies/100 ml) in Withers Basin sub-watersheds. Concentrations are grouped into quartiles.
30 What we want our MST data to be Sources of bacterial pollution in Withers Swash Universal (GenBac) Wildlife Human (BacHum) Dog (BacCan) Goose (CGO-1F)
31 What our MST data actually are Goose (CGO-1F) Wildlife Dog (BacCan) Universal (GenBac) Human (BacHum) Sources of bacterial pollution in Withers Swash