The Middle East. 15 Countries*, 5 Time Zones. Population > 333 millions** GDP: $3.13 Trillions*** 58% of world oil reserves
|
|
|
- Jean Bailey
- 5 years ago
- Views:
Transcription
1 Pharmaco-Economical Overview of Healthcare Omar Rifi, R.Ph., M.B.A. January,


2 The Middle East 15 Countries*, 5 Time Zones Population > 333 millions** GDP: $3.13 Trillions*** 58% of world oil reserves Sources: US Bureau of the Census (2011 mid-year estimate) CIA Factbook (2010 est.) *not counting south Sudan **3 rd behind China, India. Ahead of US, Indonesia **Larger today than Brazil + Korea in 2020 ***5th behind US, China, Japan, India ***3 X Turkey, >3/4 India -2-
3 The Middle East: Current Political Environment Wave of revolutionary democracy, the extent of which is still unknown Anti-government protests likely to continue People calling on governments to become more responsive, more open, and more accountable Protests focus on legal, political, and economic issues (corruption, low wages, high unemployment) -3-
4 Per Capita Spend on Healthcare The Middle East: Countries Overview Two main types of countries economically & demographically: Large populations, Low income, Low spend on healthcare $3,500 $3,000 $2,500 Gulf countries off the chart Qatar Small populations, High income, High spend on healthcare $2,000 $1,500 UAE $700 $600 Relative bubble size reflects total population Lebanon Saudi $1,000 Kuwait Bahrain $500 $25,000 $45,000 $65,000 $85,000 $500 $400 Libya Oman $300 Jordan $200 $100 Yemen $0 Egypt Syria Iraq Sudan Iran $0 $5,000 $10,000 $15,000 $20,000 GDP per Capita -4- Source: WHO website 2008/2009 estimates
5 The Direct Value of Healthcare Investment From 1980 to 2000 each additional dollar spent on healthcare in the U.S. produced tangible health gains valued from $2.40 to $3.00 Significant health gains during the same period: 16% decline in annual mortality rates 25% decline in disability rates for those over 65 yrs of age 4% increase (2.3 yrs) in life expectancy from birth 56% decline in number of days spent in the hospital Medtap International. The Value of Investment in Health Care: Better Care, Better Lives (Executive Summary). Bethesda, MD: Medtap,
6 Overall Therapy Evaluation Type of Outcomes Therapy Name Therapy A Therapy B Therapy A Overall Cost Therapy B Overall cost Clinical Outcomes Efficacy and Safety Therapies A & B have equivalent E&S Economic Outcomes Treatment Duration 10 Days 10 Days $250 $400 Drug Cost Per Treatment $250 $400 Economic Outcomes Hospital Length of Stay ($100 per day) 5 Days 3 Days $500 $300 Economic Outcomes Time off from Work ($100 per day) 7 Days 4 Days $700 $400 Humanistic Outcomes Total Cost $1,450 $1,100-6-
7 Identification of Health Related Outcomes Outcomes beyond safety and efficacy which capture the psychological, social, physical, functional, and economic impact of disease and treatment for individual and society Identifying Health related outcomes Economic outcomes Hospitalizations avoided Workers productivity Clinical outcomes Clinical efficacy/effectiveness cure rate Relief, reduction in symptoms Impact on morbidity and mortality Humanistic outcomes Health related quality of life Patients satisfaction and compliance Ability to perform activities Challenges Identifying relevant outcomes Valuing outcomes -7-
8 The Different Steps of Evidence Efficacy Effectiveness Efficiency -8-8

9 The Different Steps of Evidence Can it work? = Efficacy Does it work in reality? = Effectiveness Is it worth doing it, compared to other things we could do with the same money? = Cost-effectiveness = Efficiency -9-9
10 The Different Steps of Evidence Efficacy

11 The Different Steps of Evidence Effectiveness

12 The Different Steps of Evidence OR Efficiency
13 Pharmaco-Economics It refers to the scientific discipline that compares the value of one pharmaceutical drug or drug therapy to another. It is a sub-discipline of Health economics. A pharmacoeconomic study evaluates the cost (expressed in monetary terms) and effects (expressed in terms of monetary value, efficacy or enhanced quality of life) -13-
14 Key Drivers: Factors Impacting the growing imbalance between costs and budget for healthcare stakeholders The Growing Imbalance Between Healthcare Costs and Budget Costs of Healthcare time Disposable Healthcare Budget time An aging population with an increased healthcare demand Medical innovation and a more informed consumer claiming state of the art treatment Fiscal budget gaps and a refocus of investments from healthcare into other fiscal projects Changes in reimbursement methodologies and healthcare funding Increasing scrutiny of governments and payers in approving healthcare investments Source: Accenture Research 2010/ Accenture. All rights reserved. -14-

15 Value Is Understood Differently Estimated Value Seen by the drug manufacturer Usage Value Seen by the prescriber the patient and the health authority giving the local approval Exchange Value Seen by the payer

16 IND SUBMITTED NDA SUBMITTED PRE-DISCOVERY Drug Development Takes Longer Than It Did in the Past Developing a new medicine takes an average of years; the Congressional Budget Office reports that relatively few drugs survive the clinical trial process Drug Discovery Preclinical Clinical Trials FDA Review Scale-Up to Mfg. Post-Marketing Surveillance ~ 5,000 10, COMPOUNDS ONE FDA- APPROVED DRUG PHASE 1 PHASE 2 PHASE 3 NUMBER OF VOLUNTEERS ,000 5, YEARS 6 7 YEARS YEARS INDEFINITE Sources: Drug Discovery and Development: Understanding the R&D Process, CBO, Research and Development in the Pharmaceutical Industry,
17 Billions (Constant Dollars, Year 2000) The Cost of Developing a New Drug Has Greatly Increased $1.4 Cost to Develop One New Drug 1 $1.2 $1.3B $1.0 $0.8 $800M $0.6 $0.4 $0.2 $0.0 $100M $300M Sources: 1 J. DiMasi and H. Grabowski, "The Cost of Biopharmaceutical R&D: Is Biotech Different?," Managerial and Decision Economics, 2007; J. DiMasi et al., The Price of Innovation: New Estimates of Drug Development Costs, Journal of Health Economics,
18 Current Payor Landscape in the Middle East Region Ministries of Health across multiple countries provide drug coverage to specific segments of the population as well as for specific disease entities Government health institutions providing coverage to their own employees, mainly government/military sectors. Governmental health authorities who provide services to the residence of specific regions Private Health insurance companies who provide coverage to beneficiaries through employers contracting. This is the fastest growing segment in the payor area across most countries. Out of pocket business -18-
19 Provides discounts and incentives for formulary inclusion Stakeholders Involved (Money Flow) Employer (private or govt) Pays for providing employees coverage Payor/Insurer (private or govt) Employee/ Patient Issues Rx order Seeks treatment HCP or Healthcare Facility PBM Pays manufacturer (directly or through supplier Pharmacy Supplies medications Manufacturer -19-
20 Management Spending Tools Formulary A defined list of medications, by therapeutic category, that determines the level of member benefit Determined by P&T, MD and Pharm D Cost effective therapies Generic preferred Rebate-driven brands Structured Tiered Approach Co-pay/co-insurance driven tiering system prioritizing availability of drugs based on the above criteria Tier Level Tier 1 Tier 2 Tier 3 Tier 4 NDC Locked Products Generics Preferred brands Non-preferred brands Biologics Products not to be covered under any circumstances Approximate patient co-pay or co-insurance $10 $25 - $35 $50 - $70 % of total cost Full cost Motive for Placement Least expensive Generic not available. Therapeutically necessary. Rebate negotiated with manufacturer Example on Tier Structure Generic not available. Therapeutically necessary. Rebate not provided by manufacturer Expensive therapy. Generally over $500 per Tx Not therapeutically valuable -20-
21 Rebate and Incentive Agreements with Manufacturers Manufacturers contract with PBMs on specific products to provide them rebates on quarterly basis based on utilization trends within specific market baskets. Examples on those agreements are as follows Flat discount rebate Market share rebate Index to nation rebate Volume based discounting rebate Risk sharing agreement Value Based Insurance Design -21-

22 Key Issues for Health Decision Makers Healthcare is getting too expensive We need to prioritize Step 1: Do not pay for treatments that do not deliver value Step 2: Define Value: How much do we pay for what we get? -22-
23 Additional Terminology Cost-effective The investment is good value for money It is not equivalent to cost-saving Cost-saving The return on investment saves more in terms of prevented morbidity/mortality than the investment itself An intervention may be not cost-effective, cost-effective or cost-saving depending on different modeling assumptions and perspectives -23-
24 Quality-Adjusted Life Years (QALY) A standard health outcome measure in cost-effectiveness analysis Accounts for quality and quantity of life Cost/QALY quantifies economic (cost) and health benefits (QALY) of a medical intervention -24-
25 Quality-Adjusted Life Years Two components of calculation of QALYs 1. Quality weight (utility or preference) of each health state which individual may experience Quality weight may range between 0 and 1 0 Death 1 Perfect health 2. Length of time of each health state (Quantity) 3. One QALY is the mathematical equivalent to one person living one year in perfect health -25-
26 QALY Weights QALY Gained Perfect Health 1 With Therapy No Therapy Death 0 Duration (years) T1 T2 Source: Torrance G.W. (1996). Designing and conducting cost-utility analyses. In: Quality of life and Pharmacoeconomics in clinical trials. Second edition, pp
27 Incremental Cost-Effectiveness Ratio (ICER) Cost Vaccination Cost No vaccination Outcome Vaccination Outcome No vaccination Hypothetical Example Strategy Cost ($) QALY ICER No Vaccination 50, Vaccination 130, Difference 80, ,000 ICER threshold may vary by decision-maker: < $50,000 - $100,000 per QALY often considered cost-effective. -27-
 Employer (private or govt) Pays for providing employees coverage Payor/Insurer")

28 Provides discounts and incentives for formulary inclusion Stakeholders Involved (Money Flow) Employer (private or govt) Pays for providing employees coverage Payor/Insurer (private or govt) Employee/ Patient Issues Rx order Seeks treatment HCP or Healthcare Facility PBM Pays manufacturer (directly or through supplier Pharmacy Supplies medications Manufacturer -28-
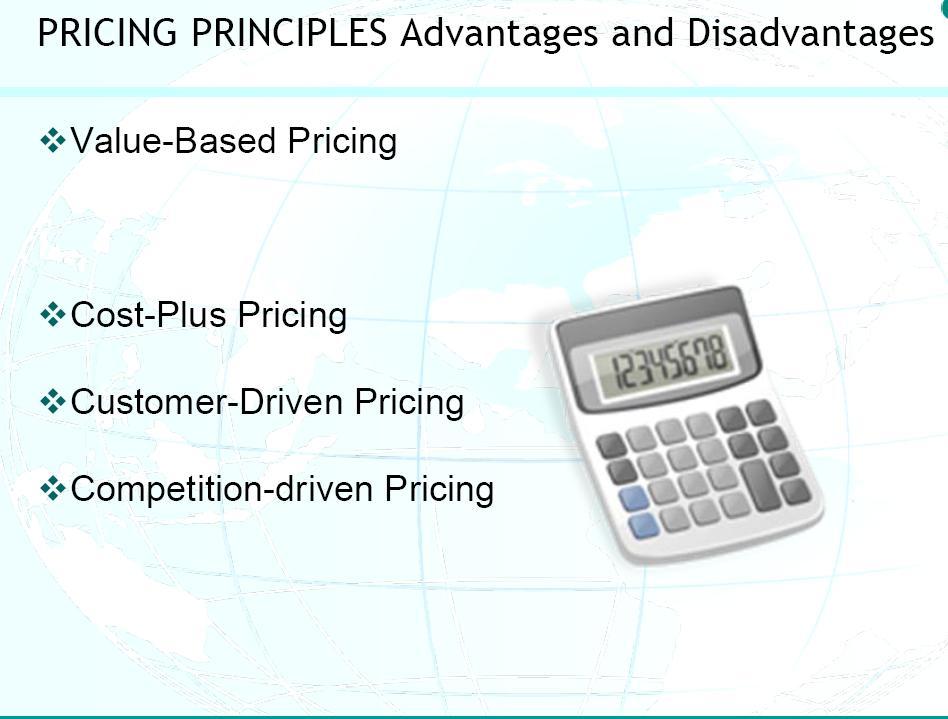
29 Pricing Excellence, Principles and Beyond -29-

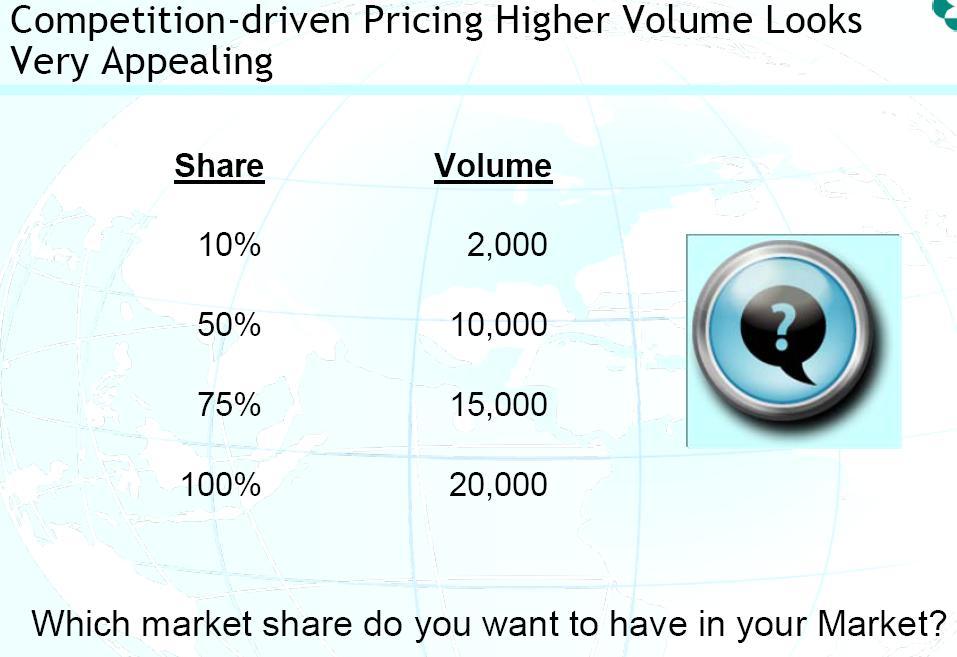
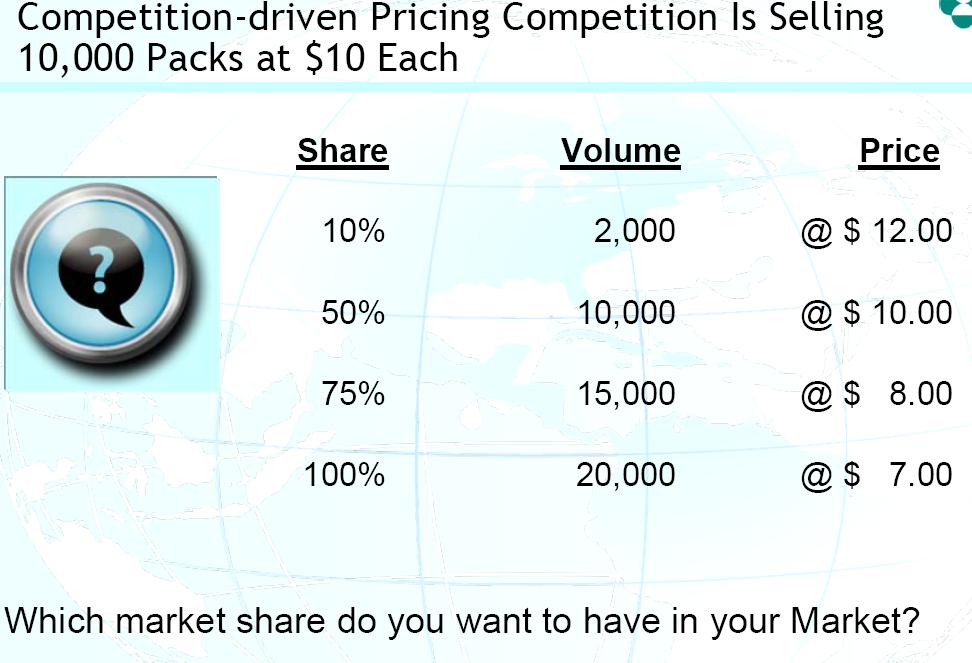
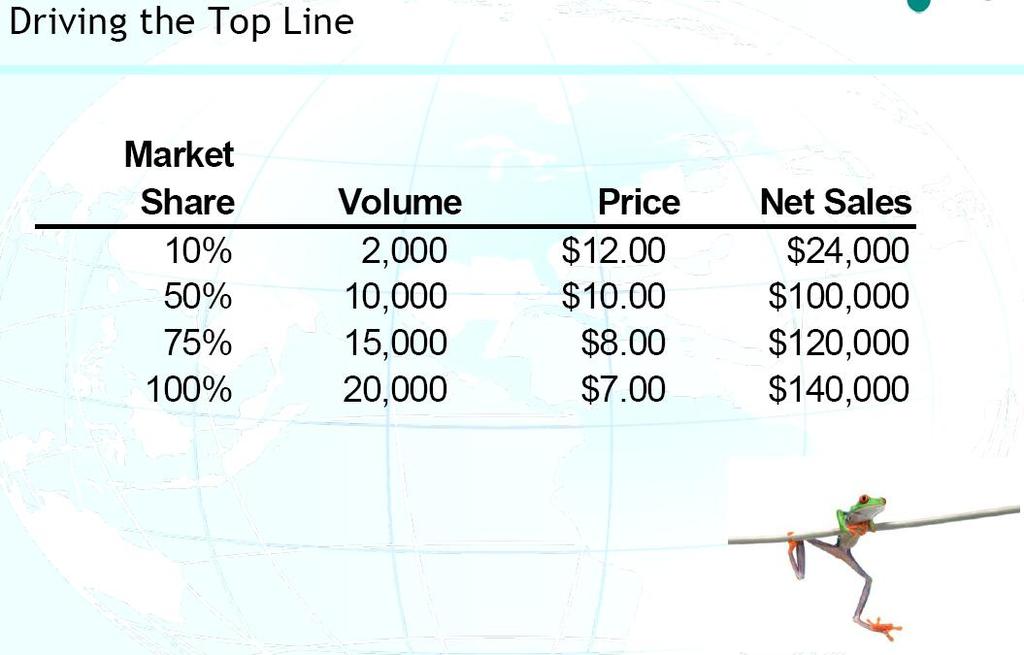
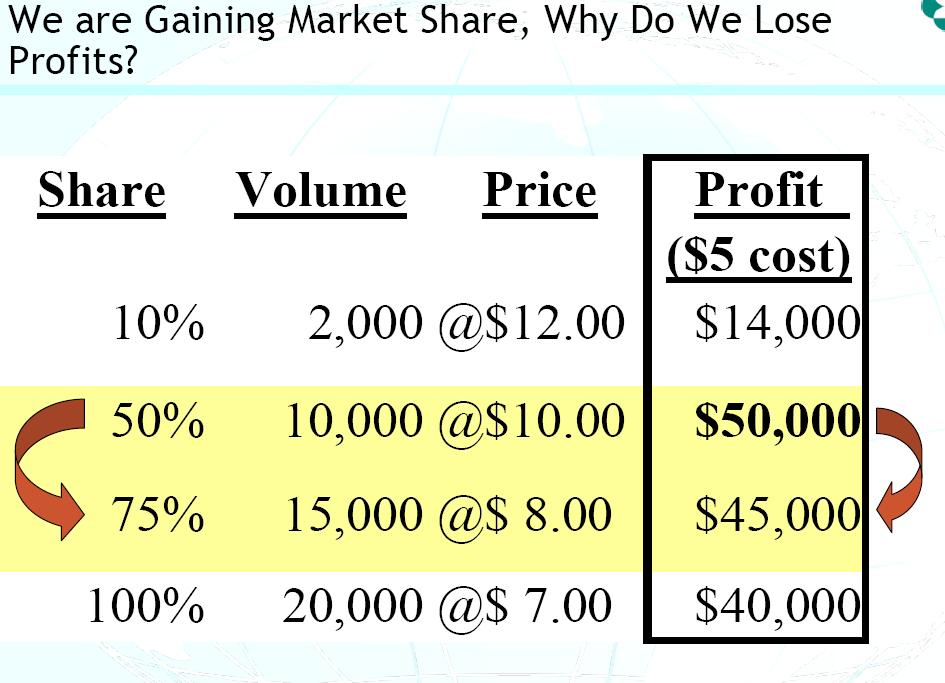
30 Exponential Volume Increase in Relation to Unit Price Reduction -30-
31 -31-
32 -32-
33 -33-
34 -34-
35 -35-
36 -36-
37 -37-