Center for Affordable Nanoengineering of Polymeric Biomedical Devices. PI: L. James Lee; co-pi: John Lannutti* The Ohio State University
|
|
|
- Emma McKinney
- 5 years ago
- Views:
Transcription
1 Center for Affordable Nanoengineering of Polymeric Biomedical Devices PI: L. James Lee; co-pi: John Lannutti* The Ohio State University 2011 NSF Nanoscale Science and Engineering Conference 12/5/2011

2 CANPBD Phase I and Phase II Vision Phase I ( ): Developing polymer nanoconstructs, nanomanufacturing and nanofluidics technology for biomedical devices - affordable? Phase II ( ): System level integration of Phase I technologies for nanomedicine and nonbiological applications


3 CANPBD Phase II Research Structure Automated Cell to Biomolecule Analysis (ACBA) Multifunctional Nanoparticle Design and Synthesis (MNDS) 80% ACBA MNDS 20% Nano Manufacturing Micro/Nano Fluidics Nano Manipulation Guided Assembly Core Technology Platforms

 NSEC- CANPBD")
 Y")


4 Nanotechnology Pathway to Personalized Nanomedicine Automated Cell to Biomolecule Analysis (ACBA) NSEC- CANPBD Multifunctional Nanoparticle Design and Synthesis (MNDS) Y Y Y Y Y Y Y Y Y cancer cell separation and analysis Targeted nanoparticles produced by nanofactory OSU Comprehensive Cancer Center and James Cancer Hospital Patient blood or tissue samples Clinical trial Animal study Biotechnology Industry
5 Detection Methods Needed to Reduce Cancer Mortality Early and Convenient Detection: detection and analysis of very small number of circulating tumor cells (CTCs) in blood or body fluid samples Rare Cell Detection: detection and analysis of rare cancer stem cells in tumor tissues Post Treatment Monitoring: detection and analysis of residual cancer cells after treatment to prevent cancer relapse Efficient and automated detection system capable of single-cell level analysis of sensitive biomarkers such as microrna in both liquid and solid tumor cells
6 Circulating Tumor Cells (CTCs) in Metastatic Breast Cancer Cristofanelli et al NEJM, 2004 Balasubramanian, Miller and Chalmers et al
7 Automated Cell to Biomolecule Analysis (ACBA) Platform 1st Stage- Cell Separation 2nd Stage- Cell Manipulation 3rd Stage- Bio Detection Mixed cells input Single cell mirna output System Integration i. Cell surface biomarkers by antibody microarray i. Optical tweezers array i. Molecular probes by nanoelectroporation ii. Cell surface biomarkers by magnetic particles ii. Magnetic tweezers array ii. Nanowire sensors New Technologies iii. Cell migration by nanofiber race track iii. ECL in microwells iv. EIS in nanopores v. Ion transport through DNA nanostrands


 Proteins complex molecular structures protein")
 blood ( ~8 ml )")
 cell extraction cell separation")
8 Statement of Functional Objectives of ACBA Blood-based analysis of microrna profiles in circulating tumor cells. Blood-based biomarkers micrornas simple molecular structures stable, fewer species no post-translational modifications RT PCR amplification (early detection) Tumor biopsy (late stage detection) Proteins complex molecular structures protein denaturation (stability) more species post-translational modifications microrna targets (5-7 species) blood ( ~8 ml ) 30,000 cells cell-type specific single-cell analysis microrna profile CTCs ( >700 species) cell extraction cell separation (characterization) cell manipulation microrna detection (amplification)
9 8 ml whole human blood Input CTC Spike ACBA II System Block Diagram Pre-ACBA II System Negative Depletion RBC Lysis Reduce RBCs 1 2 Centrifuge and Reconstitute CD-45 Immuno -label Reduce WBCs Centrifuge and Reconstitute 8 Enriched Sample Immuno-Label Magnetic particle Fluorescent Surface Marker 7 Enriched Sample w/ labeled CTC s 3 4 Multiplex 6 Magnetic Tweezers and Microfluidics Sort, select and dropletize* 5 4a Dropletized* CTCs Output (for each cell analyzed) Compare with standard Nanowire Impedance RT-PCR* Detect mirna Amplify mirna Lyse CTC Fluorescence Detector Profile Report Qty 5-7 mirnas Fluorescence mirna level for 5-7 mirnas Nanowire Impedance for 5-7 wire types Amplified* targeted mirnas 1 CTC contents in nanowell


 trapped and")
10 Cell Tracking and Manipulation Brightfield images 1 micron 1 micron 1 micron 1 micron Fluorescent images White blood cells (leucocytes) trapped and manipulated by anti-cd45 MagDots


11 Physics behind the Magnetic Tweezers Wires Forces and Energy Profiles Disks
12 Stage 1 Cell labeling (hold) Single cell mirna detection Magnetic beads Manipulation Nanoelectroporation Optical Electrical Cells ` Molecular Beacons Temperature zones (PCR) Stage 2 Buffer solution Cell encapsulation Stage 3 Nanowire Ionic liquid


13 Cancer Migration RANDOM Johnson J, Nowicki OM, Lee CH, Chiocca AE, Viapiano MS, Lawler SE, Lannutti, JJ, Quantitative analysis of complex glioma cell migration on electrospun polycaprolactone using time-lapse microscopy, Tissue Eng Part C 2009;15(4): ! ALIGNED Migration prevents surgical removal and contributes to a rapid, lethal outcome

14 Direct Tumor Seeding
15 Automated Cell to Biomolecule Analysis (ACBA) Platform: Nanofiber Racetrack downstream transfer Nanofiber Cell Racetrack + - Nanoelectroporation (DCI/NEP)
16 DNA Combing and Imprinting (DCI) / Nanochannel Electroporation (NEP) a PDMS b c DNA nanostrands DNA/Water Glass Gold coating Cell Gene/Drug Imprinting e d Etching Microchannel Prepolymer resin Trapped cell Gene/Drug Nanochannel Side view Guan and Lee, PNAS, 2005 Nanochannel Guan, Yu, Lee, Advanced Materials, 2007 Guan, Boukany, Chiou, Hemminger, Zha, Cavanaugh, Lee, Advanced Materials, 2010 Boukany, et al, Lu, Lafyatis, Lee, Nature Nanotechnology, µm


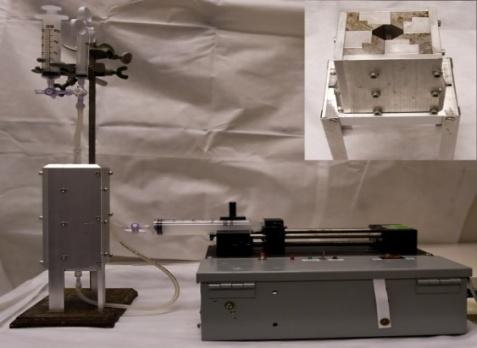
17 Automated Nanoimprinting Flexure stage F F PDMS stamp Fixed base Alignment fixture UV light Glass slide Designed the first generation DNA imprinting stage by MIT Precision Compliant Systems Laboratory to be tested at OSU. Improved imprinting yield by removing human error introduced during process preventing rupture of DNA nanowires. Combination of dip combing, layer-by-layer assembly, and auto imprinting can currently raise the success rate of DCI from 20% to 60%. Designs that can handle multiple samples simultaneously in order to increase throughput are being developed.


18 ACBA Platform: Antibody Microarray - Optical Tweezer - NEP Optical tweezer setup Laser (λ=1064 nm, 1W) Greg Lafyatis, Physics Power supply ACBA chip
19 8 ml whole human blood Input CTC Spike ACBA II System Block Diagram Pre-ACBA II System Negative Depletion RBC Lysis Reduce RBCs 1 2 Centrifuge and Reconstitute CD-45 Immuno -label Reduce WBCs Centrifuge and Reconstitute 8 Enriched Sample Immuno-Label Magnetic particle Fluorescent Surface Marker 7 Enriched Sample w/ labeled CTC s 3 4 Multiplex 6 Magnetic Tweezers and Microfluidics Sort, select and dropletize* 5 4a Dropletized* CTCs Output (for each cell analyzed) Compare with standard Nanowire Impedance RT-PCR* Detect mirna Amplify mirna Lyse CTC Fluorescence Detector Profile Report Qty 5-7 mirnas Fluorescence mirna level for 5-7 mirnas Nanowire Impedance for 5-7 wire types Amplified* targeted mirnas 1 CTC contents in nanowell
20 ACBA Example: Requirements Allocation Process Metrics: Cell System Requirement: 5 CTCs/ml Input: 5 ml whole blood Stage 0: Enrichment Nega@ve Deple@on Stage 1: Cell Separa@on Mixer/Labeler Efficiency (%) 50% 90% 90% Error (%) 0.01% 0.01% 0.01% Total Cells 25 Billion shall be less than out Thousand of "nega@ve deple@on" 61 process (magne@c 80 greater than the CTC to non- CTC Ra@o, CTC minimum. CD- 45 posi@ve cells risk being Non-specific* * - non- CTCs interpreted as CTCs by system The sample enrichment process shall remove no more than The magne%c 50% of the label CTCs carryover present in error the of raw the blood enriched sample. sample 10,000 cells (0.01%). The system shall have a detec%on sensi%vity of 5 CTC per ml raw blood Total cells analyzed All cells Predicted # CTCs analyzed Stage 2: Cell Manipula@on Stage 3: Detec@on This metric means that the system shall be able to deliver at least 1 CTC for analysis when there Magne@c are at least 5 CTCs per ml blood in Tweezers the raw sample. Mortality rates seem to support need to detect at this level, however, tracking at higher rates is s@ll valuable. The maximum frac@on of CTCs lost during enrichment of the raw blood sample prior to This ACBA. is the number of CD- 45 magne@cally labeled cells that get through the separator). This number should not be which is approximately 1:10,000 inadvertently manipulated by tweezers if not fully removed by magne@c separa@on. Nanowire Array Biomedical Output Take Away: Need to queue up 10 cells to be assured of analyzing a CTC


 Deseye")

")


21 CANPBD Spin-off Companies (>30 jobs, >$10M) Ohio Nanomed, Inc. (R. Lee) Deseye (Desai) NanoMED (J. Lee) BioLOC (J. Lee) Nanofiber Solutions (Lannutti) Ikotech LLC (Chalmers) Cell Habitats (Desai) Nanomaterial Innovation Ltd. (J. Lee) Columbus NanoWorks, Inc (Chalmers) Traycer (Epstein) Precelleon (Chalmers)
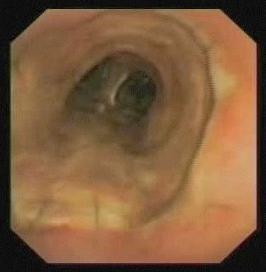
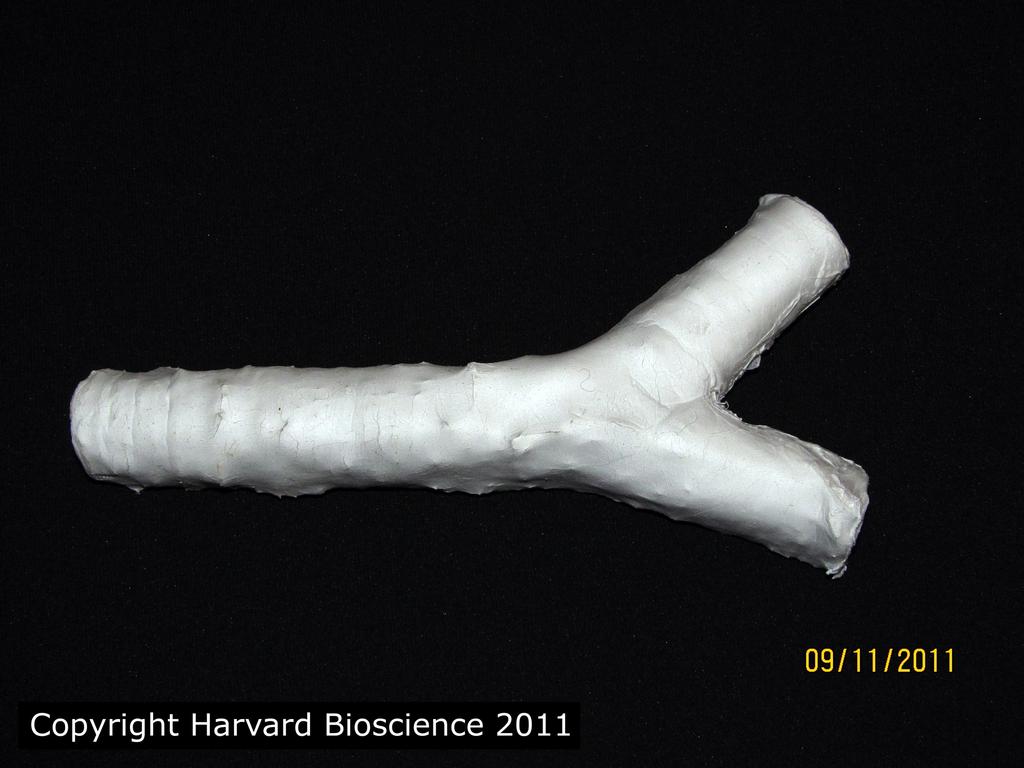
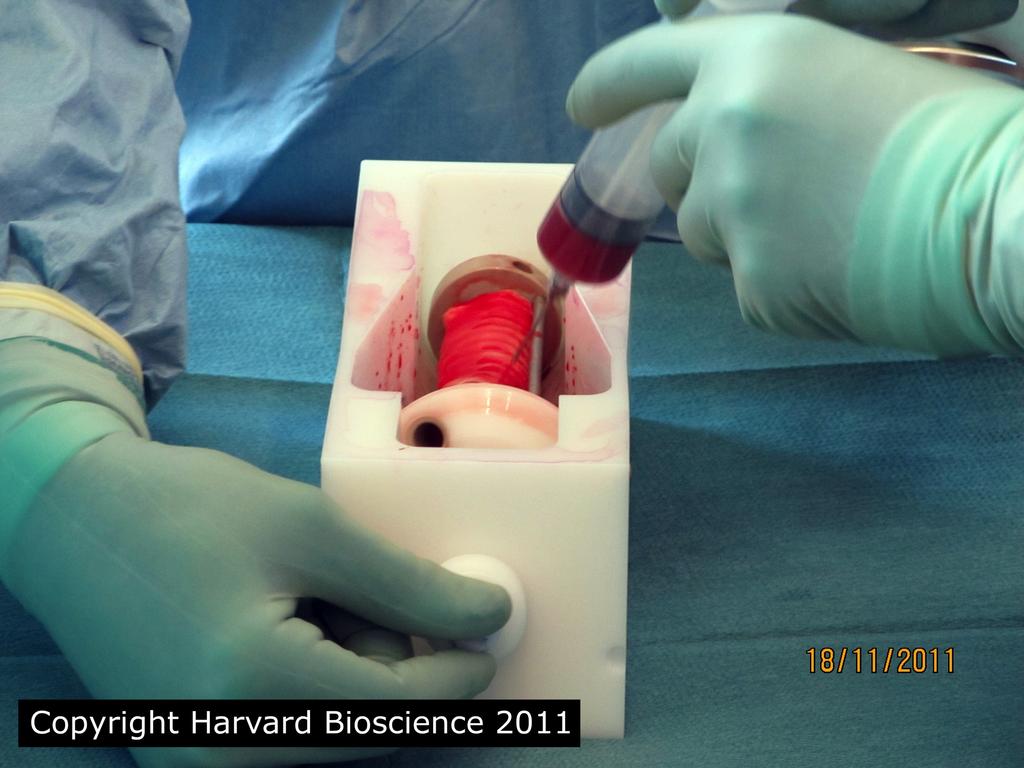
22 Nanofiber Solutions, NSF STTR - Recent Success Nanofiber trachea Na%ve trachea


23 Collaborations with OSU Medical School Target: ~$1-1.5M/yr. for research, training, facilities OSUCCC (Comprehensive Cancer Center) e.g. ACBA chips and systems lipoplex nanoparticles for sirna /mir delivery biodegradable cell-based device NIH research and training proposals, P01, R01, T32, U : 15 PhD and 1 MS degrees completed, 4 postdocs trained (7 in industry) >400 K-12 students impacted by Center activities 20 high school science teachers in teacher workshops
24 Summary 1. Continue to work to infuse systems thinking across individual platform teams: Develop processes to keep systems engineering work products up to date as conditions change and risks are realized or retired Continue to address communication gaps and misalignments at technology boundaries 2. Develop verification test plans that outline approach to biomedical testing of requirements 3. Continue to mature existing and alternative technologies to minimize platform technical risks