AN ABSTRACT OF THE THESIS OF
|
|
|
- Mitchell Haynes
- 5 years ago
- Views:
Transcription
1 AN ABSTRACT OF THE THESIS OF Sunny L. Lucas for the degree of Master of Science in Botany and Plant Pathology presented on March 18, Title: Susceptibility of Coast Redwood Seedlings to Phytophthora ramorum Abstract approved Jennifer L. Parke Coast redwood (Sequoia sempervirens) (D. Don) Endl. is a host for Phytophthora ramorum but it was unclear if the pathogen represents a significant disease risk to this tree species. In this study the susceptibility of coast redwood seedlings and the likelihood of sporulation on redwood were examined. Two methods were used to assess susceptibility. Seedling stems were artificially inoculated and pathogen colonization distance was measured in both main stems and side branches after 8 and 16 weeks. Pathogen colonization distance was usually minimal, rarely exceeding 15 mm from the inoculation site. In two seedlings the pathogen colonized tissue greater than 40 mm from the inoculation site. No seedling mortality was observed. However, small side branches (2.4 mm mean diameter) were often killed. A dose response experiment was conducted to determine the minimum zoospore concentration necessary to cause infection. Seedlings exposed to > 5 x 10 3 zoospores/ml became symptomatic. Nonetheless, symptom expression was variable unless seedlings were inoculated with > 1 x 10 5 zoospores/ml. Sporulation was quantified by determining sporangia density (sporangia/cm 2 ) on detached immature and mature foliage of redwood seedlings, and leaves of California bay (Umbellularia californica). In the first trial, significantly more sporangia/cm 2 were observed on California bay compared to redwood, but in the second trial, the results were reversed. Sporulation density on attached redwood foliage was also determined. Comparisons were again made between young and mature redwood foliage. In the attached branch experiment, sporangia density was higher than previously observed and
2 no significant difference was found between sporangia/cm 2 necrotic tissue on young vs. mature redwood branches. Sporulation results and implications of these findings are discussed in relation to sporulation levels reported on other hosts. This study highlights the importance of determining both host susceptibility and the risk of P. ramorum spread from hosts to other uninfected plants.
3 Copyright by Sunny L. Lucas March 18, 2008 All Rights Reserved
4 Susceptibility of Coast Redwood Seedlings to Phytophthora ramorum by Sunny L. Lucas A THESIS submitted to Oregon State University in partial fulfillment of the requirements for the degree of Master of Science Presented March 18, 2008 Commencement June 2008
5 Master of Science thesis of Sunny L. Lucas presented on March 18, APPROVED: Major Professor, representing Botany and Plant Pathology Chair of the Department of Botany and Plant Pathology Dean of the Graduate School I understand that my thesis will become part of the permanent collection of Oregon State University libraries. My signature below authorizes release of my thesis to any reader upon request. Sunny L. Lucas, Author
6 ACKNOWLEDGEMENTS I would like to express sincere appreciation for the opportunity to pursue this Masters degree. I would like to first thank my advisor, Jennifer Parke, for all of her guidance, patience, and faith. She offered me several great opportunities/challenges, and always believed in my abilities. She is a dedicated, hard-working scientist who is not afraid to ask questions that are difficult to answer. I would also like to thank my other committee members, Everett Hansen and Ken Johnson. I have learned a considerable amount from each of them. I would also like to thank my graduate representative, Dave Shaw, his forestry background and enthusiasm were much appreciated. I would like to thank everyone in the Parke lab for answering questions, teaching me how to use equipment, helping me with my experiments, and being friendly, smiling faces. Indispensable to my project was Gerri Buckles, my sounding board for experimental challenges. She assisted with my fieldwork, did my PCR analysis, worked on my microscopy, helped build my confidence, and became a good friend. I would also like to thank Caroline Choquette for watering my seedlings, helping to set-up my experiments and often affirming my decision-making abilities. Members of the Hansen lab assisted me in many ways. Especial thanks to Ebba Peterson, who helped with my fieldwork, nourished me during stressful times, edited my thesis, and was my general sudden oak death compatriot. For assistance with my fieldwork I d like to acknowledge Yana Valachovic and Christopher Lee, University of California Cooperative Extension, Humboldt and Del Norte Counties, California Department of Parks & Recreation, North Coast Redwoods District, Tooby Park Board of Directors and Plum Creek Nursery. Thanks to Upekala Wijayratne, a great office mate, for being there in subtle ways, and Dominic Maze, the best neighbor and dog-sitter. I d like to thank my parents for their unwavering support and encouragement. Thanks to Ian Silvernail for helping me find the strength to improve my life and becoming my best friend. Thanks to Osita for making me go for a long walk every morning.
7 TABLE OF CONTENTS Page Introduction Materials and Methods.. 9 Pathogen Colonization Distance 9 Inoculum Density in Relation to Disease Incidence (Dose Response) 12 Sporulation Detached Tissue 14 Sporulation Attached Tissue 18 Results 20 Pathogen Colonization Distance Inoculum Density in Relation to Disease Incidence (Dose Response) 25 Sporulation Detached Tissue 28 Sporulation Attached Tissue. 35 Discussion.. 39 Conclusion.. 46 Literature cited Appendix Introduction 54 Experimental Sites. 54 Detecting Inoculum 56 Seasonality of Disease Incidence 57 Symptom Development.. 58 Discussion 58
8 LIST OF FIGURES Figure Page 1. Diagram of sampling methods used in each trial of the pathogen colonization distance experiment An example of fluorescing sporangia on a filter after Calcafluor was added Sporulation on detached leaves and branches Sporulation on attached branches: inoculation and incubation methods Maximum distance colonized by P. ramorum in inoculated side branches: trial 1 vs. trial The branch on the left was inoculated with P. ramorum vs. the branch on the right was a wounded control Discoloration in wood from a sample colonized by P. ramorum (on the left) and beyond pathogen recovery (on the right) Symptomatic branches from dose response Proportion of seedlings infected (Logit) vs. log (Inoculum Dose) Mean sporangia densities per total leaf area (sporangia/cm 2 ) on inoculated California bay leaves (Bay), mature redwood branches (MR), and young redwood branches (YR) separated by trial with standard error bars 31
9 LIST OF FIGURES (Continued) Figure Page 11. Mean sporangia densities per lesion area (sporangia/cm 2 ) on inoculated California bay leaves (Bay), mature redwood branches (MR), and young redwood branches (YR) separated by trial, with standard error bars Total number of sporangia vs. the total necrotic area (cm 2 ) for each treatment, separated by trial Sporangia density (sporangia/total tissue area [cm 2 ]) for mature and young branch pairs for trials 1 and Sporangia density (sporangia/lesion area [cm 2 ]) for mature and young branch pairs for trials 1 and Total number of sporangia vs. the total necrotic area (cm 2 ) for mature and young redwood, separated by trial... 38
10 LIST OF TABLES Table Page 1. The total distance of Phytophthora ramorum colonization within stems, isolation and PCR results reported separately, from artificially inoculated seedlings Relationship between inoculum dose and disease incidence Level of sporulation on detached California bay leaves (Bay), branches of mature redwood tissue (MR), and branches of young redwood tissue (YR) for two different trials
11 LIST OF APPENDIX FIGURES Figure Page 1.. Daily rainfall vs. number of raintraps positive for P. ramorum Monthly rainfall: Humboldt County (Miranda, CA) [ ] vs. Curry County (Brookings, OR) [- -] from November 2006 through May Percentage of days/month receiving at least.254 cm of rain in Humboldt County (Miranda, CA) vs. Curry County (Brookings, OR) November 2006 May Humboldt County (Miranda, CA) monthly rainfall November 2006 May 2007 [ ] vs. average monthly rainfall November May [ ] 61
12 Susceptibility of Coast Redwood Seedlings to Phytophthora ramorum
13 Introduction 2 Sudden oak death was first reported in the United States in the 1990s in the San Francisco Bay area (Rizzo et al. 2002). In 2002, the pathogen causing sudden oak death was identified as Phytophthora ramorum, a species first described in 2001 in Europe (Werres et al. 2001). P. ramorum has caused significant mortality of Lithocarpus densiflorus (tanoak) and several oak species including Quercus agrifolia (coast live oak), Quercus kellogii (California black oak), and Quercus parvula var. shrevei (Shreve s oak), affecting 14 central coastal counties in California and one county in Oregon (Rizzo et al. 2002; Davidson et al. 2003; California Oak Mortality Task Force 2008). The pathogen responsible for Sudden Oak Death also causes Ramorum blight on many hosts. Currently, P. ramorum has the largest host range of any quarantined pathogen in the United States (Rizzo et al. 2005). According to the United States Department of Agriculture, Animal & Plant Health Inspection Service (APHIS), over 100 plant species have been designated as hosts or associated hosts (U. S. Department of Agriculture 2008). Koch s postulates have not been completed for those species listed on the associated host list. Being a recently described species and disease, the impact that P. ramorum could have in both the forest and nursery is unknown. As new pieces of the P. ramorum puzzle are learned almost daily, this story evolves each year. Phytophthora ramorum exhibits a variety of symptoms on a wide range of hosts. Specific symptoms and extent of infection vary by host. Much work has been done since the initial characterization of P. ramorum to define the host range and describe disease symptoms (Davidson and Shaw 2003; Davidson et al. 2003; Parke et al. 2004; Tooley et al. 2004; Hansen et al. 2005; Shishkoff 2006; Tooley and Kyde 2007). On tanoak and coast live oak, the most susceptible hosts to P. ramorum, the bleeding cankers are the most diagnostic symptom of sudden oak death. Though cankers are a rare symptom over the broad host range of P. ramorum, they are a consistent and dramatic part of this west coast epidemic. Initially, individual bleeding spots through intact bark occur on the main trunk of the host. As the disease progresses, the bark may crack and the red, clear exudates continue through both cracked and intact bark. Cankers
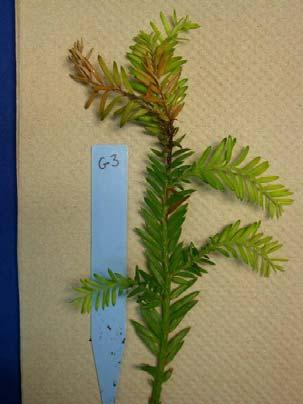
14 3 are reddish brown to black. In general, discoloration is more extensive in the bark and cambium than in the xylem tissue. Cankers may range in size from a few centimeters to 3 meters in length. On tanoak these cankers may be surrounded by water-soaked tissue. Cankers have only been found on mature coast live oak trees, but may appear on tanoak at any stage of development (Davidson et al. 2003). In addition to the bleeding cankers typical of sudden oak death, P. ramorum also causes Ramorum blight on many hosts. Foliar symptoms are much more common across hosts than are cankers. On Rhododendron spp. necrotic lesions on leaves may appear anywhere on leaf surfaces. They are easily confused with lesions caused by other Phytophthoras. Leaf infection may occur from stem infection via the petiole. In this case, the necrotic region remains close to the midvein. Foliar symptoms on other hosts vary, appearing like sun scorch, necrosis with a chlorotic ring, bull s eyes, or water-soaked tissue (Davidson et al. 2003). Many hosts suffer from necrotic cankers, discoloration of stems, and/or shoot dieback. Ramorum blight, on some hosts, can also lead to an overall reduction in vigor, leaf flagging or wilting. On both tanoak and coast live oak, the crown may suddenly become brown, or gradual leaf loss may occur (Davidson et al. 2003). In response to main stem girdling, elicitin production, or reduced stem hydraulic conductivity, sudden oak death and Ramorum blight are lethal to some hosts (Davidson et al. 2003, Manter et al. 2007a, Parke et al. 2007). Many conifers have been tested for susceptibility and several have been determined susceptible (Denman et al. 2005; Hansen et al. 2005; Chastagner et al. 2006). Seedlings or sprouts of several conifers have been found naturally infected in California and Oregon forests: Sequoia sempervirens (coast redwood), Pseudotsuga menziesii (Douglas-fir), Taxus brevifolia (Pacific yew), Abies grandis (grand fir), Abies magnifica (red fir) and Abies concolor (white fir) (Davidson et al. 2002; Maloney et al. 2002; Garbelotto et al. 2003; Bienapfl et al. 2006; Chastagner et al. 2006; Goheen et al. 2006; U. S. Department of Agriculture 2008). Currently, Koch s postulates have only been completed for coast redwood and Douglas-fir; therefore these are regulated hosts (U. S. Department of Agriculture 2008). Symptoms on Douglas-fir include cankers on small branches, wilting of new shoots, dieback of branches, and loss of leaves. On small saplings, death of the leader and
15 4 top whorls of branches is also possible (Davidson et al. 2002; Garbelotto et al. 2003; Goheen et al. 2006). Key factors in symptom development are the level of inoculum and growth stage of the plant. Seedlings are most susceptible immediately following bud break (Hansen et al. 2005; Chastagner et al. 2006). Symptoms on coast redwood seedlings and saplings include discolored needles and cankers on small branches. Symptoms have been found on sprouts of mature trees, and it appears that sprouts can be killed by the pathogen (Maloney et al. 2002; Garbelotto et al. 2003). Coast redwood symptoms are similar to those found on Douglas-fir, though thus far redwood symptoms appear to be less extensive (Davidson et al. 2002; Maloney et al. 2002; Hansen et al. 2005). It has been suggested that P. ramorum is exotic to both North America and Europe (Werres et al. 2001; Rizzo et al. 2002; Brasier 2003; Kluza et al. 2007). P. ramorum has been found in the nursery, the forest, and the urban-wildland interface in the United States. Ramorum blight occurs discontinuously in coastal mixed-evergreen forests in California and Oregon. As of 2007, 14 California counties and part of one Oregon county were federally quarantined (U. S. Department of Agriculture 2008). One of the factors influencing spread of the disease is the abundance of hosts. Host species are found on 4.5 million acres of forested public and private land in the 14 quarantined California counties (reported acreage excluding state and national parks). Coast redwood is found on 1.5 million and is the dominant species on 877,000 of those forested acres (Barrett et al. 2006). In a study looking at disease prevalence in coast redwood forests, researchers found disease incidence levels on overstory tree hosts to be highest on Umbellularia californica (California bay) with a frequency of 42-69%, followed by tanoak with a frequency of 32-45%, and redwood with a frequency of.3-1% (Maloney et al. 2005). While redwood was not the most frequently infected host, disease does occur and this host is present through much of the infested forests. P. ramorum propagules have been recovered from rainwater, in topsoil, litter, and in streams (Davidson et al. 2005; Fichtner et al. 2007). Experimental data collected from an infected coast live oak/bay laurel forest in California showed that inoculum could not be recovered from these sources during the dry, hot summer (Davidson et al. 2005).
16 5 Inoculum was recovered throughout the winter and spring. Inoculum recovery was highest during the spring when rain was continuous and temperatures mild. These results are consistent with findings that Phytophthora spp. in general require very high moisture levels for production of sporangia (Ribeiro 1983; Davidson et al. 2005). Currently, little is known about over-summering inoculum reservoirs, either in hosts or in the environment. There is evidence for summer survival of propagules in soil, suggesting that this may be one source of inoculum for fall disease development (Fichtner et al. 2005; Fichtner et al. 2007). In a redwood-tanoak forest, P. ramorum was recovered from the soil during a summer proceeded by late spring rain. Soil moisture, level of organic matter, and recovery frequency of P. ramorum were measured under California bay, tanoak, and redwood. Soil moisture and level of organic matter were highest under redwood. Yet recovery of P. ramorum was highest under California bay, followed by tanoak, and occasionally under redwood (Fichtner et al. 2007). Spores are the main mechanism of dispersal, therefore understanding and preventing their spread is crucial to management of this disease. P. ramorum dispersal follows a classic dispersal gradient. Most inoculum remains close to the host, and number of propagules decreases with distance from site of formation (Davidson et al. 2005). Yet, there is the possibility of a few propagules being dispersed long distances. This long distance infection can occur in several ways. A dehiscent sporangium blowing above the canopy during a windy rainstorm could initiate an infection far from its origin. There is also the risk of human-involved long distance dispersal. In the forest setting, a viable propagule can get lodged on hikers shoes or bicycle tires (Davidson et al. 2005; Cushman and Meentemeyer 2006). This is especially troublesome in areas of heavy human traffic, such as recreational areas around the San Francisco Bay and the Avenue of the Giants in Humboldt County. Like other aerial Phytophthoras, P. ramorum is transmitted by water splash and windborne rain (Fitt et al. 1989). In the forest, it has been shown that propagules in the soil or leaf litter can infect plant tissue through rain splash (Davidson et al. 2005). It is thought that propagules in both the soil and water are viable for long periods, perhaps six months to over a year (Fichtner et al. 2005).
17 6 P. ramorum has not been observed reproducing on all hosts. Reproductive propagules have not been recovered from the bark of the species most devastated by sudden oak death, coast live oak and tanoak. A low number of sporangia have recently been recovered from symptomatic coast live oak leaves (Vettraino et al. 2008). On the other hand, sporangia are produced readily on California bay leaves. This species is often found in association with coast live oak and tanoak in infected forests (Davidson et al. 2005; Davidson in press). Presence of this species is positively correlated with incidence of Ramorum blight and sudden oak death (Maloney et al. 2005). Ramorum blight is not lethal on California bay. It is thought that dehiscent sporangia produced on California bay can readily infect coast live oak and tanoak in the forest ecosystem (Davidson et al. 2005). Therefore, California bay acts as a recurring source of inoculum (Davidson et al. 2005). Several studies have documented sporulation on other hosts (Davidson and Shaw 2003; Denman et al. 2007; Shishkoff 2007; Vettraino et al. 2007; Davidson in press). Sporulation has been observed on redwood at low frequencies compared to California bay leaves and tanoak branches (Davidson in press). Any level of sporulation can be important though, because while these hosts may not be playing a large role in terms of levels of disease, they may be helping the disease spread through the forest and nurseries. A few studies suggest that sporulation may even be occurring on hosts without any correlation to the extent of symptoms (Denman et al. 2007; Vettraino et al. 2007). The implications of this pose obvious challenges for management. Sequoia sempervirens (D. Don) Endl. (coast redwood) was one of the first nonoak species to be identified as a host for P. ramorum (Maloney et al. 2002; Garbelotto et al. 2003). Though redwood is not affected as intensely as tanoak or coast live oak, it is still a species found through much of the forest infested with sudden oak death. Inoculum levels are high in some of these areas, and an understanding of the relationship between the pathogen and this tree species is crucial for management of the disease. Because of this, as well as because of its economic and cultural value, coast redwood is a worthwhile target of study. Coast redwood has been included in several previous P. ramorum studies, but an in-depth look at the risk P. ramorum poses to coast redwood has not yet been
18 7 carried out (Maloney et al. 2002; Garbelotto et al. 2003; Denman et al. 2005; Hansen et al. 2005; Maloney et al. 2005; Chastagner et al. 2006; Fichtner et al. 2007; Davidson in press). The first report of P. ramorum being isolated from coast redwood leaves in the forest appeared in 2002 (Maloney et al. 2002). The researchers inoculated leaves and stems of seedlings and saplings. Discoloration of leaves adjacent to those inoculated was noted in seedlings. In saplings, discoloration in the xylem above the inoculation point on stems was observed. They also observed narrow streaks in the xylem extending from the discolored areas upward. This is interesting in light of recent evidence that P. ramorum is capable of invading and moving through the vascular system of some hosts. The presence of hyphae in xylem was observed in the roots and stems of Rhododendron using fluorescence and scanning laser confocal microscopy (Parke and Lewis 2007). The pathogen has also been recovered from sapwood above and below the inoculation point on mature tanoak logs, as well as from the sapwood of naturally infected tanoak trees (Parke et al. 2007). Histological samples from tanoak logs have revealed extensive mycelial colonization of xylem vessels (Parke et al. 2007). In Europe, researchers have isolated P. ramorum from the xylem of several naturally infected tree species, including Quercus cerris and Fagus sylvatica (Brown and Brasier 2007). Studies have found a strong correlation between plant tissue discoloration and recovery of P. ramorum (Brown and Brasier 2007; Parke et al. 2007). No work of this kind has yet been attempted on coast redwood. Another important aspect to consider is the level of inoculum detrimental to coast redwood. By exposing seedlings to various levels of inoculum, and establishing a dose response curve for coast redwood, we can determine redwood s susceptibility relative to other conifers. Previous research conducted on Douglas-fir suggests at least 10 4 zoospores/ml are necessary to cause symptoms (Chastagner et al. 2006). This finding could be related back to levels of inoculum found in the natural ecosystem to determine if the level of inoculum necessary to cause infection is present in coast redwood forests. Previous work has been done to quantify levels of inoculum in a mixed-evergreen forest by counting colony forming units (CFU) from collected rainwater (Davidson et al. 2005). The Davidson et al. study (2005), done in Sonoma County, CA, found that
19 8 inoculum was detectable seasonally: present during the winter rains and absent during the hot, dry summers (Davidson et al. 2005). It is unknown if the pattern of seasonal recovery found in Sonoma County, or the levels of inoculum detected, hold true for the slightly cooler and wetter northern infested forests in Humboldt County, CA. In infested redwood forests, no unusual mortality or disease has been reported on overstory redwoods (Maloney et al. 2002; Maloney et al. 2005). However, the pathogen appears to be able to kill sprouts (Maloney et al. 2002). P. ramorum has been detected from a mature coast redwood stump using diagnostic PCR. The presence of other pathogens and abiotic factors, as well as the possibility that P. ramorum propagules landed on the stump after tree removal, made cause of death unascertainable (Garbelotto et al. 2003). The goal of this study was to assess the risk that P. ramorum poses to coast redwood. My objective was approached in two ways. Field experiments were set up in infested areas of the redwood forest in southern Humboldt County, CA. For the duration of one rainy season, I attempted to quantify inoculum levels in rainwater collections at three different field sites using the protocol set forth in Davidson, et al. (2005). I placed redwood seedlings out at each of these field sites to try and determine disease incidence at various times during the year, as well as disease severity in the presence vs. absence of overstory California bay. (See Appendix for more information on field experiments.) The second part of this study involved laboratory experiments carried out at Oregon State University. I assessed susceptibility of coast redwood seedlings by determining pathogen colonization distance in the stem upon artificial inoculation. I also conducted a dose response experiment to determine the minimum inoculum load necessary to cause visible symptoms. Finally, I conducted sporulation trials on both detached and attached redwood branches to determine if sporulation is occurring on this host, as well as estimate sporulation potential on redwood.
20 Materials & Methods 9 Redwood seedlings used for the first trial of the pathogen colonization distance experiment were obtained from Althouse Nursery in Cave Junction, OR in May All other redwood seedlings, used for both lab and field studies, were acquired from Plum Creek Nursery in Cottage Grove, OR in November Seedlings were grown from seed source Coastal , native to Humboldt County, California. Seedlings were received at approximately one year old. All seedlings used for laboratory experiments were potted in gallon pots in a mixture of 90% peat moss and 10% perlite. Seedlings were kept under controlled greenhouse conditions, or outside of the greenhouse during the summer, until used in experiments. Seedlings were watered weekly and fertilized at least two weeks before sporulation experiments. Phytophthora ramorum isolate 4581 was used for all controlled experiments. Isolate 4581 is a North American genotype (NA1 lineage), A2 mating type. Originally this isolate was recovered from the forest in Curry County, Oregon on Rhododendron macrophyllum. Cultures of this isolate were maintained on one-third-strength V8 agar (100 ml clarified V8 juice broth, 1200 ml water, 23.4 g bacto-agar) at room temperature (19-20 C). Pathogen Colonization Distance Coast redwood seedling stems were artificially inoculated in order to determine pathogen colonization distance and assess susceptibility. Both main stems and small side branches were wound inoculated. Pathogen recovery measurements were taken at two different harvest times. Either the main stem or a side branch was inoculated on each seedling. Main stems were inoculated approximately three-quarters of the way up the stem from the soil line. Side branches were chosen from about this height, as well. On the side branches, the
21 10 incision was initiated 3 cm away from the main stem. Initial height and stem caliper were measured for each seedling. Seedlings were inoculated with colonized agar plugs removed from the growing margin of two-week-old colonies growing on one-third-strength clarified V8 juice agar. Controls were inoculated with clean agar plugs from plates of one-third-strength V8. Plugs were 6 mm in diameter. Using a scalpel, the stem was cut to the cambium. Attempts were made to make the slice only slightly longer than the diameter of the plug in order to minimize the wound. Plugs were removed from the plate, placed sideways on an empty plate, and then cut in half with a scalpel. The surface of the thin plug was placed against the inner exposed cambium, and secured against the stem with the external flap of tissue. A piece of wet cheesecloth was placed over the plug, followed by a secure wrapping with parafilm. This experiment was set up as a 2x2x2 factorial with 2 inoculation locations (branch vs. stem) x 2 harvest times (8 vs. 16 week) x 2 trials. This experiment was conducted twice, beginning in June 2006 and again in July For both trials 12 seedlings were used for each main stem or side branch inoculation. For the first trial 10 seedlings were used for each of two control treatments, main stem and side branch inoculations with non-colonized agar plugs. For the second trial only six seedlings were used for each control treatment. Seedlings were kept in a growth chamber at 18 o C and on a 12 h daylight schedule for the duration of the experiments. Seedlings were randomly assigned places in the growth chamber. Half of the seedlings were harvested at 8 weeks and half were harvested at 16 weeks. Evidence of any symptoms and heights of seedlings were recorded. The inoculation point, a stem section of about 15 mm in length, was first removed from the seedling. This chunk was cut into pieces for microscopy, isolation and diagnostic PCR. Samples, 15 mm in length, were taken above and below the inoculation point. For the first trial, the end nearest the inoculation point was cut off for microscopy (approximately 1 mm). The remaining chunk was cut into 4 pieces. Two pieces were used for microscopy, one for isolation, and one for diagnostic PCR. In the second trial, 5 mm samples were taken every 10 mm. These chunks were divided for microscopy, isolation and PCR (see Figure 1).
22 11 For main stem inoculations in the first trial, 5 samples were taken above and 5 below the inoculation site (75 mm from the inoculation site in each direction). For side branch inoculations in the first trial, 3 samples were taken out towards the tip of the branch beyond the inoculation site (45 mm beyond the inoculation site), and the main stem was sampled beyond the location of inoculated branch attachment (3 sections up and 3 down the main stem). During the first trial, main stem samples were P. ramorum positive up to 3 sections away from the inoculation point (45 mm). Therefore, for the second trial main stem inoculations, four 15 mm sections were taken above and below each inoculation point (up to 60 mm from the inoculation site). In the first trial side branch inoculations, only one section beyond the inoculation point was ever P. ramorum positive, and in one case the last main stem section sampled was positive. Therefore, for the second trial side branch inoculations, two 15 mm sections were taken out towards the tip of the branch, 1 towards the main stem, 4 up the main stem, and 4 down the main stem. Isolations were carried out on modified PAR, a Phytophthora-selective medium (17 g cornmeal agar, 10 mg pimaricin, 200 mg ampicillin, and 10 mg rifampicin per 1 L distilled water) (Kennwischer and Mitchell 1978). Plates were examined at 3 days, and every other day up to 2 weeks. P. ramorum colonies were confirmed at 3 weeks by the distinctive hyphal growth pattern, as well as presence of characteristic amber chlamydospores. Tissue samples collected for diagnostic PCR analysis were stored in 2 ml microfuge tubes at -20ºC until processed. DNA was analyzed using a multiplex polymerase chain reaction (amplification of more than one DNA target), and amplification was conducted using the internal transcribed spacer (ITS 4 and 5) region of rdna. The diagnostic primers and methods used were designed for Phytophthora lateralis and are effective in amplifying P. ramorum (Winton and Hansen 2001; Hansen et al. 2005).
23 12 Trial 1 Trial 2 15 mm 5 mm 10 mm Microscopy Isolation PCR Inoculation Site Unsampled 15 mm 10 mm 5 mm Isolation (PCR if isolation negative) Figure 1. Diagram of sampling methods used in each trial of the pathogen colonization distance experiment. Each column represents an inoculated stem and one section above and below the inoculation point. Colors illustrate how sections were partitioned. Sampling was repeated in sections moving away from the inoculation site. Inoculum Density in Relation to Disease Incidence (Dose Response) Ten-day-old cultures, grown out on one-third-strength clarified V8 juice agar, were used to generate zoospore suspensions for inoculations. Plates were flooded with 5 ml of reverse-osmosis (RO) water and scraped with a rubber policeman. This solution was poured into a clean deep Petri dish. Another 5 ml of RO water was added to the original culture, the plate scraped, and solution poured off. Liquid from five plates was combined in one deep Petri dish, for a total of 50 ml of P. ramorum suspension per dish (two dishes total). The two Petri dishes were chilled at 4 o C for one hour to shock sporangia. After an hour dishes were placed at room temperature (18-20 o C) for 45 minutes. Plates were examined under the dissecting microscope to ensure that most
24 13 sporangia had released zoospores. Solutions from the two plates were combined when filtered through a 20 μm nylon mesh screening (Aquatic Eco-systems, Inc. Apopka, FL) filter to remove chlamydospores, hyphal fragments, and most sporangia. Zoospores were quantified from the resultant suspension using a Coulter counter. Preliminary tests were conducted to determine zoospore size range so that all particles within the optimum range (6-14 μm) would be counted. Three counts were taken and averaged from each sample. The counts from the two samples were then averaged to determine final zoospores per ml. To determine the effect of inoculum dose on disease incidence, unwounded branches of redwood seedlings were dipped in a tenfold dilution series of zoospore concentrations, and disease incidence measured. In each of two trials, six seedlings were randomly chosen for each treatment, and one branch from each seedling was dipped in the appropriate concentration of zoospores. Branches were held in the suspension for approximately five seconds. After dipping, branches were bagged and the bags secured around the main stem. For the first trial, conducted in August 2007, the treatments were zoospore concentrations of 4.9 x 10 5, 4.9 x 10 4, 4.9 x 10 3, and 0. To detect the lowest zoospore concentration necessary to cause symptoms, an additional treatment was added to the second trial, conducted in September The zoospore concentrations used for that trial were 3.3 x 10 5, 3.3 x 10 4, 3.3 x 10 3, 3.3 x 10 2, and 0. To confirm viability of propagules in each treatment, detached leaves from rhododendron variety Nova Zembla were dipped in each treatment after all of the redwood branches. These leaves were kept in crispers on moist paper towels, and monitored for symptom development. Seedlings were kept in the growth chamber for three weeks. Seedlings were watered weekly until time of harvest. Upon harvest, inoculated branches were cut off of seedlings. For the first trial, branches were rinsed in a small amount of distilled (DI) water and water was examined for presence of sporangia under the dissecting scope. Presence or absence of sporangia was noted for each seedling in all treatments. Branches were then
25 14 washed in DI water to remove any surface particles for one minute. Each branch was placed on a clean paper towel for further processing. In the second trial, all branches from each treatment (6 branches per treatment) were vortexed in a 50 ml Falcon tube with DI water for approximately 15 seconds. Branch washings were examined for sporangia using the same procedure outlined for sporulation experiments. The branches were then rinsed with DI water for one minute. Branches were placed on a flatbed scanner and branches scanned. The scanner was sterilized with 70% EtOH between samples. Care was taken to ensure that tissue from different samples did not come into contact. Both the first and second trials were identically harvested from this point forward. Individual samples were photographed and symptoms noted. For each branch, up to 5 symptomatic needles and up to 5 pieces of symptomatic stem tissue were chosen and plated on PAR. Three asymptomatic needles and 2 asymptomatic stem tissue pieces were chosen for plating as well. If no symptomatic tissue was present, 5 asymptomatic needles and 5 stem pieces were chosen and plated. Plates were examined at 5, 7, and 14 days. P. ramorum colonies were confirmed by the distinctive growth pattern as well as presence of amber chlamydospores. Samples that were negative for P. ramorum were then transferred to microtubes and frozen for further testing using diagnostic PCR. The relationship between inoculum concentration and disease incidence was examined using a logistic model. Results from the two trials were analyzed using PROCLOGISTIC in the SAS statistical package, v. 9.1 (SAS Institute, Cary, NC). Sporulation Detached Tissue Detached redwood branches and leaves of California bay (Umbellularia californica) were inoculated by dipping in a zoospore suspension. Suspension was generated from 14-day-old colonies grown out on one-third strength V8. Zoospores were generated following the protocol previously described. The concentration of zoospores/ml was measured using a hemacytometer.
26 15 Sporulation was measured on 100 young, succulent redwood branches, 100 mature redwood branches, and 100 California bay leaves. After dipping, samples were placed, abaxial side up, in crispers on damp paper towels. Each crisper contained 10 samples. Young redwood, mature redwood, and bay leaves were kept in separate crispers to prevent contamination between treatments. Half the samples were measured within 24 hours to determine initial levels of sporangia on redwood and bay leaves inoculated with this method. The other half of the samples was measured 10 days after inoculation. The branches and leaves that were sampled at 10 days were misted daily with DI water until harvest. This experiment was conducted in November 2007 and January Each sample was rinsed in a 50 ml Falcon tube containing 10 ml DI water. The tube was vortexed for 15 seconds. All 10 samples from an individual crisper were rinsed in the same tube. A small amount of CuSO4 was added to each Falcon tube to stop biological activity (30 μl of 160 mm CuSO4). Wash solutions were placed at 4 o C until filtering. Within 24 hours, the suspension was resuspended and a vacuum pulled through a 20 μm nylon mesh screening. This filter pore size is small enough to catch most sporangia. A few drops of 0.01% Calcofluor White M2R (Tinopal) (Sigma Chemical, St. Louis, MO) were added to the filter before counting sporangia with a Zeiss Axiostar epifluorescence compound microscope with a Calcofluor filter specific for excitation of 425 nm. Images of the filters were collected using a Micropublisher 3.3 RTV digital camera and Q-Capture Pro imaging software (see Figure 2). Four random fields of view were chosen per filter for counting sporangia. These sporangial counts were averaged, the field of view measured, and the number of sporangia/mm 2 determined. By determining the area of the entire filter, total number of sporangia per filter was extrapolated. The 10 samples, from a particular crisper, were then scanned and this image was used to determine total leaf area in ASSESS image analysis software (see Figure 3) (APS Press, St. Paul, MN). The number of sporangia per cm 2 plant tissue or lesion area was used for comparison between treatments.

27 Figure 2. An example of fluorescing sporangia on a filter after Calcofluor was added. Sporangia were averaged from 4 fields of view per filter in order to calculate sporangia densities in both detached and attached leaf experiments. 16


28 Figure 3. Sporulation on detached leaves and branches. 10 samples, from a particular crisper, were scanned and this image was used to determine total leaf area and lesion area in ASSESS image analysis software. From left to right: California bay, mature redwood, and young redwood. 17
29 Sporulation Attached Tissue 18 Redwood branches were inoculated by submergence in a zoospore suspension for 12 h. The suspension was generated from 14-day-old colonies grown out on one-third strength V8. Zoospores were generated following the protocol previously described. Zoospores/ml was measured using a hemacytometer. The tips of branches, containing succulent new growth, as well as an approximately equal amount of mature tissue adjacent to the new growth were marked with a Sharpie and placed in 50 ml Falcon tubes attached to the seedling. Tubes were filled with 20 ml of zoospore suspension (see Figure 4). After 12 h, the tubes were removed, plastic bags were gently placed over the branch and taped closed around the main stem (see Figure 4). Bags contained approximately 1 ml of DI water to ensure high humidity. 48 hours before harvest a small cut was made in the plastic bag, and branches were gently misted. Nine seedlings were used in each of two trials. Five branches were chosen per seedling, 4 were submerged in zoospore suspension, and the fifth was submerged in DI water for the control. Both trials were conducted in January 2008.
. Branches were harvested 10 days after inoculation.")

30 19 Figure 4. Sporulation on attached branches: inoculation and incubation methods. Branches were submerged in 20 ml of zoospore suspension for 12 hours (on the left). After 12 hours, plastic bags were gently placed over the branch and taped closed around the main stem (on the right). Branches were harvested 10 days after inoculation. For each of the 4 inoculated branches on a seedling, new growth and mature growth were carefully separated. All new growth from each seedling was rinsed in one 50 ml Falcon tube, while all the mature growth was rinsed in another 50 ml Falcon tube. The control branch was rinsed in a third 50 ml Falcon tube. Sporangia were removed from branches and counted following the protocol previously described for the detached branch assay. Sporangia densities (sporangia/cm 2 ) over total plant tissue and lesion area were compared between young and mature redwood growth.
31 Results 20 Pathogen Colonization Distance Although the experiment was set up as a 2 x 2 x 2 factorial, an analysis of variance could not be used because of a discrete response variable (presence or absence of P. ramorum), data with a heavily skewed distribution, unequal sample sizes that are small, and many zeroes as responses. Therefore, a nonparametric statistical analysis, the Wilcoxon Rank-Sum Test, was used to test for differences between trials, colonization distance and sampling time. P-values are reported from the Monte Carlo Exact Estimate Test. If no significant difference was detected between trials, they were then lumped together and tested for a significant difference between sampling times. For main stem inoculations, no significant difference was found between trials or sampling time. Therefore, all main stem inoculation data were pooled together for frequency of inoculations that resulted in different colonization distances. Five inoculated seedlings were both isolation and PCR negative at the inoculation site; therefore they were not included in the results. Lesion lengths were not measured due to the difficulty in determining the difference between lesions and typical redwood growth. Discoloration in the xylem was observed in both inoculated and control seedlings. No tissue from any of the 16 main stem controls was P. ramorum positive by isolation or PCR. Generally, P. ramorum did not colonize tissue very far from the inoculation site in the main stem (see Table 1). The median colonization distance was 0 mm. In 58% of seedlings, the pathogen was not recovered beyond the inoculation site and in only 3 of 19 replicates did the pathogen colonize tissue beyond 15 mm. The furthest distance from which the pathogen was recovered was 60 mm; this occurred in 2 of 19 seedlings. In one of these two seedlings the pathogen colonized tissue 30 mm above and 30 mm below the inoculation site for a total distance of 60 mm. In the other seedling the pathogen colonized tissue below the inoculation site to a distance of 60 mm.
32 Table 1. The total distance of Phytophthora ramorum colonization within stems, isolation and PCR results reported separately, from artificially inoculated seedlings. Results from 8 and 16 week sampling times combined. Maximum Colonization Main Stem (Trials combined) a Side Branch (Trial 1) b Side Branch (Trial 2) b Distance (mm) Isolation c PCR c Isolation c PCR c Isolation c PCR c 0 10/19 1/19 0/12 1/12 6/12 0/ /19 1/19 1/12 2/12 3/12 1/ /19 0/19 1/12 6/12 1/12 0/ /19 0/19 0/12 0/12 1/12 0/ /19 1/19 0/12 0/12 0/12 0/ /19 0/19 0/12 0/12 0/12 0/ /19 0/19 0/12 1/12 0/12 0/12 a The frequency of main stem inoculated seedlings, out of the total 19, at each maximum colonization distance. No significant difference was found in recovery distance between trials or sampling times (8 vs. 16 weeks) for main stem inoculated seedlings, therefore these are all reported together b The frequency of side branch inoculated seedlings at each maximum colonization distance, out of 12 for each trial. A significant difference was found between trials 1 and 2, therefore these results are reported separately. c Maximum colonization distance determined by either isolation or diagnostic PCR. In cases where isolation and PCR were both positive at the farthest distance, then the results are reported as isolation positive. Isolation + PCR = total number of seedlings positive at each maximum colonization distance. 21 For side branch inoculations, differences between trials within each sampling time were not significantly different, nor was there a significant difference between sampling times within trials. When data from the two sampling times were combined, and trials compared, there was a significant difference (two-sided p-value =.0092). Therefore, results for farthest pathogen colonization distance were kept separate for the two trials (see Table 1 and Figure 5). Lesion length was not measured on branches due to the difficulty in determining the difference between lesions and typical redwood growth or the entire branch became necrotic (see Figure 6). No tissue from any of the 16 side branch controls was P. ramorum positive by isolation or PCR.
33 22 8 Trial 1 7 Trial 2 6 Number of Seedlings Farthest Recovery Distance (mm) Figure 5. Maximum distance colonized by P. ramorum in inoculated side branches: trial 1 vs. trial 2.

. Overall, the maximum colonization distance was 90 mm; this occurred in 1 of 12 seedlings.")
34 23 Figure 6. The branch on the left was inoculated with P. ramorum vs. the branch on the right was a wounded control. Both were from the second trial, 16 week sampling time. Lesion length was not measured on branches due to the difficulty in determining the difference between lesions and typical redwood growth. Discoloration may also have been caused by a wound response irrespective of the presence of P. ramorum. In the first trial, the maximum distance colonized by P. ramorum was 30 mm beyond the inoculation site in a majority of inoculated side branches (58 %). Overall, the maximum colonization distance was 90 mm; this occurred in 1 of 12 seedlings. In this seedling, 15 mm of tissue was colonized above the inoculation site (isolation negative, but PCR positive) and 75 mm of tissue was colonized below the inoculation site (isolation positive), 45 mm down the main stem. No visible symptoms were observed on the outside of the stem, but discoloration in the wood was present in tissue beyond pathogen recovery. Discoloration was observed in wood beyond pathogen recovery in several samples (see Figure 7). The pathogen was limited to the inoculation site in only 1 replicate of the first trial. Median maximum colonization distance in the first trial was greater than in the second trial, 30 mm vs. 7.5 mm, respectively. In the second trial, the


35 24 pathogen was limited to the inoculation site in 50% of seedlings. In this trial, the maximum distance from which the pathogen was recovered was 45 mm, from 1 of 12 seedlings. Overall, the pathogen spread beyond 45 mm in one of the 24 inoculated side branches. Figure 7. Discoloration in wood from a sample colonized by P. ramorum (on the left) and beyond pathogen recovery (on the right). Both samples are main stem cross-sections from the same side branch inoculated seedling. The sample on the left was located a total of 30 mm below the inoculation site, and 15 mm below the attachment of the inoculated branch to the stem. The sample on the right was located 45 mm below the attachment of the inoculated branch to the stem. Severity of symptoms on inoculated side branches differed between trials. In the first trial, 10 of the 12 inoculated side branches were dead by harvest time. In the second trial, only 1 branch died by harvest time. Stem caliper at the inoculation point of each seedling was recorded. The mean stem diameter for trial 1 was 2.5 mm (SE =.15). When the experiment was repeated, 54 weeks later, the mean stem diameter was 3.0 mm (SE =.12) for the second trial. This difference was significant (t-test, two-sided p-value =.013). Because the second trial was conducted a year after the first trial, seedlings in the second trial were larger and in general more vigorous.
36 25 Inoculum Density in Relation to Disease Incidence (Dose Response) Symptoms first appeared on redwood seedlings 7 days after inoculation. Seedlings were destructively sampled 3 weeks after inoculation. Symptoms varied from a few necrotic needles to dramatic shoot dieback. New growth was more susceptible than more mature growth. Symptoms were more extensive on the new succulent growth of the branches, though P. ramorum was isolated from mature needles and stem tissue. Overall, symptoms were more extensive on infected seedlings in the second trial (see Figure 8). All seedlings inoculated with the highest doses, 4.9 x 10 5 and 3.3 x 10 5 zoospores/ml, were isolation positive, though results from lower doses were inconsistent within and between trials. In the first trial, P. ramorum was isolated from all 6 seedlings inoculated with the highest dose, 4.9 x 10 5 zoospores/ml. None of the seedlings inoculated with 4.9 x 10 4 zoospores/ml were isolation positive, though PCR analysis of symptomatic stem tissue from one seedling was positive. Two seedlings inoculated with 4.9 x 10 3 zoospores/ml were isolation positive, and one additional seedling was PCR positive from symptomatic needles. In the second trial, P. ramorum was isolated from all 6 seedlings inoculated with 3.3 x 10 5 zoospores/ml. Four of 6 seedlings inoculated with 3.3 x 10 4 zoospores/ml were isolation positive. This was the lowest dose yielding isolation or PCR positive results (see Table 2). Necrotic needles were isolation positive from 14 of the 22 infected seedlings. Necrotic stem tissue was isolation positive from 12 of the 22 seedlings. Asymptomatic stem tissue was isolation positive from 4 of the 20 seedlings (see Table 2). None of the asymptomatic needles sampled were positive.


.")


37 Figure 8. Symptomatic branches from dose response. Top row: The three most symptomatic branches from the first trial at dosages: 4.9x10 5, 4.9x10 3, 4.9x10 3 zoospores/ml (left to right). Bottom row: The three most symptomatic branches from the second trial at dosages: 3.3x10 5, 3.3x10 5, 3.3x10 4 zoospores/ml (left to right). 26