Supplementary Materials for
|
|
|
- Kristina Rose
- 5 years ago
- Views:
Transcription
1 advances.sciencemag.org/cgi/content/full/4/9/eaat5401/dc1 Supplementary Materials for GLK-IKKβ signaling induces dimerization and translocation of the AhR-RORγt complex in IL-17A induction and autoimmune disease Huai-Chia Chuang, Ching-Yi Tsai, Chia-Hsin Hsueh, Tse-Hua Tan* This PDF file includes: *Corresponding author. Published 12 September 2018, Sci. Adv. 4, eaat5401 (2018) DOI: /sciadv.aat5401 Fig. S1. Normal T cell and B cell development in Lck-GLK Tg mice. Fig. S2. Inflammatory phenotypes and enhanced T H 17 differentiation in Lck-GLK Tg mice. Fig. S3. Autoimmune responses in Lck-GLK Tg mice are abolished by IL-17A deficiency. Fig. S4. GLK transgene does not regulate IL-23 receptor expression, STAT3 phosphorylation, and RORγt-binding element at the 120 region of the IL-17A promoter. Fig. S5. PKCθ controls Ser 36 phosphorylation mediated AhR nuclear translocation and AhRmediated autoimmune responses. Fig. S6. PKCθ directly interacts with AhR in the cytoplasm of Lck-GLK T cells. Fig. S7. Autoimmune responses in Lck-GLK Tg mice are reduced by PKCθ KO. Fig. S8. TCR signaling induces in vivo interaction between AhR and RORγt. Fig. S9. Schematic model of AhR/RORγt-mediated IL-17A transcription in T cells of Lck-GLK Tg mice with different gene-ko backgrounds. Table S1. Transcription factors of NF-κB mediated cytokines. References (58, 59)

2 Supplementary Figures:
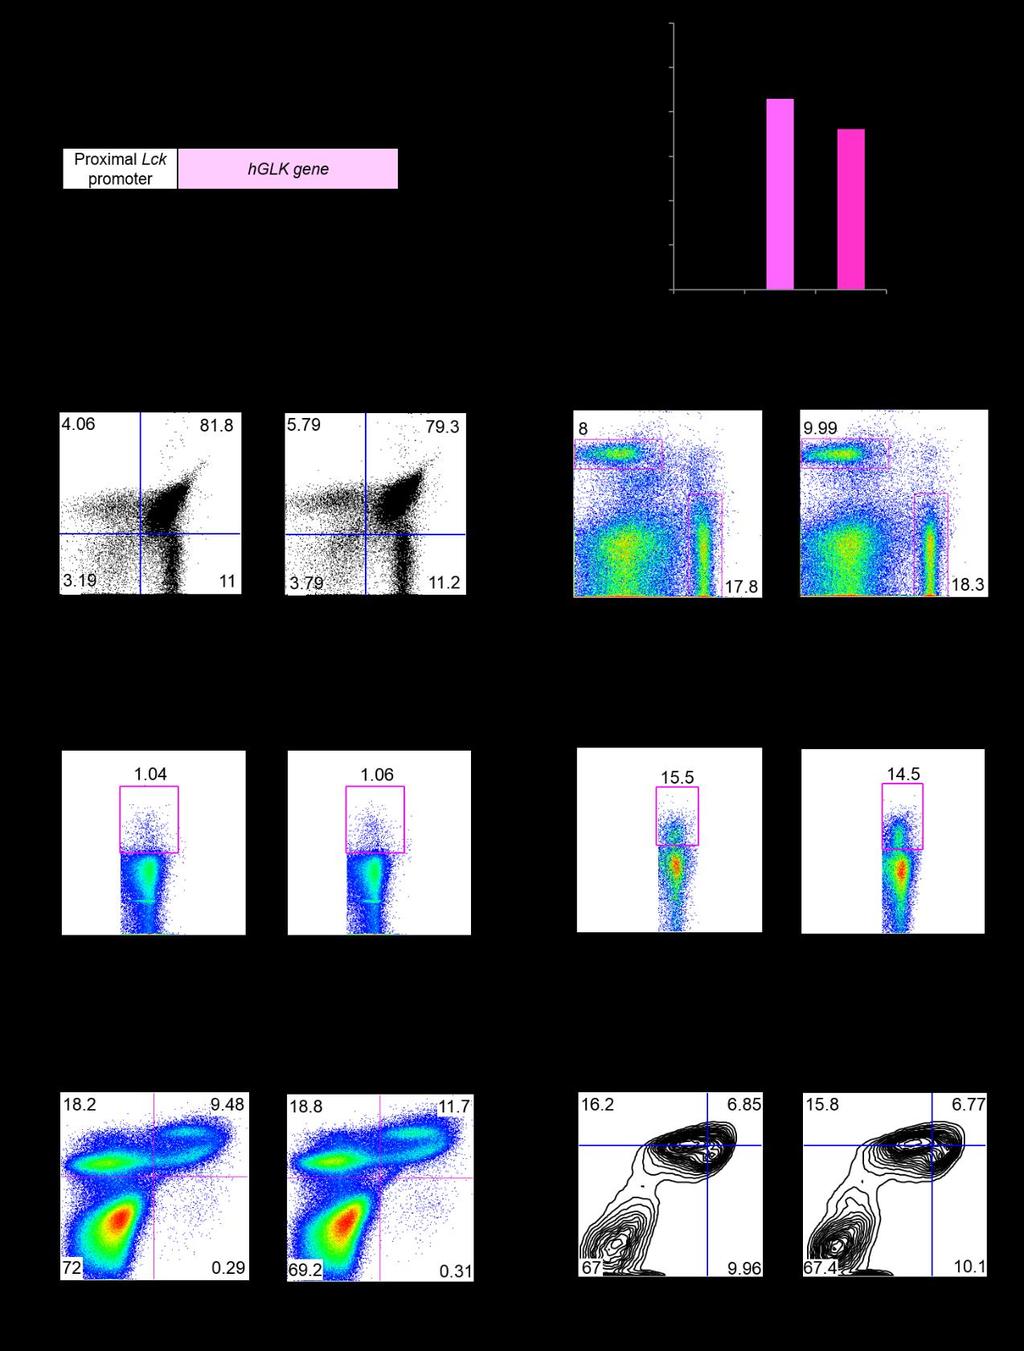
3 Fig. S1. Normal T cell and B cell development in Lck-GLK Tg mice. (A) Schematic diagram of the Lck-GLK construction. (B) Real-time PCR analyses of transgenic human GLK (hglk) mrna levels in murine splenic T cells from 5 mice per group. The expression levels of hglk were normalized to Srp72 levels. The fold changes are presented relative to the value of wild-type mice. Means ± SEM are shown. WT, wild-type littermate controls; Lck-GLK, T-cell-specific GLK transgenic mice. #1 denotes the Lck-GLK Tg mouse line 1. #2 denotes the Lck-GLK Tg mouse line 2. (C-F) Flow cytometry analyses of T cells (C, D) and Treg cells (E, F) from the thymus, spleen, or peripheral blood of 5-week-old wild-type or Lck-GLK transgenic mice. (G and H) Flow cytometry analyses of B220 + B cells from the bone marrow (G) or spleen (H) of wild-type or Lck-GLK transgenic mice. WT, wild-type littermate controls; Lck-GLK, T-cell-specific GLK transgenic mice. Data shown are representatives of three independent experiments.
4
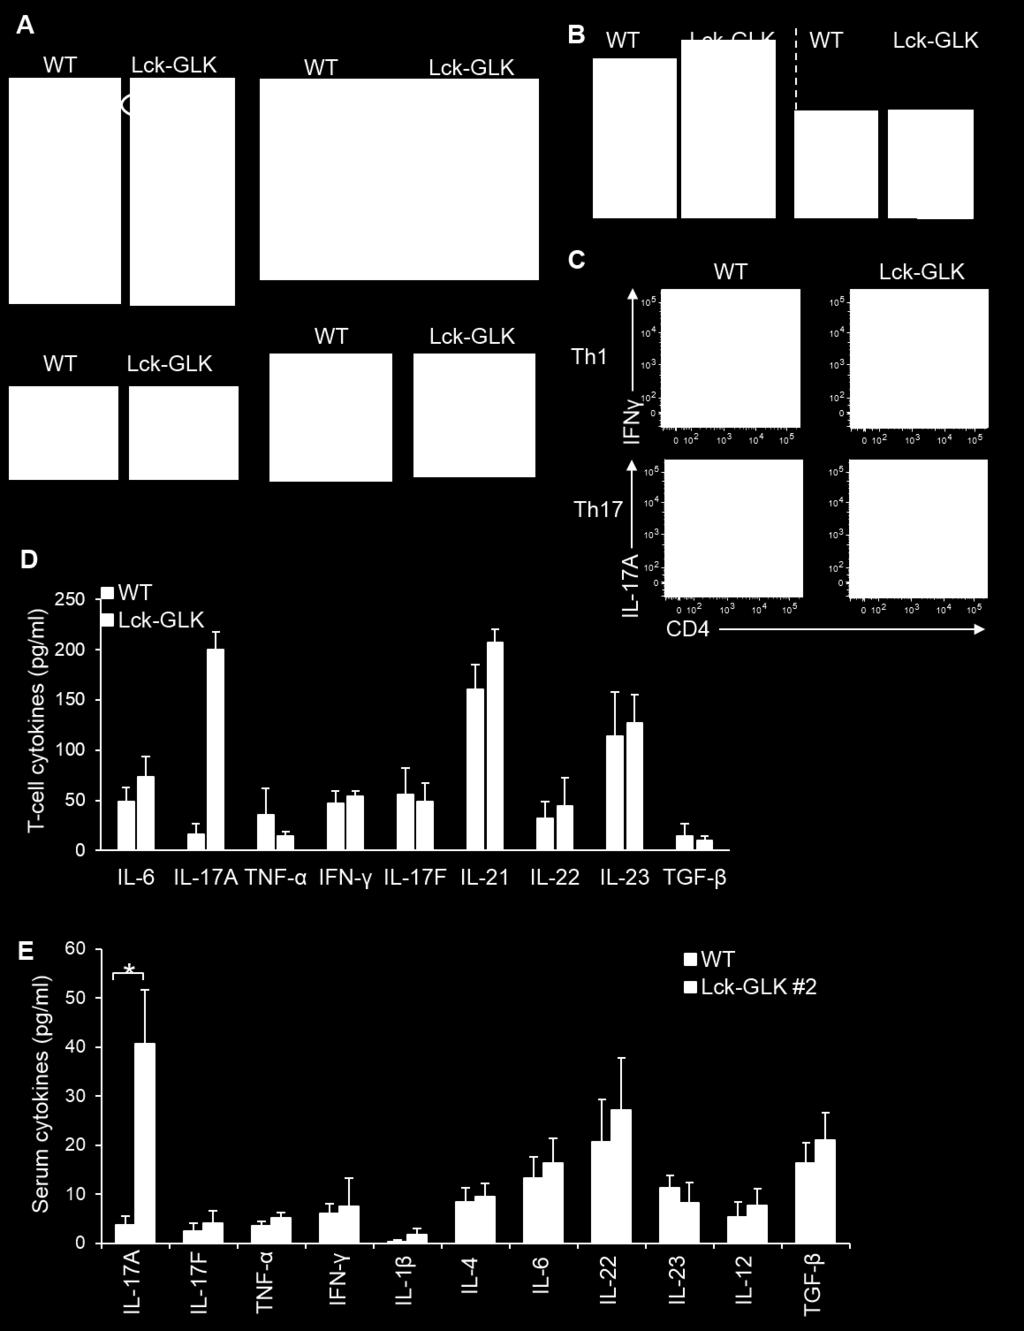
5 Fig. S2. Inflammatory phenotypes and enhanced T H 17 differentiation in Lck-GLK Tg mice. (A) Inflammatory phenotypes of 16-week-old Lck-GLK transgenic mice. The inflammatory phenotypes include paralyses of the hind-limb and tail, clouding of the eye, and symptoms of proctitis and dermatitis. (B) Enlargement of the spleen (left panel) and kidney (right panel) in 16-week-old Lck-GLK transgenic mice. Bar, 1 cm. WT, wild-type littermate controls; Lck-GLK, Lck-GLK transgenic mice. (C) Th17 but not Th1 differentiation in vitro is enhanced by GLK transgene. Flow cytometry of IFN-γ-producing and IL-17A-producing CD4 + T cells. Data are presented as mean ± SEM. Numbers inside outlined areas indicate percent cells in each subpopulation. Data were collected with FACSCanto II (BD Biosciences) and analyzed using FlowJo software. (D) The cytokine levels in T-cell supernatants were determined using ELISA assays. Primary splenic T cells from wild-type or Lck-GLK Tg mice were cultured for 72 h without any stimulation. Means ± SD are shown. n = 3 per group. (E) The serum levels of cytokines in 4-week-old mice were determined using ELISA assays. WT, n = 10; Lck-GLK, n = 7. WT, wild-type littermate controls; Lck-GLK, T-cell-specific GLK transgenic mice. #2 denotes the Lck-GLK Tg mouse line 2. *, P value < 0.05 (two-tailed Student s t-test).
 The serum levels of cytokines in 4-week-old Lck-GLK transgenic and Lck-GLK/IL-17A KO mice were determined by ELISA assays. n = 6 per group. Means ± SEM are shown. **, P value < 0.")
6 Fig. S3. Autoimmune responses in Lck-GLK Tg mice are abolished by IL-17A deficiency. (A) The serum levels of cytokines in 4-week-old Lck-GLK transgenic and Lck-GLK/IL-17A KO mice were determined by ELISA assays. n = 6 per group. Means ± SEM are shown. **, P value < 0.01 (two-tailed Student s t-test). (B) Hematoxylin and eosin-stained sections of indicated organs from 16-week-old mice. Bar, 100 μm. Lck-GLK, T-cell-specific GLK transgenic mice; Lck-GLK/IL-17A KO, Lck-GLK transgenic mice bred with IL-17A-deficient mice.
 Immunoblotting analyses of IL-23 receptor (IL-23R) and Actin in splenic T cells isolated from wild-type or Lck-GLK transgenic mice.")
 are representatives of three independent experiments.")
7 A B C Fig. S4. GLK transgene does not regulate IL-23 receptor expression, STAT3 phosphorylation, and RORγt-binding element at the 120 region of the IL-17A promoter. (A) Immunoblotting analyses of IL-23 receptor (IL-23R) and Actin in splenic T cells isolated from wild-type or Lck-GLK transgenic mice. (B) Immunoblotting analyses of phosphorylated STAT3 (Tyr-705), STAT3, and Tubulin in unstimulated or IL-6 (1 μg/ml)-stimulated splenic T cells isolated from wild-type or Lck-GLK transgenic mice. WT, wild-type littermate controls; Lck-GLK, T-cell-specific GLK transgenic mice. Data shown (a and b) are representatives of three independent experiments. (C) Luciferase activity of IL-17A reporter assays in Jurkat T cells co-transfected with empty vector or GLK plasmid plus the IL-17A promoter construct containing a mutated binding element for either RORγt (-120) or RORγt (-877). Means ± SEM of three independent experiments are shown.

8
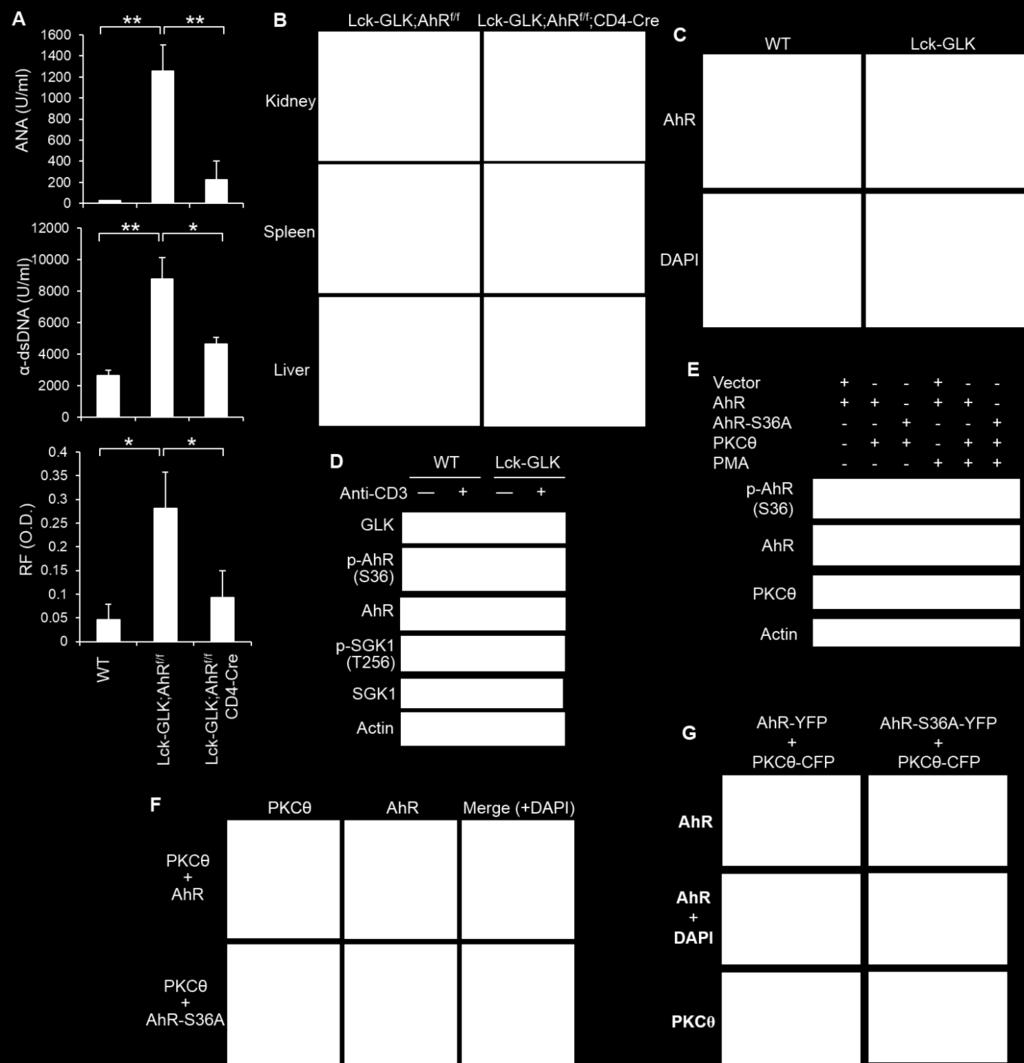
9 Fig. S5. PKCθ controls Ser 36 phosphorylation mediated AhR nuclear translocation and AhR-mediated autoimmune responses. (A and B) Attenuation of autoimmune responses in Lck-GLK transgenic mice by AhR conditional knockout. The serum levels of autoantibodies from 16-week-old mice were determined by ELISA assays (A). n = 8 per group. Means ± SEM are shown. Hematoxylin and eosin-stained sections of indicated organs from 16-week-old mice (B). (C) Confocal microscopy analyses of subcellular localization of AhR in murine splenic T cells without any stimulation. An anti-ahr antibody (#sc-5579, Santa Cruz) was used. Original magnification, 630; bar, 10 μm. (D) Immunoblotting analyses of phosphorylated AhR (Ser-36), phosphorylated SGK1 (Thr-256), AhR, SGK1, GLK, and Actin in primary splenic T cells of wild-type and Lck-GLK transgenic mice. (E) Antibody specificity of the anti-phospho-ahr (Ser-36) was demonstrated by immunoblotting using HEK293T cells co-transfected with Myc-tagged PKCθ plus either HA-tagged AhR WT or AhR-S36A mutant. (F) Confocal microscopy analyses of subcellular localization of AhR and PKCθ in Jurkat T cells co-transfected with PKCθ plus either HA-tagged AhR WT or AhR-S36A mutant. Original magnification, 630; bar, 10 μm. (G) Confocal microscopy analyses of subcellular localization of CFP-tagged PKCθ and either YFP-tagged AhR or YFP-tagged AhR-S36A mutant in co-transfected HEK293T cells stimulated with PMA. Original magnification, 630; bar, 10 μm. Data shown are representatives of three independent experiments.
10
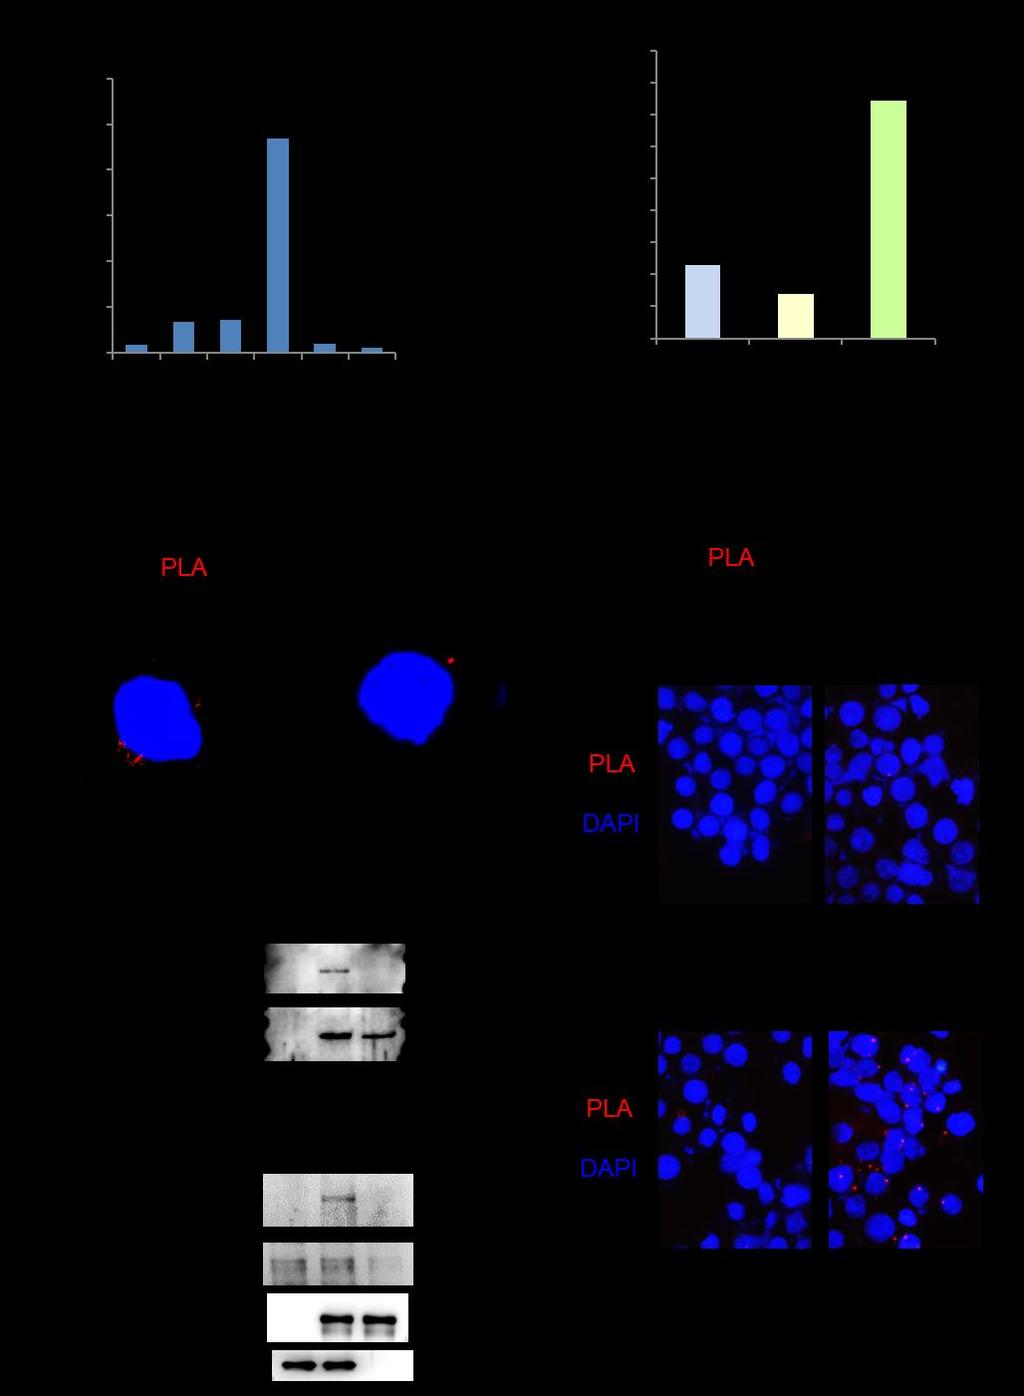
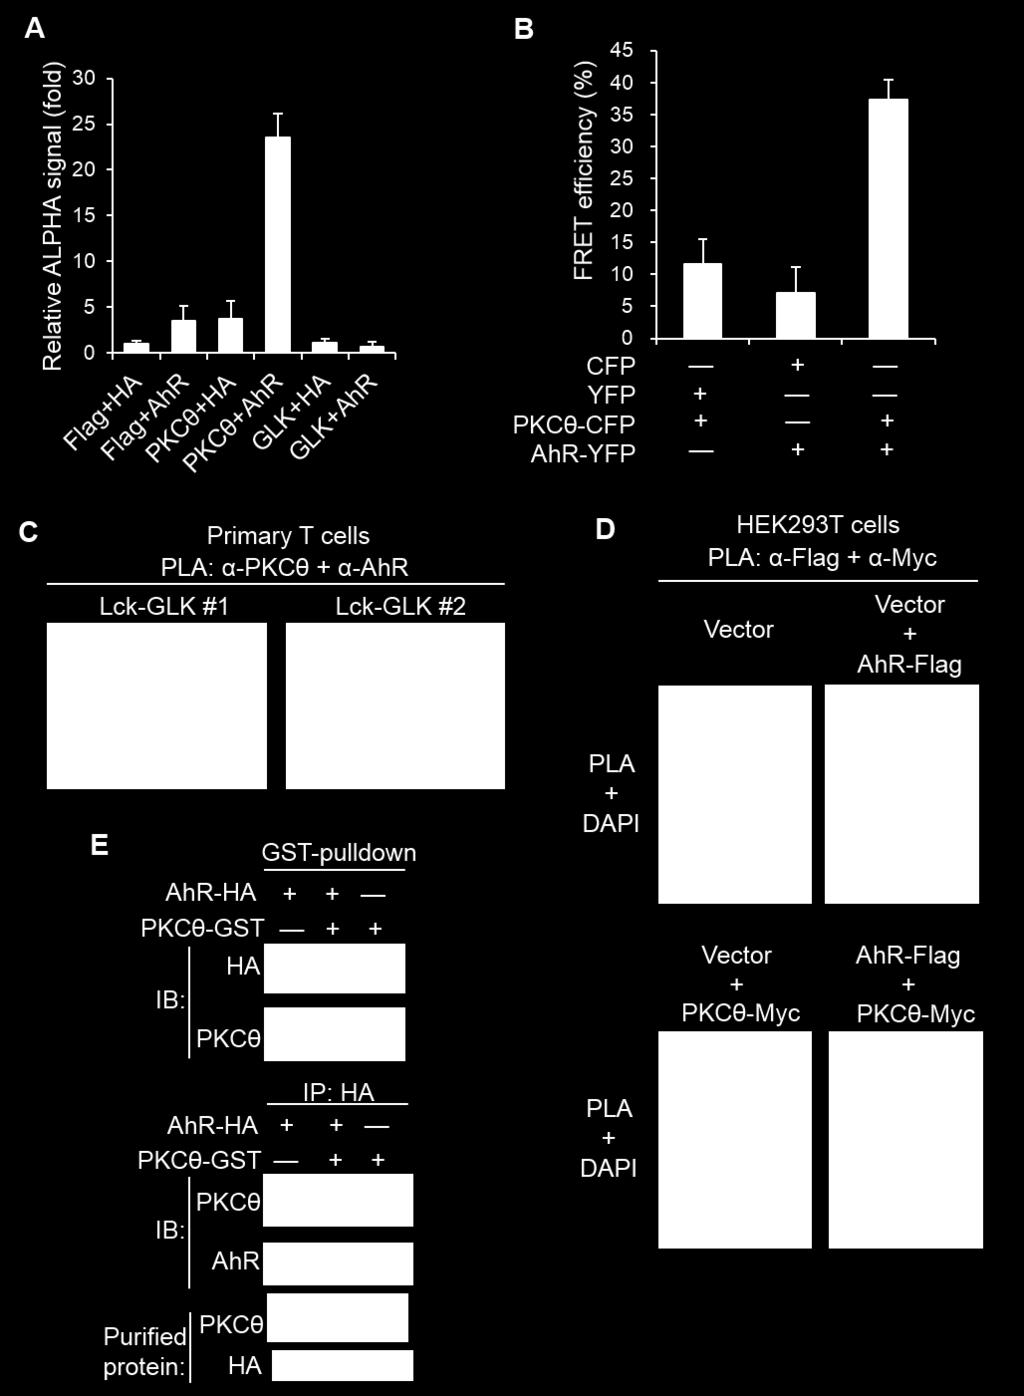
11 Fig. S6. PKCθ directly interacts with AhR in the cytoplasm of Lck-GLK T cells. (A) Signals of the interaction (< 200 nm) between HA-AhR and Flag-PKCθ in lysates of HEK293T cells determined by amplified luminescent proximity homogeneous assays (ALPHA). Means ± SEM are shown. (B) Fluorescence resonance energy transfer (FRET) analysis of the direct interaction (1-10 nm) between CFP-tagged PKCθ and YFP-tagged AhR in live Jurkat T cells. Means ± SEM are shown. (C) Confocal microscopy analyses of proximity ligation assays (PLA) signals from the interaction (< 40 nm) between endogenous PKCθ and AhR in two different peripheral blood T cells (#1 and #2) of Lck-GLK Tg mice. Each red dot represents for a direct interaction. Images were captured with 630 original magnification by Leica TCS SP5 Ⅱ confocal microscope. Cell nucleus was stained with DAPI. (D) Proximity ligation assays (PLA) of interaction between Myc-tagged PKCθ and Flag-tagged AhR in HEK293T cells. Images were captured with 400 original magnification by Leica DM2500 fluorescence microscope. Cell nucleus was stained with DAPI. (E) In vitro binding assays of purified HA-tagged AhR and GST-tagged PKCθ proteins. WT, wild-type mice; Lck-GLK, T-cell-specific GLK transgenic mice. Data shown are representatives of three independent experiments.
12
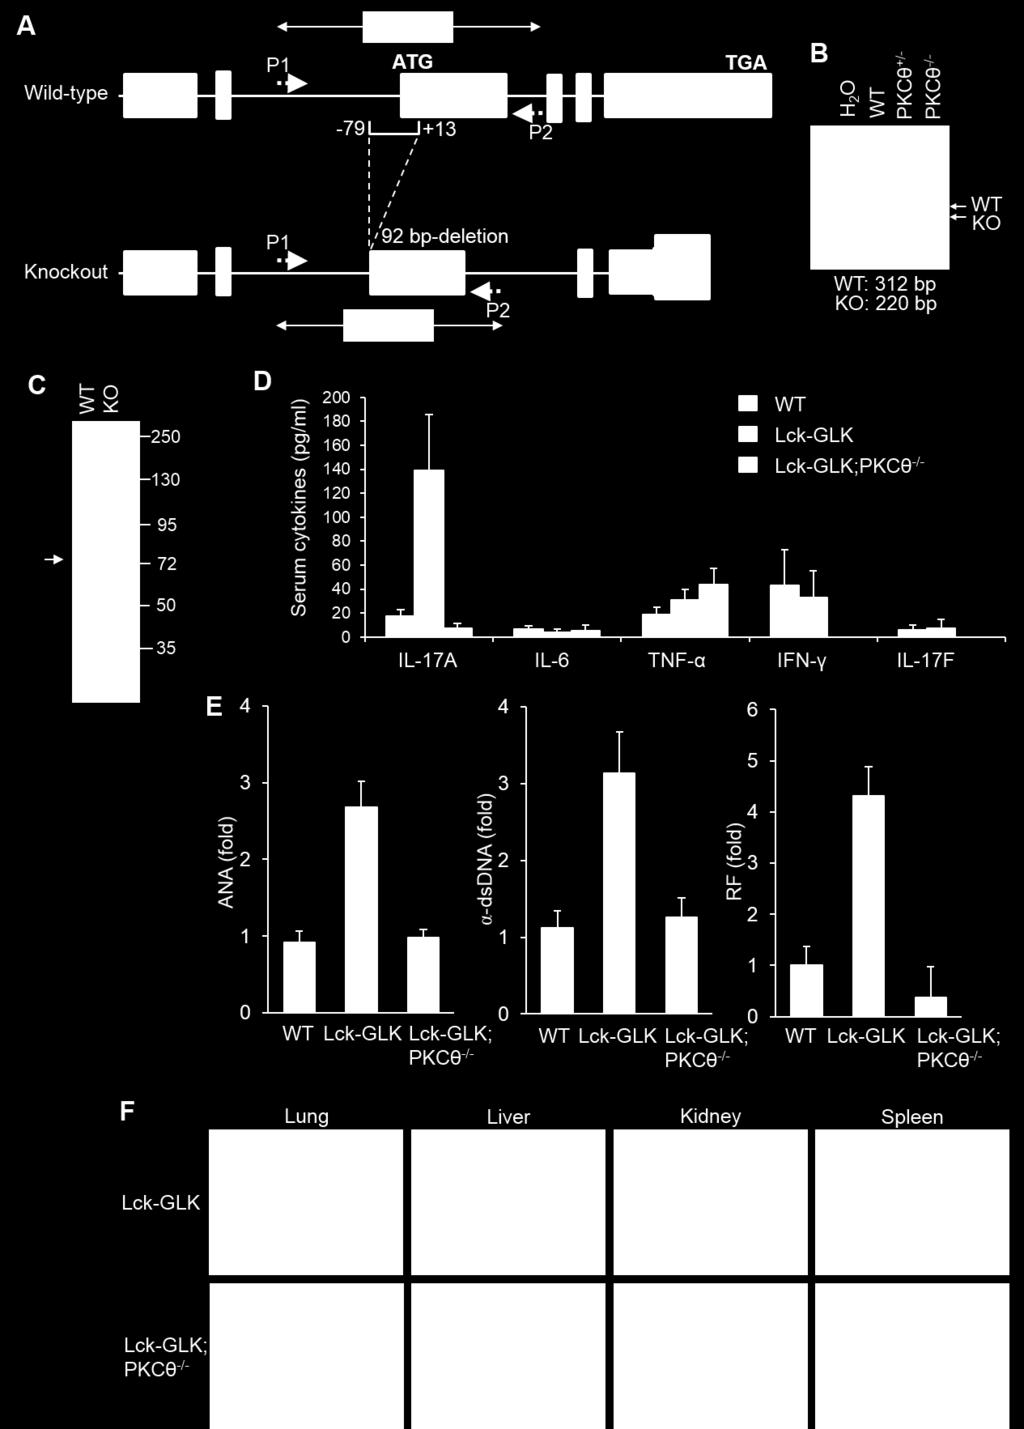
13 Fig. S7. Autoimmune responses in Lck-GLK Tg mice are reduced by PKCθ KO. (A to C) Generation and characterization of PKCθ knockout mice. Schematic diagram of the mouse PKCθ wild-type allele and the targeted PKCθ mutant allele (A). PKCθ knockout mice were generated by TALEN-mediated gene targeting. The deletion of 92 bp including the translation initiation codon (AUG) results in a 33 amino acid frame-shift mutant. P1 and P2, the primers for PCR. See the Methods for the details. PCR analyses of PKCθ wild-type and mutant allele using the genomic DNAs from mouse tails (B). The PCR product of the upper band (312 bp) denotes wild-type (WT) allele, and the lower band (220 bp) denotes PKCθ mutant allele. Immunoblotting of PKCθ expression in purified splenic T cells of wild-type (WT) or PKCθ knockout (KO) mice (C). (D to F) Reduction of GLK-induced autoimmune responses by PKCθ knockout. The serum levels of cytokines (D) and autoantibodies (E) in 16-week-old mice were determined by ELISA assays. n = 5 per group. Means ± SEM are shown. The autoantibody levels are presented relative to the value from one of wild-type mice. Hematoxylin and eosin-stained sections of indicated organs from 16-week-old mice (F). Bar, 100 μm. WT, wild-type littermate controls; Lck-GLK, T-cell-specific GLK transgenic mice; Lck-GLK;PKCθ -/-, Lck-GLK transgenic mice bred with PKCθ knockout mice. ANA, anti-nuclear antibody; α-dsdna, anti-dsdna antibody; RF, rheumatoid factor. Data shown are representatives of three independent experiments.
 Confocal microscopy analyses of proximity ligation assays (PLA) for the interaction between endogenous AhR and RORγt")
.")
14 Fig. S8. TCR signaling induces in vivo interaction between AhR and RORγt. (A and B) Confocal microscopy analyses of proximity ligation assays (PLA) for the interaction between endogenous AhR and RORγt (A) or between endogenous AhR and phosphorylated RORγt (B) in murine primary T cells. T cells were stimulated with anti-cd3 antibodies plus streptavidin (3 μg each per ml). Each red dot represents for a direct interaction. T-cell nucleus was stained with DAPI (blue color). Original magnification, 630; bar, 10 μm.
15
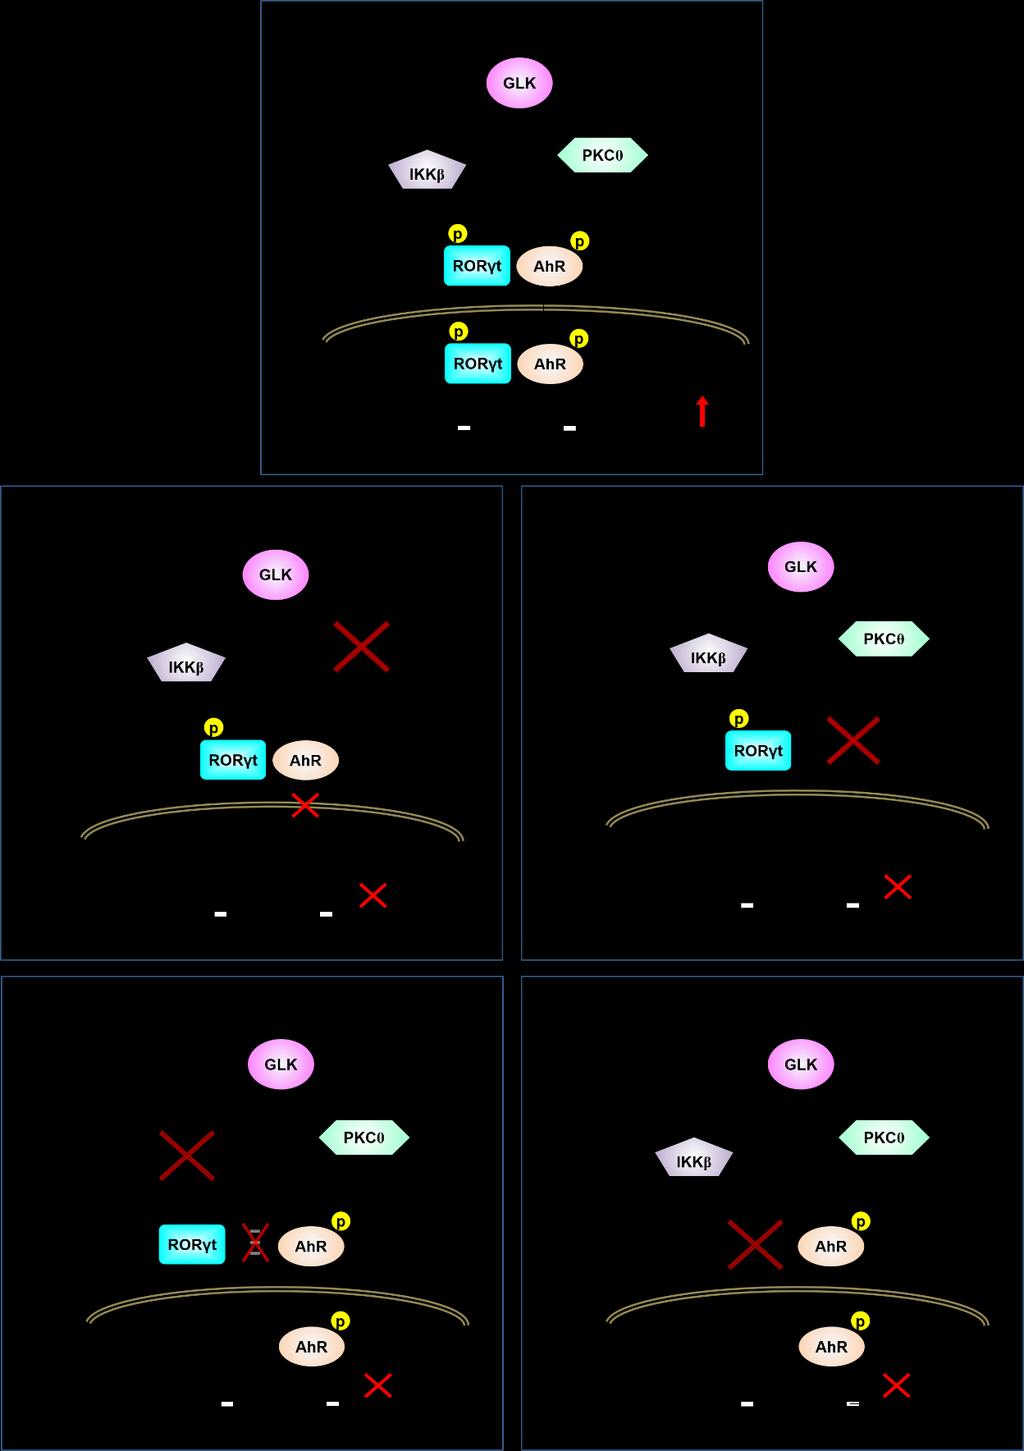
16 Fig. S9. Schematic model of AhR/RORγt-mediated IL-17A transcription in T cells of Lck-GLK Tg mice with different gene-ko backgrounds. (A) GLK overexpression in T cells of T-cell-specific GLK transgenic (Lck-GLK Tg) mice induces AhR Ser-36 phosphorylation through PKCθ and also induces RORγt Ser-489 phosphorylation through IKKβ. Once RORγt is phosphorylated, RORγt directly interacts with AhR. Phosphorylated AhR is responsible for transporting RORγt into cell nucleus. The RORγt-AhR complex binds to both the RORγt-binding element (-877~ -872) and AhR-binding element (-254~ -249) of the IL-17A promoter, leading to induction of IL-17A transcription and subsequent IL-17A-mediated autoimmune responses. (B) In T cells of Lck-GLK Tg plus AhR conditional knockout (cko) mice, RORγt cannot be transported into the nucleus. (C) In T cells of Lck-GLK Tg plus PKCθ knockout mice, AhR Ser-36 is not phosphorylated and AhR localizes exclusively in the cytoplasm. Phosphorylated RORγt interacts with AhR, but cannot be transported into the nucleus. (D) In T cells of Lck-GLK Tg plus IKKβ conditional knockout (cko) mice, RORγt Ser-489 is not phosphorylated. Unphosphorylated RORγt cannot interact with AhR, thus, cannot be transported into the nucleus by AhR. In contrast, only AhR translocates into the nucleus. In IKKβ cko T cells, IL-17A induction is abolished. TCR-induced production of multiple cytokines (IL-2, IFN-γ, IL-4, IL-6, and TNF-α) are reduced in IKKβ cko T cells due to inactivation of NF-κB. (E) In T cells of Lck-GLK Tg plus RORγt cko mice, AhR is expected to translocate into the nucleus. In T cells of RORγt cko mice, only IL-17A production is abolished, whereas NF-κB-mediated cytokines (IL-2, IFN-γ, IL-4, IL-6, and TNF-α) are not affected.
17 Table S1. Transcription factors of NF-κB mediated cytokines. Cytokines Transcription factors References IL-2 NF-κB, NFAT1, AP-1 (48, 58) IFN-γ NF-κB, NFAT1, AP-1, T-bet, STAT1, STAT4 (48, 58, 59) IL-4 NF-κB, NFAT1, Egr-1, JunB, SATB1, IRF4/8 (48, 58) IL-6 NF-κB, NFAT1, IRF-1, C/EBPβ (NF-IL6) (48) TNF-α NF-κB, NFAT1, ATF-2, Jun (48)