Genetic Variation of Enterobacter cloacae Using Random Amplified Polymorphic DNA (RAPD-PCR) Technique
|
|
|
- Silvester Manning
- 5 years ago
- Views:
Transcription
1 Donnish Journal of Microbiology and Biotechnology Research Vol () pp. -2 April, 2. ISSN: 2- Copyright 2 Donnish Journals Original Research Paper Genetic Variation of Enterobacter cloacae Using Random Amplified Polymorphic DNA (RAPD-PCR) Technique Yahya A. Abbas * and Ghosoon Fadhel Radhi 2 Nassiriya Technical Institute, Southern Technical University, Iraq. 2 Department of Biology, College of Science, University of Basrah, Iraq. Accepted 2 th February, 2. The genetic variation of isolates of Enterobacter cloacae was studied using four primers (,,, ) by RAPD-PCR technique. Most isolates gave DNA bands different in numbers and sizes. Among the primers () exhibited the highest efficacy reaching (22) total bands. The genetic diversity relationships between Enterobacter cloacae were generated by UPGMA analysis. Genetic similarity ranged from. (low similarity) to. (high similarity). The dendrogram differentiated the species into distinct clusters at similarity level which ranged from (.-.). Keywords: RAPD, Enterobacter cloacae, Genetic variation INTRODUCTION Random amplified polymorphic DNA (RAPD) technique has been widely used in prokaryotes and eukaryotes genus for the construction of genetic maps in species and for genotype identification and taxonomic studies (Williams et al., ; Castiglione et al., ). RAPD markers are detected by the use of short oligonucleotides (-bp) of arbitrary sequence as primers for amplification of segments of the target genome and do not require specific sequence information for the design of PCR primers because the number of potential primers that can be used is very large, numerous polymorphisms can be detected even between closely related organisms. (Rafalski et al., ; Sijapati et al., 2). RAPD analysis involves the amplification of small sequences of target DNA using random primers. As a DNA-based marker, the strength of RAPD analysis is the ability to assess genetic variation throughout the genome and generate a nearly limitless number of characters for evaluation (Nissen et al., ). RAPD was first developed by Williams et al. () this technique utilizes low-stringency PCR amplification with single primers of arbitrary sequence to generate strain-specific arrays of anonymous DNA fragments. It used to determine taxonomic identity, assess kinship relationships, analyze mixed genome samples (Younes, 2). It is inexpensive and a rapid technique because of its simplicity and requirement for minimal amounts of genomic DNA (Micheli et al., ). It has been widely used in identification and genetic relationship analysis of species. The improved RAPD can improve the resolution of PCR products and its repeatability (Fu et al., 2; Fu et al., 2; Mei et al., 2). RAPD method can reveal high degrees of polymorphisms, does not require prior DNA sequence information of the species and it is easy to manipulate (Shakeel et al., 2; Noormohammadi et al., 2). RAPD needs less DNA template and is relatively easy to handle, but it is poor in reproducibility and stability, leading to restrictions in practical application (Rajesh et al., 2). RAPD has been a very popular employed technique to generate genus-specific, species-specific or strain-specific diagnostics DNA fragments, identifying genes linked to traits of interest,undertaking genetic diversity studies and gene mapping for the development of diagnostics (Abad et al., ; Ransom et al., ). Random amplified polymorphic DNA analyses have been applied for the distinction of strains belonging to the same species (Williams et al., ). It is sensitive, fast and a useful method for the epidemiological studies and PCR-based method of genetic typing based on genomic polymorphisms. (Davin-Regli et al., ). Ozbey et al. (2) reported that some strains of Pasteurella multocida and Mannheimia haemolytica were typed by using RAPD assay. Trivedi et al. (2) used RAPD assay to establish the phylogenetic relationship of Enterobacter aerogenes with different closely related bacterial species. Welsh and McClelland () used sets of random primers to generate randomly amplified polymorphic DNA (RAPD)-PCR products,which produce banding patterns, when separated on agarose gels, that are characteristic of species and individual *Corresponding Author: Prof. Yahya A. Abbas. Nassiriya Technical Institute, Southern Technical University, Iraq.
2 A b b a s e t a l D o n n. J. M i c r o b. B i o t e c. R e s. organisms. The present study aimed to use random amplified polymorphic DNA (RAPD) to analyze the genetic diversity of Enterobacter cloacae strains by using random primers. MATERIALS AND METHODS Samples collection The samples were collected from different areas of Basrah hospitals (Al-Fayhaa General hospital, Al-Mawanee General hospital, Al-Sadder teaching hospital, Al-Basrah hospital for gynecology and obstetrics, Al-Basrah childrenʼs specialty hospital, Al-Basrah General hospital). DNA Extraction Genomic DNA of isolates was extracted by ExiPrep TM Bacteria Genomic DNA kit using ExiPrep TM Fully Automated Nucleic acid Extraction System (Bioneer). Detection of Random Amplified Polymorphic DNA (RAPD) by PCR Four primers were screened for RAPD typing of Enterobacter cloacae according to (Haryani et al., 2; Ashayeri-Panah et al., 22) which are listed in Table (). Reagents The reagents and their volumes used for PCR amplification of RAPD are described in the Table (2). PCR amplification for RAPD The thermal cycling program for amplification of RAPD Enterobacter cloacae was described in Table (). Separation of PCR products (RAPD bands) by gel electrophoresis PCR product was separated in the same procedure used with PCR product of S rdna as showed in Abbas and Radhi (2), the products were detected and photographed by using gel documentation system. RAPD analysis Data analysis for each isolate was calculated based on banding patterns in comparing with ladder's bands. Based on band matching coefficient of Dice. Simple Mach clustering in the unweighted pair group method with arithmetic averages (UPGMA) was applied to generate dendrogram (NTSYS - pc version 2.2, Exeter software, Setanket, NY, USA) (Sneath and Sokal, ; Rohlf, ). RESULTS Identification of Enterobacter cloacae strains by Random Amplified Polymorphic DNA (RAPD) Forty Enterobacter cloacae strain isolated from different sources of Basrah hospitals were distinguished by using four RAPD primers (,,, ). Different profiles were found for each primer used in this study. Primer () produced the highest number of bands (22 bands), whereas primer () produced the lowest number of bands (22 bands). -RAPD primer () The results showed (22 bands) were produced by this primer. The isolate () produced the highest number of bands( bands), whereas the isolates (2, ) produced the lowest number of bands ( bands). The isolate () produced the biggest band with molecular weight (bp), the isolate (2) produced the smallest band with molecular weight ( bp) Figures (, 2,, ), Table (). 2-RAPD primer The results showed (2 bands) were produced by this primer. The isolate () produced the highest number of bands (2 bands), whereas the isolate () produced the lowest number of bands ( band). The isolates (,,,, 2) produced the biggest bands with molecular weight (22bp), the isolate () produced the smallest band with molecular weight ( bp) Figures (,,, ), Table (). -RAPD primer The results showed (2 bands) were produced by this primer. The isolate () produced the highest number of bands ( bands), whereas the isolate () produced the lowest number of bands ( band). The isolates (,, 2, 2,,,,,,,, 2, 2, 2,, ) produced the biggest bands with molecular weight (22 bp), the isolates (2, ) produced the smallest band with molecular weight (bp) Figures (,,, 2) Table (). - RAPD primer The results showed (22 bands) were produced by this primer.the isolates (,, ) produced the highest number of bands ( bands), whereas the isolate () produced the lowest number of bands (2 bands). The isolates (,,,, ) produced the biggest bands with molecular weight (22bp), the isolate() produced the smallest band with molecular weight ( bp) Figures (,,, ), Table (). RAPD phylogenetic tree of Enterobacter cloacae The genetic diversity relationships between Enterobacter cloacae were generated by UPGMA analysis of the genetic distances. According to the results, genetic similarity ranged from. (low similarity) to. (high similarity). The dendrogram differentiated the species into distinct clusters at similarity level that ranged from (.-.) clusters (,,,,,,,, 2,,,,,, 2, 22, 2, 2, 2, 2, 2,, ) consisted of one isolate like (,,,,,,,,,,,,, 2,, 2, 2, 2,,,, 2, ) respectively Figure (). As observed from the results there were two isolates (, 2), (, ), (2, 2), (, 2), (, ), (, 2), (, ) arranged in one cluster like cluster (2,,,,, 2, 2) respectively, on the other hand cluster 2 composed of three isolates (2,, ).
 TA* (ºC) 2 2 2 2 2 *TA=Annealing temperature Table 2: Reagent and volume( μl) used in PCR amplification for RAPD NO.")
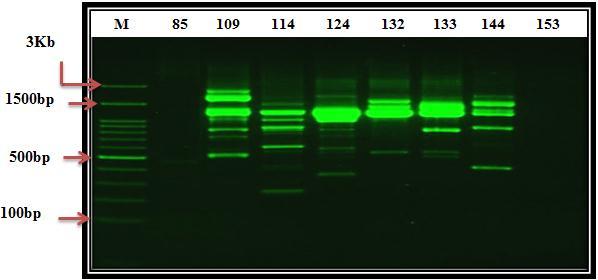
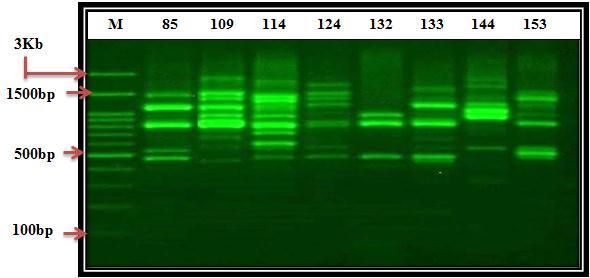
3 A b b a s e t a l D o n n. J. M i c r o b. B i o t e c. R e s. 2 Table : Oligonucleotide primer sequences for RAPD NO. Primer Code Primer Sequence Length (bp) TA* (ºC) *TA=Annealing temperature Table 2: Reagent and volume( μl) used in PCR amplification for RAPD NO. First primer 2 *This step was repeated for all RAPD primers Reagent Taq DNA polymerase DNA template dntp mix Sterile ddh 2O PCR buffer MgCl 2 Volume per reaction 2. μl μl μl μl 2. μl μl μl Table : Program used in PCR amplification for RAPD reaction Steps Initial denaturation Denaturation Annealing Extension Finial Extension Temperature ºC ºC 2ºC 2 ºC 2 ºC Time min sec sec 2 sec min No.of cycles Kb bp bp bp Figure : Agarose gel photograph of genomic DNA fragments amplification pattern obtained from RAPD primer screening of Enterobacter cloacae using RAPD primer:. M = kb DNA ladder, Lanes:,,,, 2,,,,,,, 2, 2,,, = E. cloacae


4 A b b a s e t a l D o n n. J. M i c r o b. B i o t e c. R e s. Kb bp bp bp Figure 2: Agarose gel photograph of genomic DNA fragments amplification pattern obtained from RAPD primer screening of Enterobacter cloacae using RAPD primer:. M = kb DNA ladder, Lanes:,, 2, 2,,,, = E. cloacae Kb bp bp bp Figure : Agarose gel photograph of genomic DNA fragments amplification pattern obtained from RAPD primer screening of Enterobacter cloacae using RAPD primer:. M = kb DNA ladder, Lanes:, 2,,,,,, 2 = E. cloacae 2 2 M Kb bp bp bp Figure : Agarose gel photograph of genomic DNA fragments amplification pattern obtained from RAPD primer screening of Enterobacter cloacae using RAPD primer:. M = kb DNA ladder, Lanes:,,, 2, 2,,, = E. cloacae

5 A b b a s e t a l D o n n. J. M i c r o b. B i o t e c. R e s. Table : RAPD primer used in genetic divergence of Enterobacter cloacae NO.of isolate Primer code Primer sequence NO.of bands 2 Total = 22 Molecular weight Kb bp bp bp Figure : Agarose gel photograph of genomic DNA fragments amplification pattern obtained from RAPD primer screening of Enterobacter cloacae using RAPD primer:. M = kb DNA ladder, Lanes:,,,, 2,,,,,,, 2, 2,,, = E. cloacae


6 A b b a s e t a l D o n n. J. M i c r o b. B i o t e c. R e s. Figure : Agarose gel photograph of genomic DNA fragments amplification pattern obtained from RAPD primer screening of Enterobacter cloacae using RAPD primer:. M = kb DNA ladder, Lanes:,, 2, 2,,,, = E. cloacae Figure : Agarose gel photograph of genomic DNA fragments amplification pattern obtained from RAPD primer screening of Enterobacter cloacae using RAPD primer:. M = kb DNA ladder, Lanes:, 2,,,,,, 2 = E. cloacae Figure : Agarose gel photograph of genomic DNA fragments amplification pattern obtained from RAPD primer screening of Enterobacter cloacae using RAPD primer:. M = kb DNA ladder, Lanes:,,, 2, 2,,, =E. cloacae

7 A b b a s e t a l D o n n. J. M i c r o b. B i o t e c. R e s. Table : RAPD primer used in genetic divergence of Enterobacter cloacae No. of isolate Primer code Primer sequence NO.of bands Total = 2 Molecular weight Figure : Agarose gel photograph of genomic DNA fragments amplification pattern obtained from RAPD primer screening of Enterobacter cloacae using RAPD primer:. M = kb DNA ladder, Lanes:,,,, 2,,,,,,, 2, 2,,, = E. cloacae


8 A b b a s e t a l D o n n. J. M i c r o b. B i o t e c. R e s. Figure : Agarose gel photograph of genomic DNA fragments amplification pattern obtained from RAPD primer screening of Enterobacter cloacae using RAPD primer:. M = kb DNA ladder, Lanes:,, 2, 2,,,, = E. cloacae Figure : Agarose gel photograph of genomic DNA fragments amplification pattern obtained from RAPD primer screening of Enterobacter cloacae using RAPD primer:. M = kb DNA ladder, Lanes:, 2,,,,,, 2 = E. cloacae Figure 2:Agarose gel photograph of genomic DNA fragments amplification pattern obtained from RAPD primer screening of Enterobacter cloacae using RAPD primer:, M = kb DNA ladder, Lanes:,,, 2, 2,,, = E. cloacae

9 A b b a s e t a l D o n n. J. M i c r o b. B i o t e c. R e s. Table : RAPD primer used in genetic divergence of Enterobacter cloacae NO.of isolate Primer code Primer sequence NO.of bands Total = 2 Molecular weight Figure : Agarose gel photograph of genomic DNA fragments amplification pattern obtained from RAPD primer screening of Enterobacter cloacae using RAPD primer:, M = kb DNA ladder, Lanes:,,,, 2,,,,,,, 2, 2,,, = E. cloacae


10 A b b a s e t a l D o n n. J. M i c r o b. B i o t e c. R e s. Figure : Agarose gel photograph of genomic DNA fragments amplification pattern obtained from RAPD primer screening of Enterobacter cloacae using RAPD primer:. M = kb DNA ladder, Lanes:,, 2, 2,,,, = E. cloacae Figure : Agarose gel photograph of genomic DNA fragments amplification pattern obtained from RAPD primer screening of Enterobacter cloacae using RAPD primer:. M = kb DNA ladder, Lanes:, 2,,,,,, 2 = E. cloacae Figure : Agarose gel photograph of genomic DNA fragments amplification pattern obtained from RAPD primer screening of Enterobacter cloacae using RAPD primer:. M = kb DNA ladder, Lanes:,,, 2, 2,,, = E. cloacae
11 A b b a s e t a l D o n n. J. M i c r o b. B i o t e c. R e s. 2 Table : RAPD primer used in genetic divergence of Enterobacter cloacae NO.of isolate Primer code Primer sequence NO.of bands 2 Total = 22 Molecular weight DISCUSSION The use of dominant markers to assess genetic variability between isolates is promising because many polymorphic loci can be obtained easily in a relatively short time and at low cost, without any prior knowledge of the genome of the isolates under study (Nybom and Bartish, 2; Nybom, 2). In our study, the use of RAPD markers proved to be a powerful method for the detection of spatial genetic variation. With RAPD primers (,,, ) we could differentiate the forty Enterobacter cloacae. The results showed that the patterns of DNA fragments amplified by RAPD PCR with these primers were different among E. cloacae isolates, where primer produced the highest number of bands (22 bands) Table () whereas primer produced the lowest number of bands (22 bands) Table (). The results showed all forty E. cloacae produced bands different in number and size for RAPD primers. In exception, some isolates produced the same number bands but with different sizes (molecular weight). This, reflecting a genetic diversity in the populations, genetic diversity within populations is considered to be of high importance for adaptation to changing environments (Ma et al., 22). Also, observed from the dendrogram, were differentiated E. cloacae isolates into distinct clusters at similarity level ranged from (.-.), most clusters consisted of one isolate. The results of the RAPD assay indicated that genetic heterogeneity exists among E. cloacae isolates other studies showed the same results on other genra (Ozbey et al., 2; Hawari et al., 2; Kim et al., 2). The results of the dendrogram observed that the isolates (, 2), (, ), (2, 2), (, 2), (, ), (, 2), (, ), (2,, ) were clustering together although these isolates were collected from different locations of Basrah hospitals, this finding indicated the spread of E. cloacae in environment. Similar results were observed for E. cloacae using RAPD primer (Haryani et al., 2).
12 A b b a s e t a l D o n n. J. M i c r o b. B i o t e c. R e s. 2 Figure : Dendrogram of forty Enterobacter cloacae strains isolated from different sources of Basrah hospital construsted by UPGMA based on coefficient of (simple matching from the bands for RAPD with primers (,,, ).

13 A b b a s e t a l D o n n. J. M i c r o b. B i o t e c. R e s. 22
14 A b b a s e t a l D o n n. J. M i c r o b. B i o t e c. R e s. 2 REFERENCES Abad, P.; Pascual, B.; Maroto, J.V.; Lopez, G.S.; Vicente, M.J. and Alagarda, J.(). RAPD analysis of cultivated and wild yellow nutsedge (Cyperus esculentus L.). J. Weed. Sci., :-2. Abbas, Y.A. and Radhi, G.F. (2). Identification of Enterobacter spp.by SrRNA gene sequencing in Basrah province/iraq. Int. Res. J. Nat. Sci., :2-. Ashayeri-Panah, M.; Eftekhar, F. and Feizabadi, M. M. (22). Development of an optimized random amplified polymorphic DNA protocol for fingerprinting of Klebsiella pneumoniae. Lett. Appl. Microbiol., :22-2. Davin-Regli. A.; Monnet, D.; Saux, P; Bosi, C; Charrel, R.; Barthelemy, A. and Bollet, C. (). Molecular epidemiology of Enterobacter aerogenes acquisition: one-year prospective study in two intensive care units. J. Clin. Microbiol., :-. Fu, J.; Li, L.; Xu, X.; Wang, Z.; Tang, G.; Yin, C.; Lu, G. (2). An improved method for increasing the efficiency of the technique of random amplified polymorphic DNA (RAPD). J. Hereditas., 22:2-22. Fu, J.Yang, L.; Khan, M.A.; Mei, Z. (2). Genetic characterization and authentication of lonicera japonica thunb.by using improved RAPD analysis. J. Mol. Biol. Rep.,./s--2-. Castiglione, S.; Wang, G.; Damiani, G.; Bandi, C.; Bisoffi, S. and Sala, F. (). RAPD fingerprints for identification and for taxonomic studies of elite poplar (populus spp.) clones. J. Theor. Appli. Genet., :-. Haryani, Y.; Tunung, R.;Chai, L.C.; Lee, H.Y.; Tang, S.Y. and Son, R. (2). Characterization of Enterobacter cloacae isolated from street foods. ASEAN. Food J., :-. Hawari, A.D.; Hassawi, D.S. and Sweiss, M. (2). Isolation and identification of Mannheimia haemolytica and Pasteurella multocida in sheep and goats using biochemical tests and random amplified polymorphic DNA (RAPD) analysis.j. Biol. Sci.,:2-2. Kim, J.B.; Park, Y.-B.; Kang, S.-H.; Lee, M.-J.; Kim, K.-C.; Jeong, H.- R.; Kim, D.-H.; Yoon, M.-H.; Lee, J.-B.; Oh, D.-H. (2). Prevalence, genetic diversity,and antibiotic susceptibility of Cronobacter spp.(enterobacter sakazakii) isolated from sunshik,its ingredients and soils.food Sci.Biotechnol., 2:- Ma,X.;Chen, S.-Y.;Bai, S.-Q.; Zhang, X.-Q.; Li, D.-X.; Zhang, C.- B.;Yan,J.-J. (22). RAPD analysis of genetic diversity and population structure of Elymus sibiricus (Poaceae) native to the southeastern Qinghai-Tibet Plateau,China.Genet. Mol. Res., :2-2. Mei, Z. Q.; Fu, S.Y. ; Yu,H.Q. ;Yang,L.Q.; Duan, C.G.; Liu, X.Y.; Gong, S.; Fu, J.J. (2). Genetic characterization and authentication of Dimocarpus longan lour. using an improved RAPD technique. Genet. Mol. Res., :-. Micheli, M.R.; Bova, R.; Pascale, E.; Ambrosio, E. (). Reproducible DNA fingerprint with the random amplified polymorphic DNA (RAPD). method. Nucleic. Acids. Res., 22:2-22. Nissen, S. J.; Masters, R. A.; Lee, D.J. and Rowe, M. L. (). DNAbased marker systems to determine genetic diversity of weedy species and their application to biocontrol. Weed. Sci., :-. Noormohammadi, Z.; Hasheminejad-Ahangarani, F.Y.; Sheidai, M.; Ghasemzadeh-Baraki, A.S.; Alishah, O. (2). Genetic diversity analysis in opal cotton hybrids based on SSR, ISSR, and RAPD markers. Genet. Mol. Res., 2:2-2. Nybom, H. (2). Comparison of different nuclear DNA markers for estimating intraspecific genetic diversity in plants. Mol. Ecol., :-. Nybom, H.and Bartish, I.V. (2). Effects of life history traits and sampling strategies on genetic diversity estimates obtained with RAPD markers in plants. Plant. Ecol. Evol. Syst., :-. Ozbey, G.; Kilic, A.; Ertas, H.B. and Muz, A. (2). Random amplified polymorphic DNA (RAPD) analysis of Pasteurella multocida and Manheimia haemolytica strains isolated from cattle, sheep and goats. Vet. Med. Czech., :-. Rafalski, J.A.; Tingey, S.V.; William, J.G.K. (). RAPD markers-a new technology for genetic mapping and plant breeding. Agr. Biotech. News Inform., :-. Rajesh, M.K.; Jerard, B.A.; Preethi, P.; Thomas, R.J.; Fayas, T.P.; Rachana, K.E.; Karun, A. (2). Development of a RAPD derived SCAR marker associated with tall-type palm trait in coconut. Sci. Hort, :2-. Ransom, C.V.; Douches, D.S. and Kells, J.J. (). Isozyme and RAPD variation among and within hemp dogbane (Apocynum cannabinus) population. Weed. Sci., :-. Rohlf, F.J. (). NTSYS-pc,numerical taxonomy and multivariate analysis system, Ver.2.2 Setauket. NY: Exeter software. Shakeel, M.; llyas, M.; Kazi, M. (2). Evaluation of synthetic hexaploid wheats (derivative of durum wheats and Aegilops tauschii accessions) for studing genetic diversity using randomly amplified polymorphic DNA (RAPD) markers. Mol. Biol. Rep., :2-2. Sijapati, J.; Rana, N.; Rana, P.; Shrestha, S. (2). Optimization of RAPD-PCR conditions for the study of genetic diversity in Nepalese isolates of Bacillus thuringiensis Berliner. Nepal J. Sci. Technol., :-. Sneath, P.H.A. and Sokal, R.R. (). Numerical taxonomy: The principles and practice of numerical classification. W.H. Freeman, San Francisco. Trivedi, M.K.; Branton, A.; Trivedi, D.; Nayak, G.; Gangwar, M.; Jana, S.(2). Characterization of phenotype and genotype of biofield treated Enterobacter aerogenes. Transl. Med., :.doi:.2/2-2.. Welsh, J. and McClelland, M. (). Fingerprinting genomes using PCR with arbitrary primers.nucleic Acids.Res.,:2-2. Williams, J.G.K.; Kubelik, A.R.; Livak, K.J.; Rafalski, J.A.; Tingey, S.V. (). DNA polymorphisms amplified by arbitrary primers are useful as genetic markers. Nucleic.Acids. Res., :-. Younes, A.M. (2).Molecular diversity and genetic organization of antibiotic resistance in Klebsiella species.thesis presented for the degree of Doctor of Philosophy University of Edinburgh, Pp:22.