SNP production markers and how genomic technologies will influence breeding decisions. Elisa Marques, PhD GeneSeek, a Neogen Company
|
|
|
- Silvester Grant
- 5 years ago
- Views:
Transcription

1 SNP production markers and how genomic technologies will influence breeding decisions Elisa Marques, PhD GeneSeek, a Neogen Company
2 About GeneSeek Started in 1998 with one student intern Vision: Affordable, flexible DNA Analysis for agribusiness Now FTE (and many robots) Began 600 sqft, currently Acquired by Neogen in 2010
3 Our Clients Large pharma & R/D companies AI / genetic suppliers Breed Associations Farmers/ranchers Research Institutions Government

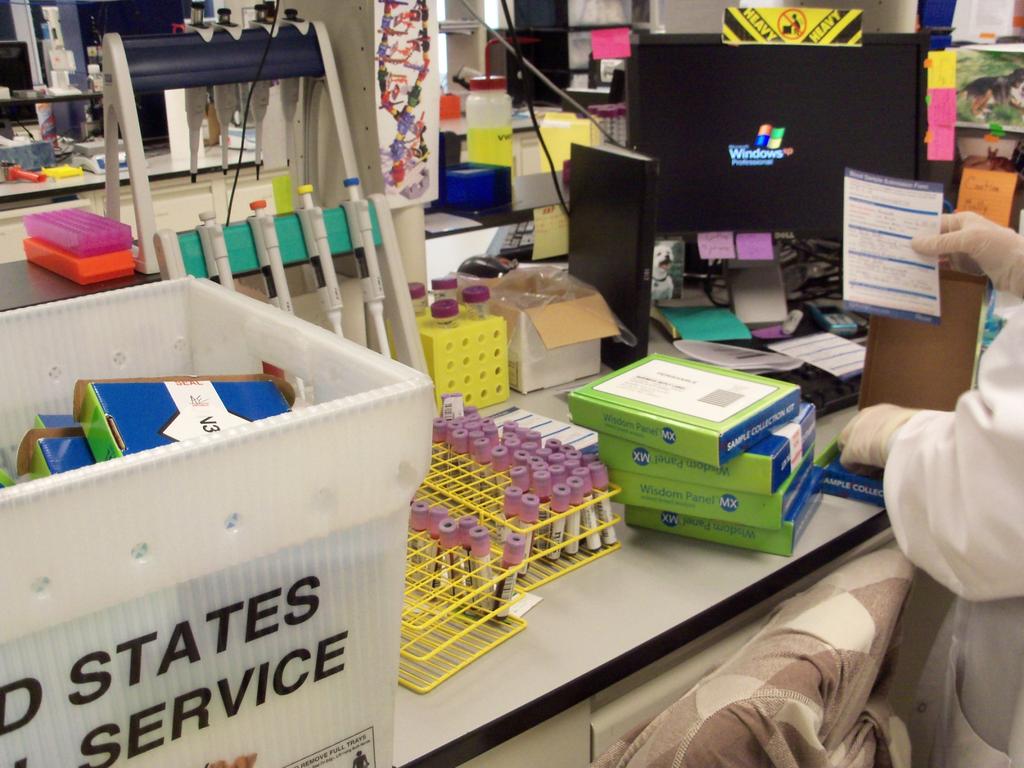
4 Ability to accept multiple sample types
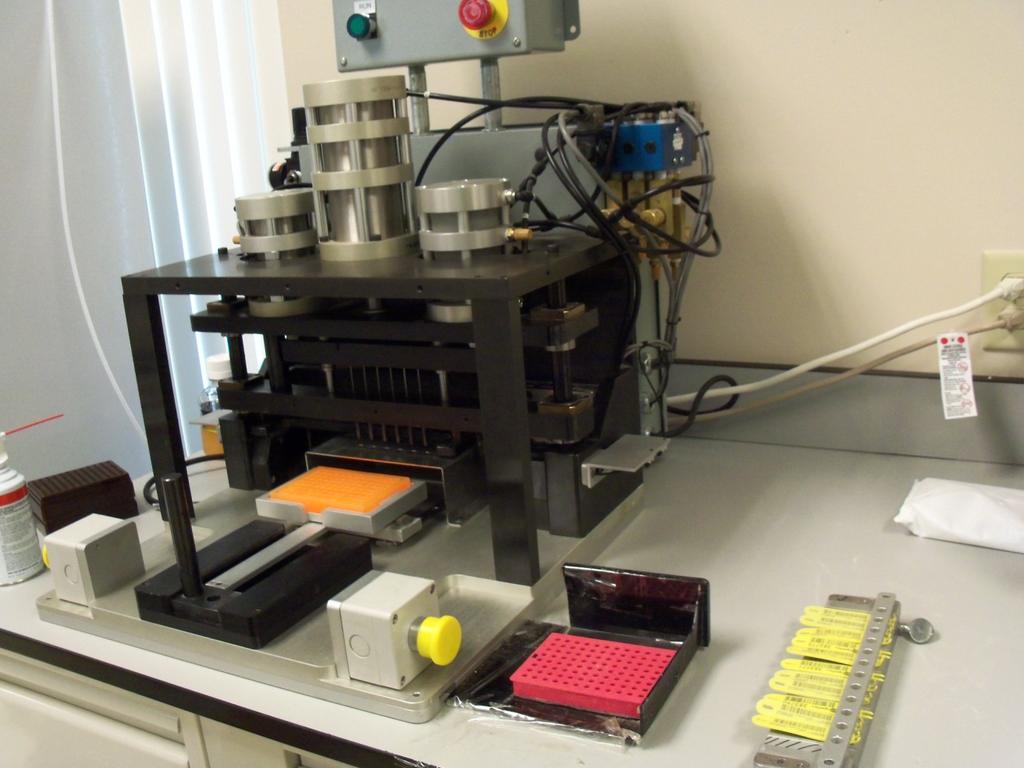


5 Customized solutions

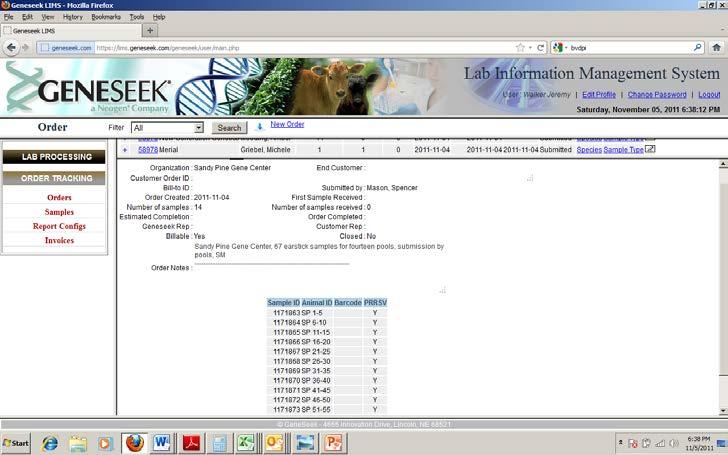
6 Sample receipt and management
7

8


9 High Sample Throughput Customized SNP Panels Sequenom Illumina


10 Genomics: Through the extraction and analysis of DNA we can identify important genetic markers known as SNPs New addition to our family Bioinformatics: Knowledge of how differences in SNPs effect animal performance Gene SNP Site
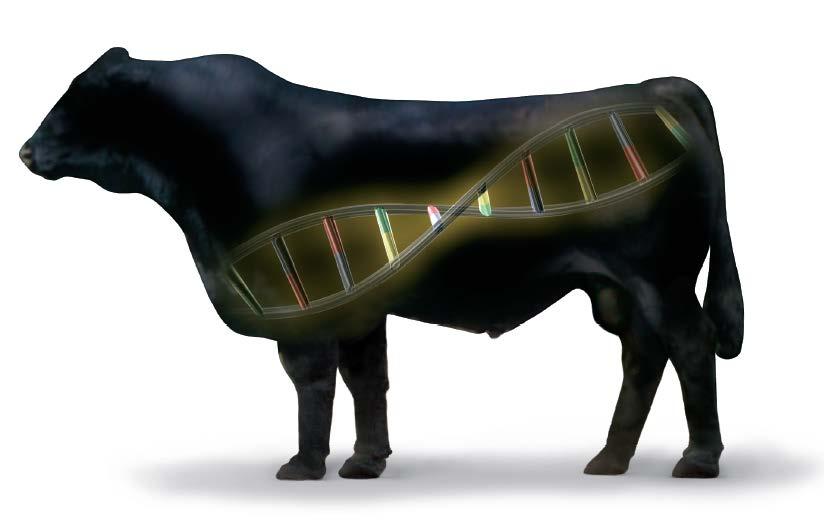
11 Why DNA?

12 Why DNA? Source: Food Economics and Consumer Choice (Jeff Simmons, 2008)
13 Technology defined Practices: Doing it better Products: Using new innovative tools and technologies Genetics: To enhance desired traits in plants and animals Food Economics and Consumer Choice (Jeff Simmons, 2008)
14 Why DNA? Increased accuracy of selection

15 Why DNA? Faster rate of genetic improvement

16 Why DNA? Traits that are difficult and/or expensive to measure and have a large economic impact Carcass traits Feed Efficiency Fertility Immune response Tenderness Longevity Marker-assisted selection has the potential to greatly improve how quickly we can make genetic progress in many traits for which we do and do not currently have EPDs. Dr. Mark Enns, Colorado State University June 2009 Brangus Journal


17 Why DNA? Parentage Added seedstock value Multi-sire pastures Genetic evaluation for commercial cow-calf producers Solve problems

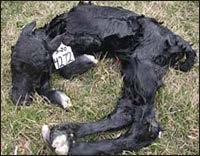
18 Why DNA? Manage genetic defects Salvage valuable genetics.


19 Why DNA? Greater return on assets $

20 2003 single marker/ single trait limited adoption 2008 Multi-marker tests for a few traits reported in a variety of formats no tie between DNA test results and national genetic evaluation or breed associations GE-EPDs 2012 panels with thousands of markers for many traits results reported in units of the trait incorporation of DNA information into national genetic evaluation 2020 seamless submission of genotype data to national genetic evaluation/breed associations DNA information used for traceability, parentage, genetic defects, selection, marker-assisted management, product differentiation Modified from Van Eenennaam GeneSeek 9/12/2012

21 Genomic Enhanced EPDs Pedigree + Individual record +
22 Value of Genomic Enhanced EPDs 1. Risk reduction through improved accuracy of selection 2. Value of time 3. Faster rate of genetic progress
23 Value of Genomic Enhanced EPDs 1. Risk reduction through increased accuracy of selection 2. Value of time 3. Rate of genetic progress
24 EPD ACC Increase with IGENITY Profile for Angus - MARB ACC After DNA Profile for Angus ACC Before DNA Profile for Angus


25 EPD Accuracy and Possible Change Source: Bowman-AGI
26 Value of Genomic Enhanced EPDs 1. Risk reduction through improved accuracy of selection 2. Value of time 3. Rate of genetic progress


27 How long will it take to get the same level of EPD accuracy with progeny versus pulling a sample at birth, branding or weaning to get GE-EPDs? $
28 EPD Accuracy vs. Estimated Equivalent Number of Progeny Pedigree (P.E.) P.E. + Genomic Trait ACC # Prog. 1 ACC # Prog. 1 RADG MARB REA Derived from U.C. Davis fact sheet 2 Carcass Progeny.
29 Value of Genomic Enhanced EPDs 1. Risk reduction through improved accuracy of selection 2. Value of time 3. Rate of genetic progress
30 When combined with performance records, genomic data improved selection response 20% to 41%, depending on the trait 1 1 Van Eenennaam, A.L., J.H. van der Werf, and M.E.Goddard Value of DNA information for bull selection. 9 th World Congress of Genetics Applied to Livestock Production, Leipzip, Germany.
31 Average Marbling EPD Genomic EPDs would get you to the same level two years earlier Because of the higher predictability of genomic-enhanced EPDs % Average Year
32 Selection Response

33 Industry validation Fat thickness Marbling Score Quality Score Rib Eye Area Yield Grade Average Daily Gain..
34


35 Extracting DNA multiple times in different labs for different applications makes about as much sense as simultaneously paying to have access to all of the following communication devices Van Eenennaam GeneSeek 9/12/2012
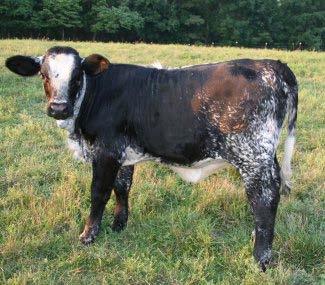
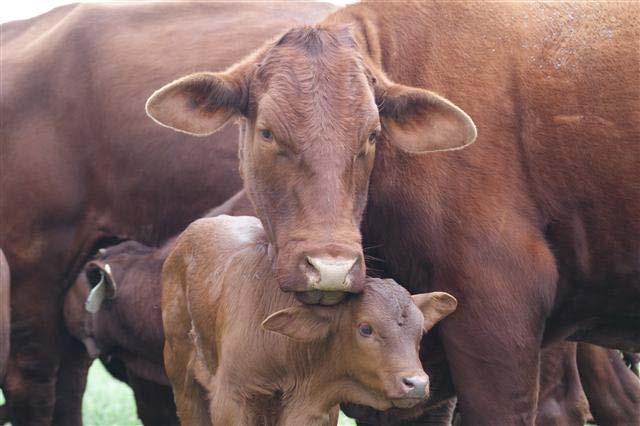

36 36 Transforming SNP chips into Informational Powerhouses Coat Color Fertility markers Parentage AM Milk Quality GGP Fawn Calf

37 GGP
38 Thank you! Questions? Elisa Marques Market Development Manager