Introduction to biology and measurement of gene expression
|
|
|
- Marylou Williams
- 5 years ago
- Views:
Transcription
1 Introduction to biology and measurement of gene expression Statistical analysis of gene expression data with R and Bioconductor University of Copenhagen, August, 2009 Margaret Taub University of California, Berkeley Slides courtesy of Terry Speed, with modifications 1

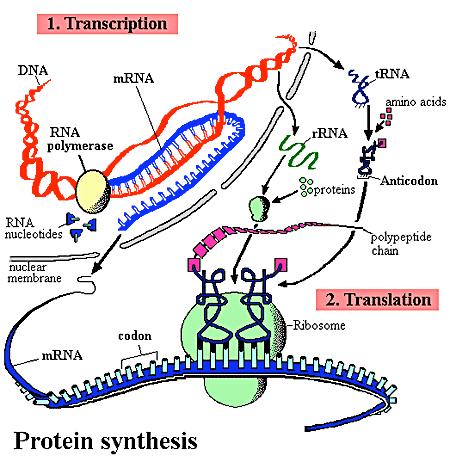
2 Central dogma of molecular biology DNA activity in eukaryotic cell Each gene is transcribed (at the appropriate time) from DNA into mrna, which then leaves the nucleus and is translated into the required protein. Any gene which is active in this way at any particular time is said to be expressed. 2
3 Base Pairing 3

4 The monomeric units of nucleic acids are called nucleotides. A nucleotide is a phospate, a sugar, and a purine or a pyramidine base. 4
5 DNA Replication I New strands of DNA are synthesized by copying of parental strands. The DNA strand that is copied to form a new strand is called a template. The information in the template is preserved: although the first copy has a complementary sequence, not an identical one, a copy of the copy produces the original (template) sequence again. In the replication of double-stranded or duplex DNA molecule, both original (parental) DNA strands are copied. When copying is finished, the two new duplexes, each consisting of one of the original strands plus its copy, separate from each other. 5
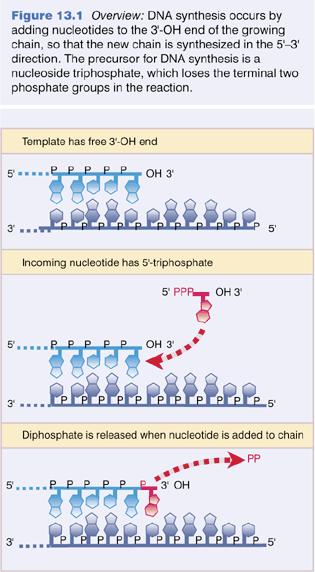
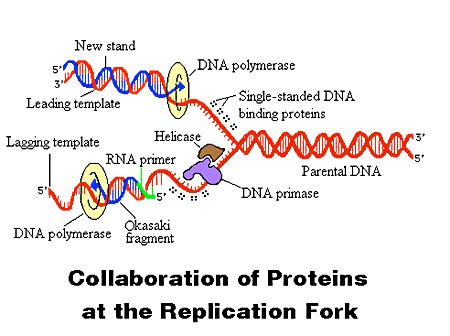
6 DNA Replication II All DNA synthesis proceeds in the same chemical direction: 5ʼ->3ʼ. The enzymes that copy (replicate) DNA to make more DNA are DNA polymerases. DNA polymerases cannot initiate chain synthesis de novo; instead they require a short preexisting DNA strand, called a primer, to begin chain growth. With a primer base-paired to the template strand, a DNA polymerase adds nucleotides to the free hydroxyl group at the 3ʼ end of the primer. Replication of duplex DNA requires assembly of many proteins (at least 30) at a growing fork: helicases to unwind, primases to prime, ligases to ligate (join), topisomerases to remove supercoils, RNA polymerase, etc. 6
7 7
8 8
9 9
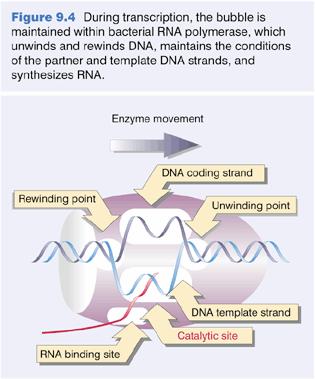
10 Transcription: from DNA to mrna Transcription is a very complex process involving many steps and many proteins. RNA polymerase initiates transcription of most genes at a unique position (a single base: the start site) in the template DNA upstream of the coding sequence. RNA polymerase binds to specific promoter sequences to initiate transcription. Initiation begins when a subunit of a polymerase binds to a promotor DNA sequence. There are three different types of RNA polymerases with different functions. 10
11 Regulation of transcription Expression of eukaryotic protein coding genes is regulated through multiple transcriptional control regions. Regulatory elements are often many kilobases from start sites. Repressors bind to DNA sequences called operators which overlap the promoter region that contacts RNA polymerase. A bound repressor interferes with binding of RNA polymerase and transcription initiation. Activators generally bind to DNA on the opposite side of the helix from the polymerase at specific positions. Enhancers, usually bp in length contain multiple 8-20 bp control elements, may be from 200 bp to tens of kilobases upstream of downstream from a promoter, within an intron, or downstream from a final exon of gene. 11

12 From Genes VII 12
13 13

14 From Alberts et al,
15 Cartoon of a gene 15
16 Structure of mrna The open reading frame (ORF) consists of introns and exons. Untranslated regions (UTRs) are present at both the 5ʼ and the 3ʼ end of the mrna. A oligo consisting of all adenine nucleotides (a poly-a tail) is added to the 3ʼ end of the mrna after transcription. 16
17 Post-transcriptional modification: splicing Before translation, most introns must be spliced out of the mrna. Sometimes, different combinations of introns and exons are spliced out, potentially leading to different mrna products from the same gene. These different products are referred to as isoforms. Scientists may be interested in measuring expression of these different isoforms, which adds a layer of complexity to the concept of gene expression. 17
18 Translation: from mrna to protein Triples of nucleic acids (called codons) code for the different amino acids. Translation takes place in an ORF between a start codon and a stop codon. Ribosomes handle the translation of mrna into protein, decoding the codons to produce an amino acid sequence that corresponds to the nucleotide sequence in the mrna. Eukaryotic initiation of protein synthesis occurs at the 5ʼ end and internal sites in mrna. Multiple ribosomes can operate in parallel on the same mrna transcript. 18
19 19
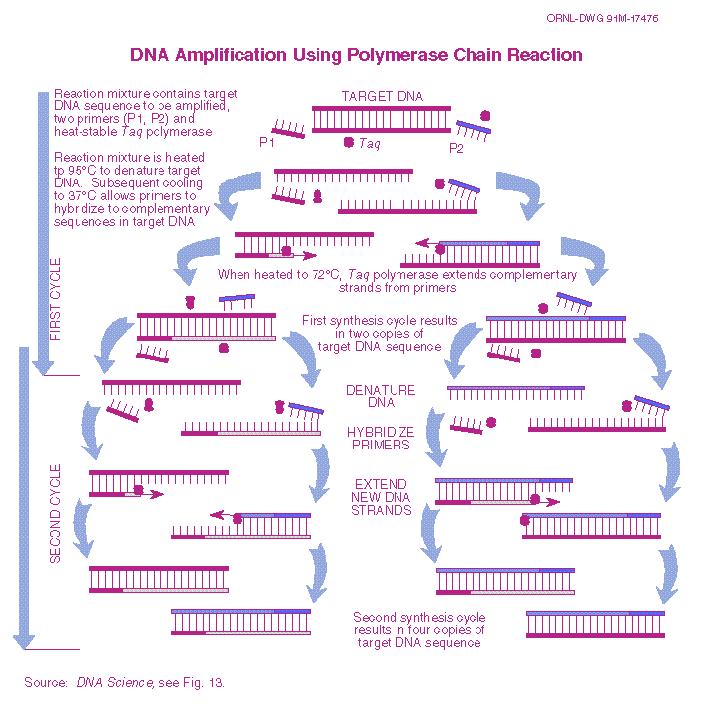
20 Polymerase Chain Reaction (PCR) I This reaction is used to amplify specific DNA sequences in a complex mixture when the ends of the sequence are known. Start with the DNA you want to amplify. Heat-denature it into single strands. Add synthetic oligonucleotides complementary to the 3ʼ ends of the segments of interest in great excess to the denatured DNA, and lower the temperature of the solution. The genomic DNA remains denatured, because the complementary strands are at too low a concentration to encounter each other during the period of incubation, but the specific oligonucleotides, which are at a very high concentration, hybridize with their complementary sequences in the genomic DNA. 20
21 PCR II The hybridized oligos then serve as primers for DNA chain synthesis. Add dntps and a temperature resistant polymerase such as that from Thermus aquilus (a bacterium that lives in hot springs). Synthesis will then proceed. When synthesis is complete, heat the mixture further (to 95 C) to melt the newly formed duplexes. When the temperature is lowered again, a new round of synthesis takes place because excess primer is still present. Repeated cycles of synthesis (cooling) and melting (heating) quickly amplify. 21
22 22
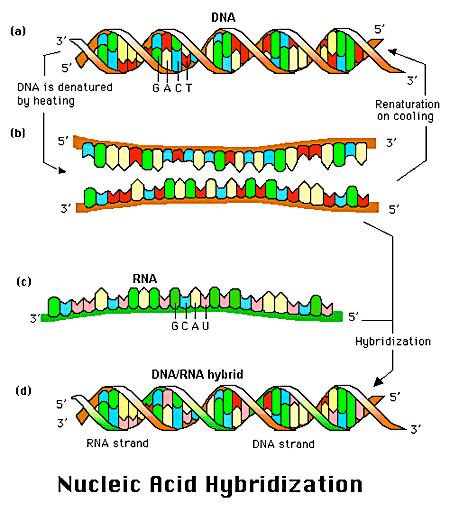
23 Hybridization This is a technique which exploits a potent feature of the DNA duplex - the sequence complementarity of the two strands. Remarkably, DNA can reassemble with perfect fidelity from the separated strands. The melting temperature of a DNA molecule is denoted T m and this depends on G+C content and salt concentration. 23
24 24
25 Some bio abbreviations (in this context) PCR = Polymerase Chain Reaction RT= Reverse Transcriptase (also: Real-Time) cdna = complementary DNA (usually to RNA) Cy3, Cy5 = Cyan.you donʼt want to know = green, red dye wt, mt = wild-type (also normal ), mutant organism 5ʼ, 3ʼ = directionalities of DNA, usually depicted from left, right oligo = oligonucleotide = short (say < 100 bp) DNA molecule ss, ds = single-stranded, double-stranded (usually DNA) DNA probe = cdna or oligo, usually fixed to solid (see later) target = mrna or cdna seeking complementary probe bp = base pairs (measuring length of DNA molecule) 25
26 Quantifying gene expression To quantify gene expression, we can measure either mrna or protein, and there are many ways of doing each. Some are little more than detection assays, others give relative expression, and yet others give absolute expression. Measuring mrna: quantitative Northern blot, qpcr, qrt-pcr, short- or long-oligo or cdna microarrays, EST sequencing, SAGE, MPSS, bead-arrays, next-generation sequencing Measuring protein: many assays using antibodies (quantitative Western blots, ELISA..), many separation techniques (e.g. 2D gels, gas, liquid chromatography, MS) leading to spots, peaks and peak areas, etc. 26
27 How microarrays are used to measure gene expression Basic idea: measure the activity level of a gene (its expression level), in a particular cell at a particular time, by measuring the concentration of that geneʼs mrna transcript in the cellʼs total RNA. How? Immobilize DNA probes (oligos or cdna) onto glass, Hybridize labelled target mrna (in reality cdna equivalent) with probes on glass, Measure how much binds to each probe (i.e. forms ds DNA). (In two-channel experiments, equal amounts of two differently labelled target cdnas are hybridized to the probes.) 27
28 Notes I: What we are measuring The details of microarray assays are quite extensive. Look them up on the www or in books. Just some notes now. The mrna we quantify is being synthesized in the cells (in vivo) at some rate, and is decaying in vivo at some other rate, as well as being degraded in vitro at a third rate. We get an imperfect measure of the net mrna. Most mrna degradation occurs 3ʼ to 5ʼ, and it can be a real problem. Degradation may affect different transcripts differently. 28
29 Notes II: Probe effects The fixed probes are attached to the glass in ss form. Binding is (Watson-Crick) base-pairing of ss fragments to form ds fragments. Hybridization efficiency (how much hybridization takes place in a given length of time) will be affected by the sequence composition of the probes (e.g., GC-content). This makes comparison of signal between different probes difficult. Efficiency will also depend on the concentration of the target molecule and the temperature at which the hybridization reaction is taking place. Not all pairing is perfectly complementary, so we do have cross-hybridization (imperfect pairing). 29
30 Notes III: Intensity and concentration In general, our models assume a linear relationship (on a log-scale) between concentration of target present in the sample and signal intensity for a given probe. However, there are limitations to detection capability both at the low end of concentration (inability to distinguish signal from background) and the high end (saturation effects). 30
31 Types of microarrays cdna microarrays: probes are cdna base pairs in length, PCRd from custom libraries and spotted onto a microscope slide using a robot. Long-oligo spotted arrays: shorter but uniform length nucleotide probes, bp, usually synthesized and spotted as with cdna, but there are also Commercial spotted arrays (e.g., Agilent) spotting long oligo probes using inkjet technology. High-density short (e.g. 25 bp) oligo arrays (Affymetrix, Nimblegen) synthesized in situ. Single-channel. High-density long-oligo arrays: bp, synthesized in situ (Nimblegen) High-density bead arrays: Illumina 50bp, tag sequence hybridization 31
32 Microarray measurements All raw measurements are fluorescence intensities. We measure the amount of labelled target cdna which is bound to the immobilized probe by exciting the labelling molecules (the dye) with a laser, and collecting and counting the photons emitted. Dyes can be chosen to have different peak emission wavelengths, and so two (or more) measurements per probe may be made. In practice the entire glass slide or chip is scanned (excitation-emissioncounting of emitted photons), and the result is a digital image. This then needs to be processed to locate the probes in the image and assign intensity measurements to each of them. There can be from hundreds to millions of different probes on each slide/chip. For the next part of this lecture, Iʼll discuss two-channel microarrays. 32
33 Two colour arrays compare two RNA samples, e.g., normal vs mutant Normal Cell Isolate RNA and prepared fluorescently labeled cdna Mutant Cell Hybridize and Wash Channel 1 emission proportion to gene expression in mutant RNA, Channel 2 to normal RNA Channel 1 Excitation (Red HeNe Laser) Channel 1 Emission Image Acquisition Using 2 laser confocal scanning system Channel 2 Excitation (Red GreNe Laser) Channel 2 Emission 33

34 cdna microarray Image Scanner output consists of two TIFF images, one for each of red (Cy5) and green (Cy3) channels. Shown here is false-coloured image with two channels overlaid: more highly expressed in mutant equally expressed more highly expressed in normals AGRF NIA 15k mouse array: 32k spots, 12 x 4 pin groups 34

35 Arrows indicate print direction 26 x 26 spots in each pin group. also called print-tip group.there can be real pin effects, or spatial effects for which pin group provides a surrogate. 35
36 Quantification of expression Red, Green foreground : Rf, Gf Red, Green background : Rb, Gb Background corrected: R = Rf - Rb. G = Gf - Gb log-ratio ( Minus ): M = log 2 R - log 2 G Average intensity ( Add ): A = (log 2 R + log 2 G)/2 Lots of issues: which bg measure is best, to subtract or not to subtract bg, quality filtering, etc. 36
 Same slide Locations of spots with extreme 5% M: high, low 37")
37 Spatial bias in cdna arrays Log-ratios Print-tip groups Boxplots of M = log 2 R/G by print-tip group (1-16) Same slide Locations of spots with extreme 5% M: high, low 37

38 Spatial plots: background intensities 38
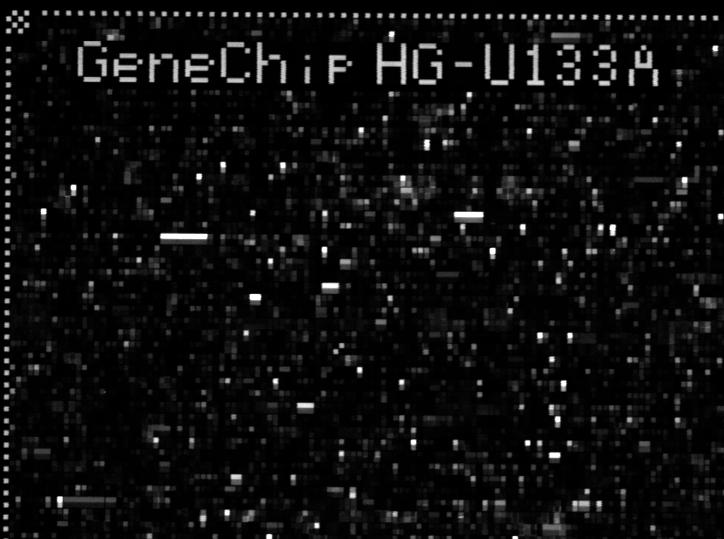
39 Affymetrix GeneChips Probes = 25 bp sequences Probe Sets = set of probes corresponding to a particular gene, EST or exon. In the past there has been 20 probes/probe set on human chips, 16 on mouse, while there are currently 11 on Human GeneChips HG-U133A. Most genes or ESTs contain one probe set, but quite a few have > 1. Newer arrays with a probeset for each exon are also available. 39

40 In situ synthesis of probes base by base 40

41 Hybridization of mrna to probes 41

42 Affymetrix GeneChip Arrays * * * * * 42
43 Perfect Match and MisMatch probes Perfect Match probe (PM) = 25 bp probe perfectly complementary to a specific region of a gene MisMatch probe (MM) = 25 bp probe agreeing with a PM apart from the middle base, which is different, being a transition (A G, C T) of that base. MMs were an attempt to measure cross-hybridization, and initially were subtracted from PM. They no longer are. Affymetrix has included a MM probe with every PM probe on every one of its chips, but this is not being done now. 43

44 mrna reference sequence PM: CAGACATAGTGTCTGTGTTTCTTCT MM CAGACATAGTGTGTGTGTTTCTTCT
45 45

46 Image Analysis DAT file (TIFF file data) Courtesy: F. Collin Chip dat file checkered board close up w/ grid 46

47 Chip dat file checkered board close up pixel selection 47
48 CEL and CDF files Image analysis of each scanned Affy array produces a CEL file containing the intensity (75th %ile, and other statistics) for each square probe cell. To do anything with this file you also need the CDF (Chip Description File) which specifies the probe and the probe set to which each cell belongs. CDF information is provided by CDF packages for R which can be downloaded from Bioconductor for the standard Affymetrix chips. 48
49 Pre-processing and summarization Computing expression values for each probe set requires 3-steps Background correction Normalization Probe set summaries More on this later in the course. 49
50 Annotations Each probe set is designed to measure a particular gene, but sometimes changes to the annotation of the genome of the organism you are working with may change the genes that certain probes map you. You may want to take this into account in your analysis. 50