Genomic information a tool for Assessment of Genetic diversity in Mithun
|
|
|
- Jack Stewart
- 5 years ago
- Views:
Transcription
1 Genomic information a tool for Assessment of Genetic diversity in Mithun Dr. (Mrs.) Anupama Mukherjee Dr. Sabyasachi Mukherjee Dr. A.O.Adebambo Imusososang Longkumer Moonmoon Mech and Dr. C.Rajkhowa

2 This I believe in genetics: Discovery can be a nuisance Replication is science, Implementation matters
3 I don't know what I may seem to the world,butastomyself,iseemtohave been only like a boy playing on the sea-shore and diverting myself in now and then finding a smoother pebble or a prettier shell than ordinary, whilst the great ocean of truth lay all undiscoveredbeforeme IssacNewton( )


4 NRC on Mithun (ICAR)
5 Pebbles and Ocean The Mithun research has been able to find so many beautiful pebbles and shells. Works on genetics, nutrition, product and value addition. Present day research now desires to leave the pebbles and shells at the shore and go deep to search for prettier jewels at the ocean floor. This is the field of genome selection
6 Introduction Mithun (Bos frontalis), a ruminant species belonging to family bovidae, assumed to be the domesticated form of wild gaur (Bos gaurus) Indigenous to the eastern Himalayas and has been referred to as sacrificial ox of the Naga Tribes of NEH.
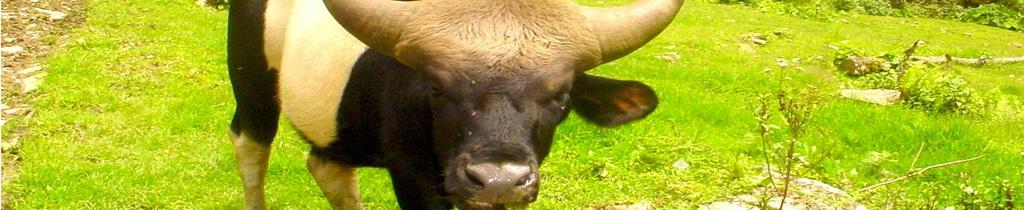
7 Strains of mithun Four strains Arunachal, Nagaland, Mizoram and Manipur

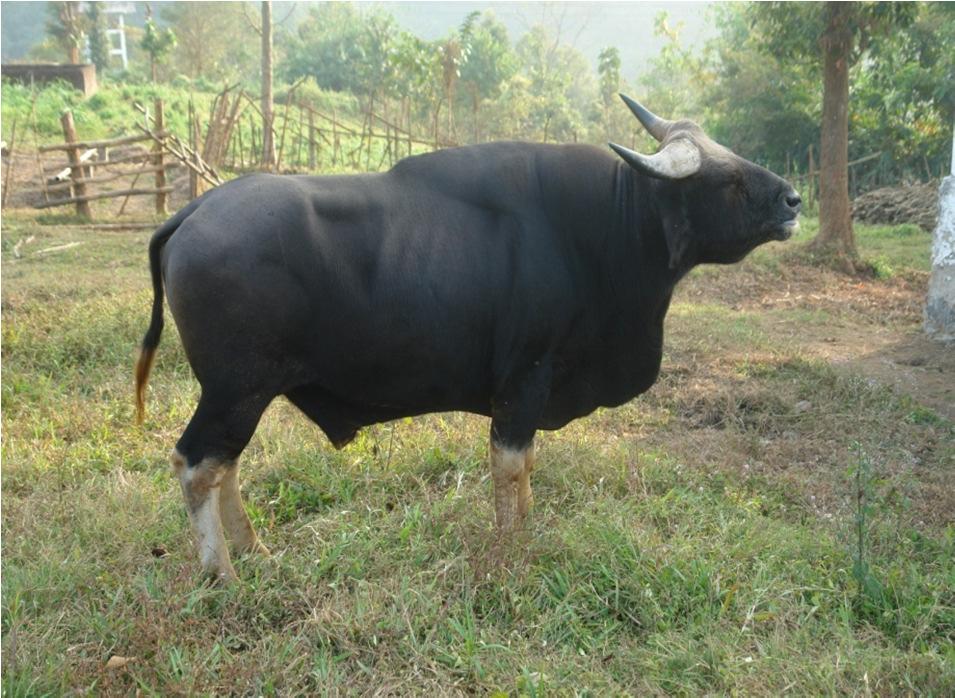
8 Nagaland strain Arunachal strain

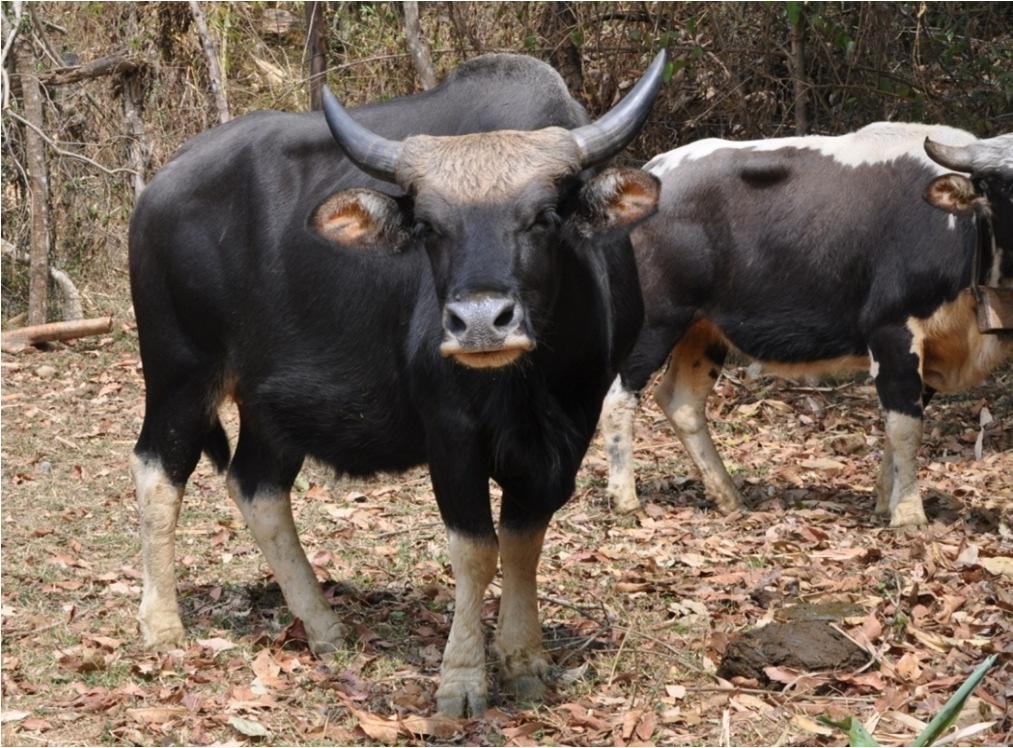
9 Manipur strain Mizoram strain
10 Population distribution of Mithun in India State Arunachal Pradesh (74%) (70.21%) (69.06%) (82.89%) Nagaland (10.12%) (18.90%) (14.39%) (12.59%) Manipur (15%) (9.42%) (7.19%) (3.79%) Jammu & Kashmir ,000 (8.63 %) - Mizoram 1435 (1%) 2594 (1.47%) 2000 (0.73%) 1939 (0.73%) Total
11 Prospects and Challenges The world population will reach 9 billion people by The traditional livestock farming will face greatest challenges in fulfilling the growing food demand with fewer resources, (FAO, 2006). Increase in global meat consumption of 68% and in global milk consumption of 57% by 2030 (Steinfeld and Gerber, 2010). Needs to apply scientific advancements (innovations) and general improvement of animal to fill the productivity gaps with reduce costs and limit environmental impacts (Capper, 2011). New advances --- whole genome sequencing cattle & swine --- to improve accuracy of genomic selection or --- mapping new QTL (Meuwissen & Goddard, 2010)

12 Why Genomics?? Traditionally, phenotypic & pedigree information genetic evaluations (EBV) The biggest (r) evolution -- emergence & application of genomics in livestock breeding. For breeders, genomics = efficiency & productivity ---for consumers = security & quality of animal products. Genomics proposes ---- improve selection accuracy costs, generation intervals, and exploiting new sources of polymorphisms
13 A route developed and taken by breeders: From gene pool to superior germplasm Gene pool Superior Germplasm


14 A Walk Through Our Genome -- All regions of the genome are not created equal
15 Overview Why genomics important for the genetic improvement of mithun? Organization of mithun genome Tools in the toolbox SNP markers High density assays How we use the tools to detect and exploit genetic variation Linkage Disequilibrium Linkage Genome Selection (GS)


16 1. Why genomics for the genetic improvement of mithun?? Mithuns are reared traditionally in forest, no proper recording trait and no pedigree information. Mithun meat is better than cattle and buffalo in terms of quality and quantity. Efficient convertor of forages and tree leaves into meat and milk, --- and is considered a future dairy and meat animal in the scenario of climate change and scarcity of nutrition. To assess the genetic worth of mithun is the bottleneck in the genetic improvement and selection in this species.
 that contribute to the phenotypic variation.")
17 A genome-wide association study involves highthroughput genotyping platforms for rapidly scanning markers across whole genome and to find genetic variations associated with a particular phenotype. The main aim to conduct Genomic study in Mithun, is to identify chromosome regions that harbor the gene(s) that contribute to the phenotypic variation. The identified SNPs with high effects can be selected to obtain more accurate breeding values for effecting genomic selection in Mithun where no phenotypic observations are available.

18 2. Organization of Mithun Genome
 ~3.")

19 The Biology Assures Variation in Progeny Mithun have 29 pairs of chromosomes 28 autosomes, 1 sex determining Diploid (2 copies of each chromosome) ~3.5 Billion base pairs Meiotic cell division forms gametes Eggs and sperm are haploid 1 chromosome from each pair; random Recombination or cross-over events Fertilization restores diploid chromosome count Two copies of each gene Alternate forms are called allele

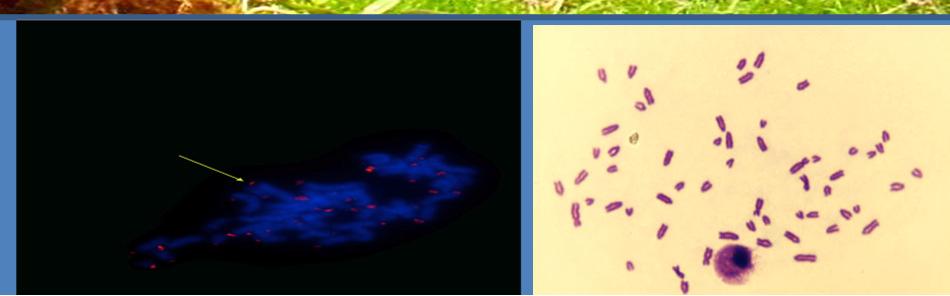
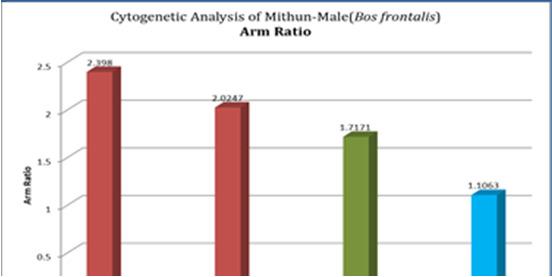

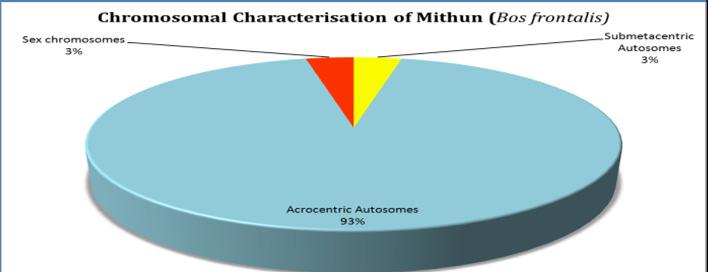
20 Bos frontalis

21 3. Tools available - Genomics Tool Box SNP Markers High density assays
22 Single Nucleotide Polymorphism (SNP) DNA Marker Example G/T SNP 1 BTA-6 ATCGTAGATATTGGCC TAGCATCTATAACCGG 2 BTA-6 ATCGTATATATTGGCC TAGCATATATAACCGG Mutation may be in exon (coding sequence; possibly causal) or in intron (non-coding sequence) of gene
23 SNPs and QTNs BTA-6 Marker 1 G T Quantitative Trait Nucleotide (QTN) = Favorable Allele = Unfavorable Allele
24 What a Marker Test Tells You: Marker 1 But What About These Genes?


25 I have found one more also!! How many??

26 What an EPD Tells You: Cumulative effect of all genes and their interactions on a trait.
27 A Question of Resolution Mithun Genome as distance New Delhi to Dimapur~2,500 Km. 3K panel is equivalent to marker every == 100Km. 50K panel is marker every == Km. 700K panel is marker every == meter.
28 Research Transition for Higher Density Panels Mithun Genome ~3.5 Billion bp; 3K SNP/1.17 Mb

29 Linkage The tendency of certain loci to be inherited together Loci that are close to each other on chromosome tend to stay together during meiosis. Crossing over (recombination) breaks up linkage.
30 Linkage Disequilibrium (LD) LD is the non-random association of alleles (markers) at two or more loci. LD describes the ability of SNP at one locus to act as surrogates for SNP at another locus Think correlation ability of SNP at locus 1 to predict SNP at locus 2 0 = independent, 1 = dependency λa1 = 0.95 A1 r~1 B1 λb1 = 0.93 λa2 = 0.05 A2 r~1 B2 λb2 = 0.07

31 How do we use these tools?
32 Genome Wide Association Study (GWAS) Find associations a subset of markers (from a panel of markers) with variation in a trait (s) Variety of methods available With 50K panel not all markers associated with a trait(s), in fact many are not Estimation of Genomic Breeding Value (GBV) ---- Genomic Selection (GS)


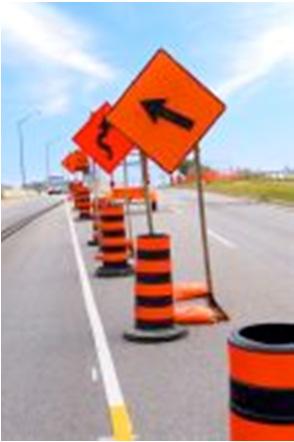

33 Developing infrastructures and sign posts for providing directions
 alleles MABC: MARKER-ASSISTED")


34 A variety of approaches (cars) MAS: MARKER-ASSISTED SELECTION - Animals are selected for one or more (up to 8-10) alleles MABC: MARKER-ASSISTED BACKCROSSING One or more (up to 6-8) donor alleles are transferred to an elite line MARS: MARKER-ASSISTED RECURRENT SELECTION Selection for several (up to 20-30) mapped QTLs relies on index (genetic) values computed for each individual based on its haplotype at target QTLs GWS: GENOME-WIDE SELECTION Selection of genome-wide several loci that confer tolerance/resistance/ superiority to traits of interest using GEBVs based on genome-wide marker profiling
35 Genome wide selection Relatively young technology Widely adopted Mainly used in gene discovery
36 Objective To characterize the mithun population structure for determining the genetic diversity within population. To validate the Bovine SNP770K HD Bead Chip and to determine the level of polymorphism and allele frequency distribution in Mithun population.
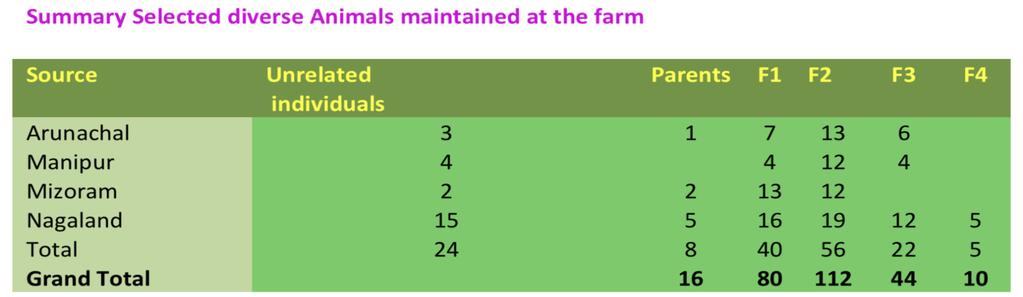
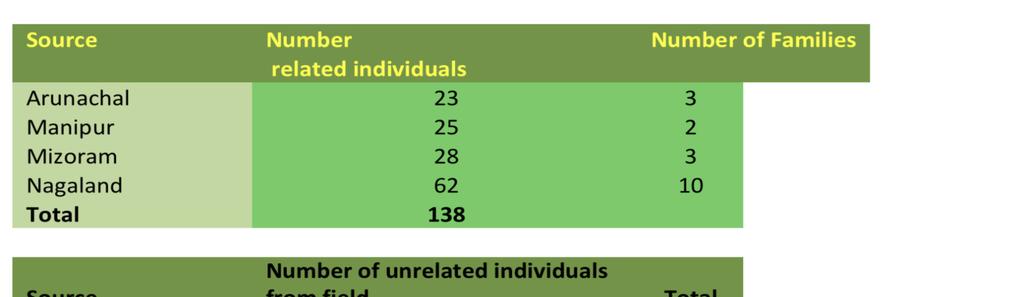
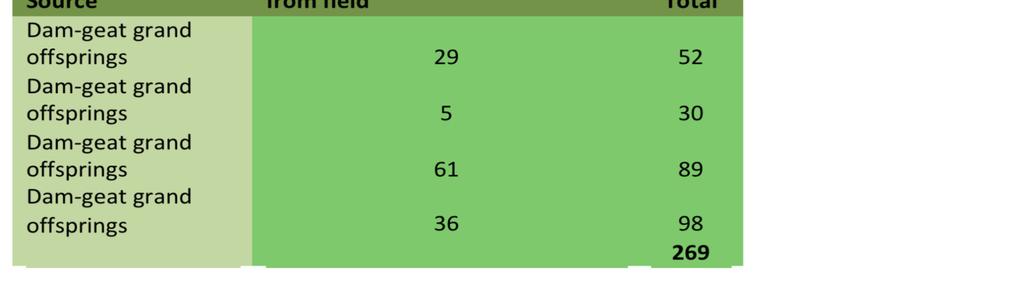
37 Methodology METHODS Study Population 1. Farm stock Parents, F 1, F 3 and F 4 populations maintained at the NRC on Mithun farm with phenotypic data records. This are especially needed for association studies. 2. Field stock Blood samples collected all around. Needed for population study
38
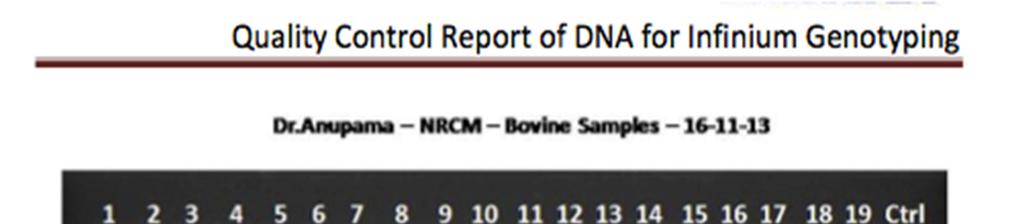
39 Work Plan Work Plan To characterize the mithun population structure for determining the genetic diversity within the mithun population. Selection of mithuns from four different strains and recording of phenotypic parameters related to growth. Estimation of statistical parameters to determine genetic diversity. Isolation of DNA and assessment of quality and concentration. Generation of genotypic data using 770K HD bovine Bead Chip. Identification of clusters using appropriate statistical software and method.
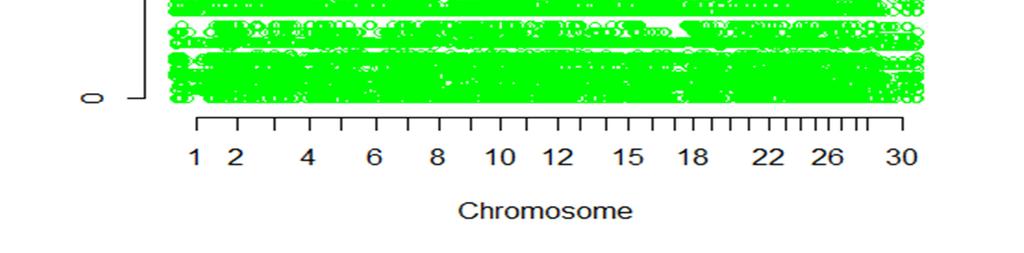
40 To validate the Bovine SNP770K HD Bead Chip and to determine the level of polymorphism and minor allele frequency distribution in Mithun population. Genotype information and quality control of the genotypic data viz exclusion of sample duplication based on Identity by state (IBS) pruning of genotypic data, estimation of minor allele frequency, SNP call rates and final testing for Hardy- Weinberg Equilibrium. Statistical parameters were generated for dependent traits.
41 QC Steps (1) Check genotype gender Filter Mendelian inhertance (family-based) Check for relatedness...
42 QC Steps (2) SNPs that fail Hardy-Weinberg Suppose a SNP with alleles A and B has allele frequency of p. If random matting, then AA has frequency p*p AB has frequency 2*p*(1-p) BB has frequency (1-p)*(1-p)
43 QC Steps (3) SNPs with low call rate (e.g., <97%) (GCR) Proportion of SNPs actually called by software If it's low, the clusters aren't well defined, artifacts with low minor allele frequency (MAF< 0.05 )? SNPs / Individuals who have too much missing data

44
45 Basic diversity indices across population based on 127,432 SNPS N H ob ±SD H ex ±SD Inbreeding f IBS±SD % SNPS not in HWE (P 0.05) % Markers with MAF 0.05 Arunac hal Manip ur Mizora m Nagala nd ± ± ± ± ± ± ± ± ± ± ± ± ± ± ± ± ± ± ± ±
46 Global and pairwise fixation indices for mithun strains using 127,432 SNPs Arunachal Manipur Mizoram Nagaland Arunachal Manipur Mizoram Nagaland F IS F IT F ST
47 Figure 1. Population stratification of mithun strain based on PCA across 127,432 SNPs. PC1 showing north-south orientation, while PC2 shows an east west orientation.
48 Figure 2. Neighbourjoining tree reconstructed using MEGA 5.2 software from 127,432 SNPs among strains of mithun populations.


49 Figure 3. Plot of cross validation error for k for the population structure analysis. Figure 4. Estimated Population Structure using 127, 432 SNPs generated by ADMIX for K=2-5
50
51 Conclusions In this study the use of the Illumina 770k HD Bead chip has not being successful enough to infer using it as a tool for selection purpose in mithun improvement program. Inclusion of mithun genome in future design will aid such purpose. The mithun population show little divergence from each other based on the polymorphic loci. There was no substructure inferred. Non sub structure can either be due to the difference in the chip used or geographical distance of the mithun population is not enough to label them as separate populations.
52 Recommendation This preliminary study being the first of its kind on mithun has been able to show that 80% of the SNPs on the array have MAF < 0.05, so approximately 20% are polymorphic (1/5). For the purpose of conservatory program via utilization or ex-situ conservation of the mithun it is recommended before genome wide SNP analysis can be achieved a whole-genome re-sequence of a pool of 10 individuals (1 library) on Illumina HiSeq2000 is carried out. Map reads could then be done to UMD3.1 genome, or try de novo assembly.
53 Possible outcomes Breeder-friendly genome database of mithun.
54 Anupama Mukherjee; Sabyasachi Mukherjee; A.O.Adebambo; Imusosang Longkumer; Moonmoon Mech and C.Rajkhowa We are key to the success!


55 Thank you!! Preserve Biodiversity, Secure Future!


56 Investing in science : Securing our future

57 Genetics G E interaction Environment Health outcome or?