Exercices: Metagenomics. Find Rapidly OTU with Galaxy Solution
|
|
|
- Roy Holland
- 5 years ago
- Views:
Transcription


1 Exercices: Metagenomics Find Rapidly OTU with Galaxy Solution F R É D É R I C E S C U D I É * a n d L U C A S A U E R *, M A R I A B E R N A R D, L A U R E N T C A U Q U I L, K AT I A V I D A L, S A R A H M A M A N, M A H E N D R A M A R I A D A S S O U, G U I L L E R M I N A H E R N A N D E Z - R A Q U E T, G É R A L D I N E PA S C A L * T H E S E A U T H O R S H A V E C O N T R I B U T E D E Q U A L L Y T O T H E P R E S E N T W O R K. 1
2 Normalisation Demultiplexing Data acquisition Pre-process Clustering Chimera Affiliation Statistics Filters Convert to TSV 2
3 Introduction to Galaxy 3

4 Galaxy Portal from SIGENAE GENOTOUL 4

5 MAIN MENU AVAILABLE TOOLS DATASETS HISTORY TOOL CONFIGURATION AND EXECUTION 5
6 Your turn! - 1 LAUNCH DEMULTIPLEX READS TOOL 6
7 Upload data 7
8 Your turn: exo 1 Create the 1st history multiplexed Import files «multiplex.fastq» and «barcode.tabular» present in the Genotoul folder /work/formation/frogs/ Create the 2nd history 454 Import file «454.fastq.gz» present in the Genotoul folder /work/formation/frogs/ Create the 3rd history MiSeq R1 R2 Import files «samplea_r1.fastq» and «samplea_r2.fastq» present in the Genotoul folder /work/formation/frogs/ Create the 4th history MiSeq contiged Import archive file «100spec_90000seq_9samples.tar.gz» present in the Genotoul folder /work/formation/frogs/ 8


9 History creation 9


10 Upload data: different methods Default method, your files are on your computer, they are copied on your Galaxy account You can only upload one file at a time 10 samples 10 uploads Each uploaded file will consume your Galaxy s quota! 10


11 Upload data: different methods Do not forget to precise the input file type Specific SIGENAE GENOTOUL method. It allows you to access to your files in your work account on the Genotoul without consuming your Galaxy quota. And if you have multiple samples? See How_to_create_an_archiveTAR.ppt How to transfer files on /work of Genotoul? See How_to_transfert_to_genotoul.ppt 11

12 Upload data: different methods If you have an archive on your own computer, you will use this specific FROGS tool to upload your samples archive instead of the default «Upload File» of Galaxy. 12
13 Your turn! - 2 LAUNCH DEMULTIPLEX READS TOOL 13
14 Demultiplexing tool 14


15 Normalisation Demultiplexing Data acquisition Pre-process Clustering Chimera Affiliation Statistics Filters Convert to TSV 15

16 multiplexed The tool parameters depend on the input data type Demultiplexing 16
17 multiplexed Your turn: exo 2 In multiplexed history launch the demultiplex tool: «The Patho-ID project, rodent and tick s pathobioms study, financed by the metaprogram INRA-MEM, studies zoonoses on rats and ticks from multiple places in the world, the co-infection systems and the interactions between pathogens. In this aim, thay have extracted hundreads of or rats and ticks samples from which they have extracted 16S DNA and sequenced them first time on Roche 454 plateform and in a second time on Illumina Miseq plateform. For this courses, they authorized us to publicly shared some parts of these samples.» Parasites & Vectors (2015) 8:172 DOI /s Detection of Orientia sp. DNA in rodents from Asia, West Africa and Europe. Jean François Cosson, Maxime Galan, Emilie Bard, Maria Razzauti, Maria Bernard, Serge Morand, Carine Brouat, Ambroise Dalecky, Khalilou Bâ, Nathalie Charbonnel and Muriel Vayssier-Taussat 17

18 multiplexed Your turn: exo 2 In multiplexed history launch the demultiplex tool: Data are single end reads only 1 fastq file Samples are caracterized by an association of two barcods in forward and reverse strands multiplexing «both ends» 18
19 multiplexed Your turn: exo 2 Demultiplex tool asks for 2 files one «fastq» and one «tabular» 1. Play with pictograms 2. Look at the stdout, stderr when available (in the «i» pictogram ) 19

20 multiplexed 14: /work/frogs/formation/barcode.tabular 20
21 multiplexed For your own data Advices Do not forget to indicate barcode sequence as they actually are in the fastq sequence file, especially if you have data multiplexed via the reverse strand. For the mismatch threshold, we advised you to let the threshold to 0, and if you are not satisfied by the result try with 1. The number of mismatch depends on the length of the barcode, but oftently those sequence are very short so 1 mismatch is already more than the sequencing error rate. If you have different barcode length, you must demultiplex your data in different times beginning by the longest barcode set and used the "unmatched" or "ambiguous" sequence with smaller barcode and so on. If you have Roche 454 sequences in sff format, you must convert it with some program like sff2fastq 21


")

22 multiplexed Results With barcode mismatches >1 sequence can corresponding to several samples. So these sequences are non-affected to a sample. Create a tar archive by grouping one (pair) fastq file per sample whith names indicate in the first column of the barcode tabular file Sequences without known barcode. So these sequences are non-affected to a sample. 22
23 Your turn! - 3 LAUNCH THE PRE-PROCESS READS TOOL 23
24 Pre-process tool 24
25 FROGS pipeline Data acquisition Pre-process Clustering Chimera Affiliation 25
26 454 Your turn: exo 3.1 Go to «454» history Launch the pre-process tool on that data set objective : understand the parameters 26
27 454 29: /work/frogs/formation/454.fastq Primers used for sequencing V3-V4: Forward: ACGGGAGGCAGCAG Reverse: AGGATTAGATACCCTGGTA 27
28 454 Your turn: exo 3.1 What does the «dereplicated.fasta» file? What does the «count.tsv» file? Explore the file «excluded_data.html» 28

29 To be kept, sequences must have the 2 primers 29
30 MiSeq R1 R2 Your turn: exo 3.2 Go to «MiSeq R1 R2» history Launch the pre-process tool on that data set objective: understand flash software 30
31 >ERR M00704 CCGTCAATTCATTGAGTTTCAACCTTGCGGCCGTACTTCCCAGGCGGTACGTT TATCGCGTTAGCTTCGCCAAGCACAGCATCCTGCGCTTAGCCAACGTACATCG TTTAGGGTGTGGACTACCCGGGTATCTAATCCTGTTCGCTACCCACGCTTTCG AGCCTCAGCGTCAGTGACAGACCAGAGAGCCGCTTTCGCCACTGGTGTTCCTC CATATATCTACGCATTTCACCGCTACACATGGAATTCCACTCTCCCCTTCTGC ACTCAAGTCAGACAGTTTCCAGAGCACTCTATGGTTGAGCCATAGCCTTTTAC TCCAGACTTTCCTGACCGACTGCACTCGCTTTACGCCCAATAAATCCGGACAA CGCTTGCCACCTACGTATTACCGCNGCTGCT MiSeq R1 R2 Primers used for this sequencing : Forward: CCGTCAATTC Reverse: CCGCNGCTGCT Lecture
32 MiSeq R1 R2 Your turn: exo 3.2 Interpret the «excluded_data.html» file. 32
33 MiSeq contiged Your turn: exo 3.3 Go to«miseq contiged» history Launch the pre-process tool on that data set objective: understand output files 33
34 MiSeq contiged Your turn: exo samples are technically replicated 3 times : 9 samples of sequences each. 100_10000seq_sampleA1.fastq 100_10000seq_sampleB1.fastq 100_10000seq_sampleC1.fastq 100_10000seq_sampleA2.fastq 100_10000seq_sampleB2.fastq 100_10000seq_sampleC2.fastq 100_10000seq_sampleA3.fastq 100_10000seq_sampleB3.fastq 100_10000seq_sampleC3.fastq 34
35 MiSeq contiged Your turn: exo 3.3 Grinder (v 0.5.3) (Angly et al., 2012) was used to simulate the PCR amplification of full-length (V3-V4) sequences from reference databases. The reference database of size 100 were generated from the LTP SSU bank (version 115) (Yarza et al., 2008) by (1) filtering out sequences with a N, (2) keeping only type species (3) with a match for the forward (ACGGRAGGCAGCAG) and reverse (TACCAGGGTATCTAATCCT) primers in the V3-V4 region and (4) maximizing the phylogenetic diversity (PD) for a given database size. The PD was computed from the NJ tree distributed with the LTP. 35
36 MiSeq contiged Primers used for this sequencing : 5 primer: ACGGGAGGCAGCAG 3 primer: AGGATTAGATACCCTGGTA Lecture
37 MiSeq contiged Your turn: exo Questions 1. How many sequences are there in the file? 2. How many sequences did not have the 5 primer? 3. How many sequences still are after pre-processing the data? 4. How much time did it take to pre-process the data? 37
38 Your turn! - 4 LAUNCH CLUSTERING AND CLUSTERSTAT TOOLS 38
39 Clustering tool 39
40 FROGS pipeline Data acquisition Pre-process Clustering Chimera Affiliation 40


41 Clustering 1st run for denoising: Swarm with d = 1 high OTUs definition linear complexity 2 nd run for clustering: Swarm with d = 3 on the seeds of first Swarm quadratic complexity Gain time! Remove false positives! PeerJ PrePrints 2:e386v doi: /peerj.preprints.386v1 Swarm: robust and fast clustering method for amplicon-based studies. Mahé F, Rognes T, Quince C, de Vargas C, Dunthorn M. 41
42 MiSeq contiged Your turn: exo 4 Go to «MiSeq contiged» history Launch the Clustering SWARM tool on that data set objectives : understand the denoising efficiency understand the ClusterStat utility 42
43 MiSeq contiged Your turn: exo 4 1. Launch FROGS Clustering with d = 3 and with denoising option checked a. How much time does it take to finish? b. How many clusters do you get? 43
44 MiSeq contiged Your turn: exo 4 3. Edit the biom and fasta output dataset by adding d1d3 44
45 MiSeq contiged Your turn: exo 4 2. Use the FROGS ClusterStat tool 3. Interpret the boxplot: Clusters size summary 4. Interpret the table: Clusters size details 5. What can we say by observing the sequence distribution? 6. How many clusters share sampleb3 with at least one other sample? 7. How many clusters could we expect to be shared? 8. How many sequences represent the 668 specific clusters of samplec2? 9. This represents what proportion of samplec2? 10. What do you think about it? 11. How do you interpret the «Hierarchical clustering»? The «Hierachical clustering» is established with a Bray Curtis distance particularly well adapted to abundance table of very heterogenous values (very big and very small figures). 45
46 Your turn! - 5 LAUNCH THE REMOVE CHIMERA TOOL 46
47 Removing chimera tool 47

48 FROGS pipeline Data acquisition Pre-process Clustering Chimera Affiliation Our advice: Removing Chimera after Swarm denoising + Swarm d=3 48


49 Chimera 49
50 MiSeq contiged Your turn: exo 5 Go to «MiSeq contiged» history Launch the «FROGS Remove Chimera» tool Follow by the «FROGS ClusterStat» tool on the d1d3 biom and fasta objectives : understand the efficiency of the chimera removal make links between small abundant OTUs and chimeras 50
51 MiSeq contiged Your turn: exo 5 1. Understand the «excluded_data_reportd1d3.html» a. How many clusters are kept after chimera removal? b. How many sequences that represent? So what abundance? c. What do you conclude? 51


52 MiSeq contiged Your turn: exo 5 2. Launch «FROGS ClusterStat» tool on non_chimera_abundanced1d3.biom 3. Rename outputs in summarynonchimerad1d3.html 4. Compare the HTML files a. Of what are mainly composed singleton are weakly abundant OTUs? b. What sequence abundances are they representing? c. What do you conclude? The weakly abundant OTUs are mainly false positives, our data would be much more exact if I remove them 52
53 Your turn! - 6 LAUNCH DE LA TOOL FILTERS 53
54 Filters tool 54
55 Data acquisition Pre-process Clustering Chimera Affiliation Statistics Filters Convert to TSV 55
56 Filters Filters allows to filter the result thanks to different criteria et may be used after different steps of pipeline : On phix contaminant On the abundance On RDP affiliation On Blast affiliation After Affiliation tool 56


57 Input Filters Output 4 filter sections 57
58 MiSeq contiged Your turn: exo 6 I. Go to history«miseq contiged» II. Launch «Filters» tool with non_chimera_abundanced1d3.biom, non_chimerad1d3.fasta III. Apply 2 filtres --proportion/number of sequences threshold to remove an OTU: * and --Remove OTUs that are not present at least in XX samples; how many samples do you choose? : 3 objective : play with filters, understand their impact on falses-positives OTUs *Nat Methods Jan;10(1):57-9. doi: /nmeth Epub 2012 Dec 2. Quality-filtering vastly improves diversity estimates from Illumina amplicon sequencing. Bokulich NA 1, Subramanian S, Faith JJ, Gevers D, Gordon JI, Knight R, Mills DA, Caporaso JG. 58
59 MiSeq contiged Your turn: exo 6 1. What are the output files of Filters? 2. Explore summary.html file. 3. How many OTUs have you removed with the filter ? 4. How many OTUs have you removed with the filter Remove OTUs that are not present at least in 3 samples? 5. How many sequences represent these for each of the filters? 6. How many OTUs do they remain? 7. Build the Venn diagram on the two filters. 8. What you says krona.html? 59
60 Your turn! - 7 LAUNCH THE «FROGS AFFILIATION» TOOL 60
61 Affiliation tool 61
62 FROGS pipeline Data acquisition Pre-process Clustering Chimera Affiliation 62
63 Affiliation 2 methods used on one reference database, here SILVA 119 (16S or 18S): RDP Classifier (Ribosomal Database Project) * NCBI Blast+ ** RDP Classifier affiliation caracteristics: Boostrap value for each taxonomic subdivision NCBI Blast+ affiliation caracteristics: identity % coverage % e-value alignment length * Appl. Environ. Microbiol. August 2007 vol. 73 no doi : /AEM Naïve Bayesian Classifier for Rapid Assignment of rrna Sequences into the New Bacterial Taxonomy. Qiong Wang, George M.Garrity, James M. Tiedje and James R. Cole ** BMC Bioinformatics 2009, 10:421. doi: / BLAST+: architecture and applications Christiam Camacho, George Coulouris, Vahram Avagyan, Ning Ma, Jason Papadopoulos,Kevin Bealer and Thomas L Madden 63

64 Affiliation 64
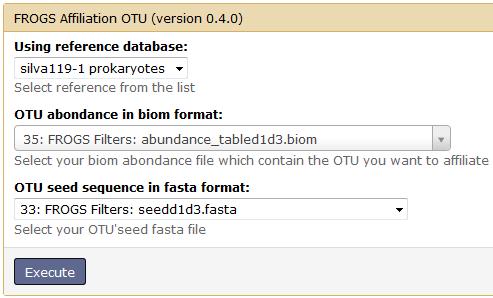
65 MiSeq contiged Your turn: exo 7 Go to «MiSeq contiged» history Launch the «FROGS Affiliation» tool with silva_119-1_prokaryotes abundance_tabled1d3.biom seed1d3.fasta objectives : understand abundance tables columns understand the RDP and BLAST affiliation complementarity 65
66 MiSeq contiged Your turn: exo 7 1. What are the «FROGS Affiliation» output files? 2. How many sequences are affiliated by BLAST? 3. Click on the «eye» button on the BIOM output file, what do you understand? 4. Use the Biom_to_TSV tool on this last file and click again on the eye on the new output generated, on what correspond the columns? 66
67 MiSeq contiged Your turn: exo 7 5. Compare RDP and Blast affiliations #rdp_tax_and_bootstrap blast_subject blast_evalue blast_len Bacteria;(1.0);Fibrobacteres;(1.0);Fibro bacteria;(1.0);fibrobacterales;(1.0);fib robacteraceae;(1.0);fibrobacter;(1.0);f ibrobacter succinogenes subsp. succinogenes S85;(1.0); blast_perc_q blast_perc_id uery_covera entity ge JX blast_taxonomy Root;Bacteria;Fibrobacteres;Fibrobacteria;Fib robacterales;fibrobacteraceae;fibrobacter;un known species 67

68 Blast JX vs our OTU OTU length : 401 Excellent blast but no matches at the end of OTU. Chimera? 68
69 What do you think about this case? #rdp_tax_and_bootstrap blast_subject blast_evalue blast_len Bacteria;(1.0);Proteobacteria;(1.0);Alp haproteobacteria;(1.0);caulobacterale s;(1.0);hyphomonadaceae;(1.0);henric iella;(1.0);henriciella marina;(0.18); AQXT blast_perc_q blast_perc_id uery_covera entity ge blast_taxonomy Root;Bacteria;Proteobacteria;Alphaproteobac teria;caulobacterales;hyphomonadaceae;hen riciella;henriciella marina DSM
70 Your turn! - 8 LAUNCH NORMALIZATION TOOL 70
71 You turn : exo 8 1. Normalize your data from Clustering 71
72 Your turn! - 9 CREATE YOUR OWN WORKFLOW! 72
73 Workflow creation 73

74 MiSeq contiged Your turn: exo 9 74

75 MiSeq contiged Your turn: exo


76 MiSeq contiged Your turn: exo

77 77