No wash 2 Washes 2 Days ** ** IgG-bead phagocytosis (%)
|
|
|
- Brian Matthew Bates
- 5 years ago
- Views:
Transcription
1 Supplementary Figures Supplementary Figure 1. No wash 2 Washes 2 Days Tat Control ** ** IgG-bead phagocytosis (%) Supplementary Figure 1. Reversibility of phagocytosis inhibition by Tat. Human MDMs were treated for 5 h with 2 nm Tat. Phagocytosis of IgG-coated beads was then assayed either directly (No wash), after 2 washes with DMEM or after 2 days of MDM culture. Data are mean + s.e.m. of three independent experiment. Student's t-tests (**, p <.1) were performed comparing with the no wash conditions. 1
2 Supplementary Figure 2 a b CD26 level (% of control MFI) Tat WT Tat W11Y CD64 level (% of control MFI) Tat WT Tat W11Y Time (h) Time (h) Supplementary Figure 2. Tat does not affect the ectopic expression of the mannose receptor (CD26) or the Fc RI receptor (CD64) in MDMs. Human MDMs were treated with 2 nm Tat or Tat-W11Y for the indicated time before washing with ice-cold PBS on ice. They were then treated with 5 mm EDTA in PBS for 15 min at 4 C, scraped gently and centrifuged before staining with a fluorescein-labelled anti-cd26, anti-cd64 antibody or an isotypic control, then FACS analysis on a FACSCalibur. Cells were not permeabilized. Data are expressed as mean fluorescence intensity (MFI) of the cell population, gating on the main cell population. Similar data were obtained using two independent MDM preparations from two different donors. Data are mean + s.e.m. of two independent experiments. 2


 or (M.")
, before")
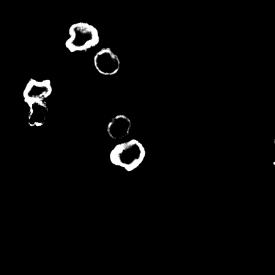
3 T. gondii M. avium Supplementary Figure 3 Control +Tat Supplementary Figure 3. Tat inhibits phagocytosis of Mycobacterium avium and opsonized Toxoplasma gondii. MDMs were treated with 2 nm Tat WT for 6 h at 37 C before assaying phagocytosis of M. avium or opsonized T. gondii labelled with fluorescein or stably transfected with GFP, respectively. Phagocytic targets were added for 7-1 min at a target / macrophage ratio of 2 (T. gondii) or (M. avium). Extracellular pathogens were then stained on ice using fluorescent antibodies (red), before fixation and examination under a fluorescent microscope. The contours of the cells are indicated by a dotted line, and arrows point to pathogens. Few extracellular M. avium were observed. Bar, 5 µm. Quantification is in Fig.2g. 3


4 Supplementary Figure 4 Tat Merged (55-57)A (49-51)A W11Y WT Supplementary Figure 4. Intracellular localization of Tat relies on PI(4,5)P 2 binding. RAW macrophages were transfected with Tat or the indicated mutant. After 18 h, cells were fixed and Tat was labelled using immunofluorescence while was stained using fluorescent phalloidin. Representative median confocal sections are shown. Bar, 1 µm. 4
5 Supplementary Figure 5 PH-PLCd Merged Supplementary Figure 5. PI(4,5)P 2 is concentrated in pseudopods at the rims of the cup. RAW macrophages were transfected with an EGFP chimera of the PH-PLC that specifically binds to PI(4,5)P 21. After 18 h, opsonized SRBCs were added for 3 min at 37 C before fixation, permeabilization and staining using fluorescent phalloidin. A representative median confocal section is shown. The arrow points to the phagocytic cup. Bar, 5 µm. 5


6 Supplementary Figure 6 SRBCs Merged + Tat + Tat 6
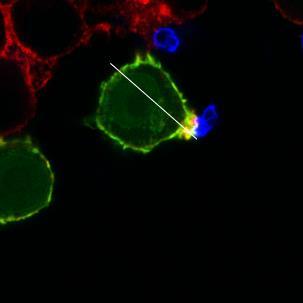
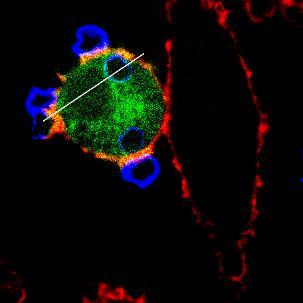
7 2 cdc Tat cdc42 2 +Tat Tat + Tat *** Recruitment to the cup (percent of cells) Supplementary Figure 6. Transfected Tat inhibits the recruitment of to the IgG-SRBCs phagocytic site. RAW macrophages were transfected with a vector encoding the indicated EGFP-GTPase chimera and either an empty or a Tat-encoding vector (1/1 ratio). After 18 h IgG- SRBCs were added for 3 min, before fixation, permeabilization, staining with phalloidin and SRBC labelling with fluorescent antibodies. Cells were viewed under a confocal microscope, and representative optical sections are shown. Bar, 5 µm. The fluorescence intensity along the line (width 5 pixels) indicated on the merged image is shown on the corresponding plot. The histogram represents the percentage of cups (from n > 2 cells from three independent experiments) showing significant recruitment of the indicated GTPase. Student's t-test (***, p <.1) were performed comparing with the minus Tat conditions. 7


8 Supplementary Figure 7 Merged Zymosan + Tat + Tat + PIPKi + Tat 8
9 2 cdc Tat WT 2 + Tat WT Tat WT +PIPKi Tat11Y + Tat11Y +Tat+PIPKi + Tat + Tat *** Recruitment to the cup (percent of cells) 9
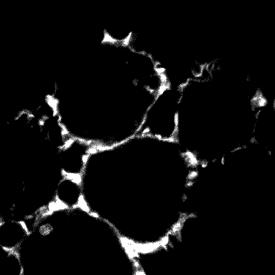
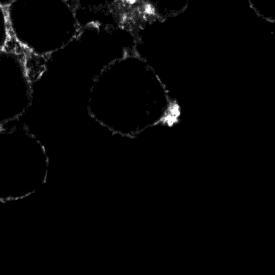
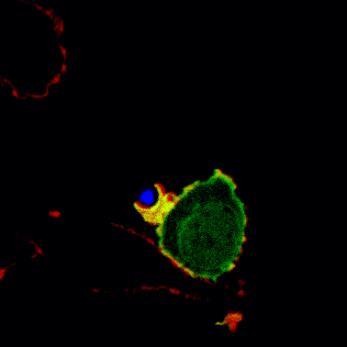
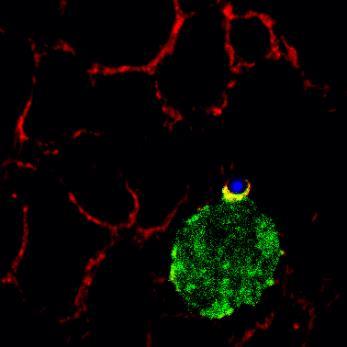
10 Supplementary Figure 7. Tat inhibits the recruitment of to the zymosan phagocytic site. RAW macrophages were transfected with a vector encoding the indicated EGFP-GTPase chimera. When indicated, PIPKi was cotransfected (ratio 1/1). After 18 h cells were treated with 1 nm Tat (or Tat-W11Y) for 5 h before adding fluorescent zymosan for 3 min, fixation, permeabilization, staining with phalloidin and viewing under a confocal microscope. Representative optical sections are shown. Bar, 1 µm. The plots show the fluorescence intensity along the line (width 5 pixels) indicated on the merged image. The histogram represents the percentage of cups (from n > 2 cells from three independent experiments) showing significant recruitment of the indicated GTPase. Student's t-test (***, p <.1) were performed comparing with the minus Tat conditions. 1

 objective and a cooled CCD camera. CFP and FRET images were recorded using CFP excitation. Images were processed using Metamorph and image J. Pseudocolors corresponds to FRET/CFP ratio in the 1.")
11 Supplementary Figure 8 Control +Tat Ratio CFP Ratio CFP Supplementary Figure 8. Tat inhibits activation at the phagocytic cup. RAW macrophages were transfected with the Raichu probe allowing to measure activation using intramolecular FRET measurements. After 24 h cells were pretreated or not with Tat, before adding opsonised SRBCs as phagocytic targets. Cells were imaged at 37 C using a Nikon inverted microcope, a x (NA1.49) objective and a cooled CCD camera. CFP and FRET images were recorded using CFP excitation. Images were processed using Metamorph and image J. Pseudocolors corresponds to FRET/CFP ratio in the (Control) or (+Tat) range. Although FRET leads to a decrease in CFP emission by 1-15% 2, the CFP image can be used to evaluate concentration while the ratio image corresponds to activation sites. In control cells, massive recruitment and activation are observed at the cup (arrow head). In Tat-treated cells recruitment at the cup is strongly inhibited and no activation takes place at this level (arrow head). Bar, 1 µm. Corresponding movies are shown as Supplemental movies 1 and 2. 11
12 Supplementary Figure 9 -Tat PH-Akt Merged +Tat Supplementary Figure 9. Tat does not affect PI(3,4,5)P 3-mediated recruitment of proteins at the cup. RAW macrophages were transfected with a vector encoding PH Akt-EGFP 1 and an empty vector or a Tat-encoding plasmid as indicated. After 18 h, IgG-opsonized SRBCs were added for 3 min before fixation, permeabilization, staining with phalloidin and viewing under a confocal microscope. Representative optical sections are shown. The arrows point to the phagocytic cups. Bar, 1 µm. 12


13 ML-141 Tat-W11Y Tat-WT Control Supplementary Figure 1 Supplementary Figure 1. Tat perturbs pseudopod elongation during zymosan phagocytosis. Human MDMs were treated with 2 nm Tat (or Tat-W11Y) for 5 h before adding zymosan for 3 min, fixation and processing for SEM. Arrows point to phagocytic cups. Bars, 5 µm. 13


14 Supplementary Figure 11 Activated cdc42 Control Tat WT Tat-W11Y Total cdc Supplementary Figure 11. Scans of Western blots from the GTPase activation assays. Boxes highlight the bands shown in Figure 6c. 14
15 Supplementary references 1. Rayne F, et al. Phosphatidylinositol-(4,5)-bisphosphate enables efficient secretion of HIV-1 Tat by infected T-cells. EMBO J 29, (21). 2. Itoh RE, Kurokawa K, Ohba Y, Yoshizaki H, Mochizuki N, Matsuda M. Activation of rac and cdc42 video imaged by fluorescent resonance energy transfer-based single-molecule probes in the membrane of living cells. Molecular and cellular biology 22, (2). 15