Principles of Multicolor Panel Design BD. BD, the BD Logo and all other trademarks are property of Becton, Dickinson and Company.
|
|
|
- Meghan McKinney
- 5 years ago
- Views:
Transcription

1 1 Principles of Multicolor Panel Design
 Protein phosphorylation (BD Phosflow) Leukemia and lymphoma phenotyping Stem cell")
2 2 Common Multicolor Applications Intracellular cytokine staining Regulatory T cells (Tregs) Protein phosphorylation (BD Phosflow) Leukemia and lymphoma phenotyping Stem cell research

3 3 Increasing complexity
4 4 Challenges of Multicolor Applications Loss of sensitivity due to spillover Cytometer optimization and experimental design are critical Complexity of analysis
5 5 Elements of Multicolor Flow Cytometry

6 6 Elements of Multicolor Flow Cytometry

7 7 Stain index

8 8 Fluorochromes reveal biology Bright dyes are important when looking at dim antigens. Proper choice of fluorochrome helps us understand more about the biology of the experiment.
9 9 Evolution of fluorochromes 327 CD markers Intracellular proteins Cytokines Cell signaling Transcription factors Phosphoproteins The availability of fluorochromes has driven major advances in flow cytometry

10 1 0 Sirigen technology: high-sensitivity fluorescence Bright fluorescent materials Large collective optical response Efficient energy donors Amplified dye emission Reproducible synthetic framework


11 1 1 BD Horizon Brilliant Violet dyes Seven dyes excited by the violet laser Base polymers: BV421, BV480, BV510 Tandems: BV605, BV650, BV711 and BV786 Bright dyes Limited cross laser excitation Compatible with surface and intracellular targets

12 1 2 CD4 resolution comparison


13 1 3 BD Horizon Brilliant Ultraviolet dyes Six fluorochromes excited by the 355um UV laser Base polymer: BUV395 Tandems: BUV496, BUV563, BUV661, BUV737, BUV805 Designed for reduced spillover into violet channels Bring phenotyping to the UV laser line

14 1 4 CD4 resolution comparison

15 1 5 BD Horizon Brilliant Blue515 BB515 FITC Blue laser (488 nm) excitation Replacement for FITC and Alexa Fluor 488 Much brighter alternative to FITC with less spillover into the PE detector FITC Alexa Fluor 488 BB515

16 1 6 BD Horizon APC-R700 Red laser (640 nm) excitation Replacement for Alexa Fluor 700 Much brighter alternative to Alexa Fluor 700 Alexa Fluor 700 APC-R700

17 1 7 Fluorochrome Resolution Ranking
18 1 8 Fixation and permeabilization buffers Cat.No. Description BD Cytofix/Cytoperm Fixation/Permeabilization Kit BD Pharmingen Transcription Factor Buffer Set BD Phosflow Perm Buffer III


19 1 9 Considerations for Intracellular Panels The fixation and permeabilization process needed for intracellular staining can decrease dye fluorescence intensity.
.")
20 2 0 Impact of Fixation on Fluorescence Intensity Cells were stained with CD4 conjugates of different fluorochromes and then fixed The fluorescence intensity (MFI) of the CD4 + cells of the fixed sample was compared to unfixed (control). When considering relative fluorochrome ranking you need to take into account the loss of brightness due to fixation and permeabilization.
21 2 1 Viability staining improves results Dye Unfixed cells Fixed cells Detector Laser DAPI X BV421 UV/Violet Via-Probe Green X FITC Blue PI X PE Blue/YG 7-AAD X PerCP-Cy 5.5 Blue/YG DRAQ7 X APC Red Via-Probe Red X APC FVS450 BV421 Violet FVS510 BV510 Violet FVS575V BV605 Violet FVS520 FITC Blue FVS570 PE Blue/YG FVS620 PE-CF594 Blue/YG FVS660 APC Red FVS700 AF700 Red FVS780 APC-H7 Red
 Broad excitation and emission Incompatible with intracellular")

22 2 2 Assessing cellular viability DNA intercalation dyes (eg, PI, 7-AAD, DAPI) Broad excitation and emission Incompatible with intracellular protocols Simple staining procedure Amine-reactive dyes Discrete excitation and emission Compatible with intracellular protocols Additional step in staining procedure

23 2 3 Fixable viability stain and apoptosis
24 2 4 Viability product list Description Cat. No. Laser BD Pharmingen 7-AAD Blue BD Pharmingen Propidium Iodide Staining Solution Blue BD Horizon Fixable Viability Stain Violet BD Horizon Fixable Viability Stain Violet BD Horizon Fixable Viability Stain Blue BD Horizon Fixable Viability Stain Y-G/Blue BD Horizon Fixable Viability Stain 575V Violet BD Horizon Fixable Viability Stain Y-G/Blue BD Horizon Fixable Viability Stain Red BD Horizon Fixable Viability Stain Red BD Horizon Fixable Viability Stain Red
25 2 5 Compensation


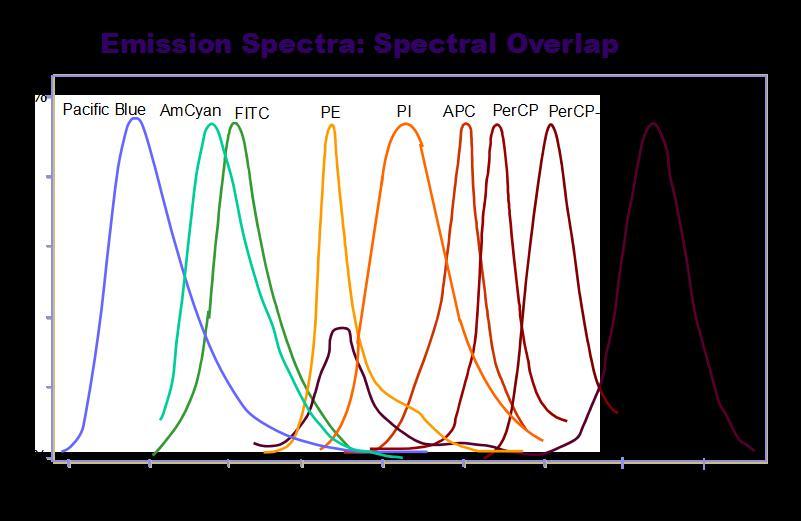
26 Fluorochromes with similar emission spectra will have the greatest potential for cross-laser spillovers. Residual spillover between tandems and their base. Spillover into adjacent detectors.


27 2 7 Increased Spread of Positive Populations in Other Detectors Spread - A better metric for panel design
28 2 8 Elements of Multicolor Flow Cytometry


29 2 9 Classification of antigens Leucocyte antigens can be categorized based upon their patterns of expression: Primary: Well characterized, easily classified as positive or negative, typically define broad subsets or lineages Examples: CD3, CD4, CD19 Secondary: Well characterized, typically expressed at a higher density, often over a continuum Examples: CD27, CD28, CD45RA, CD45RO Tertiary: Expressed at low levels, variable upon activation unknown, critical Examples: CD25, STAT5, FoxP3


30 3 0 Grouping antigen density: T-cells Pair brightest fluorochromes on specificities with the lowest antigen densities. Antigen density must be considered at the sub-population level. Antigen density changes due to activation states must be considered. This rule may be modified due to spillover, co-expression etc.
31 3 1 Antigen Density T cell panel B cell panel Expression of a given antigen can vary based upon the cell type.
32 3 2 Antigen density project Antigen density analyses were performed on blood cells from 12 individuals, covering a range of ages and genders (3 male/3 female each from young/old groups). Each antigen of interest was measured using a PE-conjugated antibody. Antibodies in panel Cell populations identified Panel 1 (B/T) CD3, CD4, CD8, CD25, CD127, CD45RA, CCR7, CD19, IgD, CD27 Naïve, EM, CM and TEMRA populations (defined by CD45RA and CCR7) from CD8 and Th cell subsets CD45RA + Tregs CD45RA Tregs Naïve B cells Non-class-switched memory B cells Class-switched memory B cells Panel 2 (non B/T) CD61, CD45, CD3, CD19, CD14, CD16, CD56, HLA-DR CD123, CD11c Platelets Neutrophils Basophils Eosinophils Monocytes (subsets based on CD14 and CD16) CD56 dim CD16 + NK cells CD56 bright NK cells NKT cells (CD3 + CD56 + ) mdcs pdcs


33 3 3 B/T panel Fluorochrome BD Horizon V450 BD Horizon V500 FITC PerCP-Cy 5.5 PE PE-Cy 5 PE-Cy 7 Alexa Fluor 647 Alexa Fluor 700 APC-H7 Marker CD45RA CD3 CD4 + IgD CD19 Drop-in CD25 CD127 CCR7 CD27 CD8

34 3 4 Antigen density: Determination on subsets (B/T)
. Provide information on antigen expression in common lymphocyte cell subpopulations.")
35 3 5 Summary: antigen density study ~400 cell surface markers analyzed Complement the information provided by the BD Biosciences Human CD Marker Chart (additional specificities from other vendors to increase specificities to >350). Provide information on antigen expression in common lymphocyte cell subpopulations. Enable optimal panel design by guiding the selection of antigen-fluorochrome combinations.


36 3 6 BD Quantibrite Kit for antigen enumeration Gate four populations # PE Molecules Median Fluorescence ,359 10,367 23,843 44,342 62, ,857 Determine relationship of # PE molecules to MFI Use MFI of stained sample to calculate Ag density

37 3 7 List of antigen density
38 3 8 Antigen/Fluorochrome combinations

39 3 9 Antibodies portfolio map

40 4 0 BD OptiBuild reagent coverage: BD Horizon Brilliant dyes BD OptiBuild custom reagents feature antibody-dye combinations not currently available in 50 μg vial sizes with quick turnaround. Adhere to BD Horizon principles and prevent panel redesign because reagents are unavailable. Features BD Horizon Brilliant dyes and cell surface antibodies. Will be available through all purchase channels and be identified with a material number.

41 4 1 Antibodies portfolio map
42 4 2 Optibuild products online
43 4 3 Elements of Multicolor Flow Cytometry


")
44 Cytometer Setup & Tracking System (CS&T) software (FACSDiva and FACSuite) reagents (CS&T Beads)
45 Functions of the CS&T system Defines and characterizes instrument performance factors which can impact sensitivity / population resolution The relative fluorescence detection efficiency (Qr) The relative optical background (Br) The electronic background noise in the system (SDen) Standardizes cytometer setup Application Settings Tracks cytometer performance
46 Daily Performance Check Setup PMT voltages (based on MFI target values) Area scaling Laser delay Tracking PMT voltages Background (Br) Sensitivity (Qr) Ability to resolve populations (rcv)
47 Why is Qr Important? Higher Qr more sensitivity. When other factors are held constant, sensitivity (as quantified by stain index) is proportional to. Qr Low Qr High Qr
48 4 8 Why is Br Important? Higher Br less sensitivity. When other factors are held constant, sensitivity (as quantified by stain index) is proportional to. 1 Br Low Br High Br

49 4 9 Qr and Br: A Look at Some Real Data Qr and Br characterizations are for both FITC and PerCP-Cy5.5 parameters. Plots gated on CD3 + lymphocytes. High Qr Low Br High Qr High Br Low Qr High Br

50 5 0 Why CV is important Resolution is the ability to distinguish between populations based on fluorescense. Resolution is a key factor in sensitivity. Good Resolution Poor Resolution Fluorescence Intensity A practical measure of resolution is the %rcv of a reference particle in the mid to upper end of the scale.

51 5 1 Elements of Multicolor Flow Cytometry
52 5 2 Summary: Top considerations Fluorochrome brightness Antigen density and co-expression Spread due to spillover


53 5 3 6-color Panel of Treg Experimental Goal: Identify Treg subsets Markers Used: CD3, CD4, CD8, CD25, CD127, CD45RA Assign antigen expression levels:
54 5 4 First example: No rules Use of available reagents: Minimal attention to fluorochrome brightness or antigen density 6-color panel for a 2-laser system:


55 5 5 First example: No rules 6 color panel using available reagents FITC PE PerCP-Cy5.5 PE-Cy7 APC APC-Cy7 CD127 CD4 CD3 CD8 CD45RA CD25
 incorrectly paired with bright fluorochromes (PE, PE-Cy7) Lower density antigens (CD127, CD25) incorrectly paired with dimmer fluorochromes (FITC,")
56 5 6 Review of data from first example Not following panel design rules results in: Poorly resolved CD127 dim /CD25 ++ Tregs Merged CD25 ++ and CD25 + populations High-density antigens (CD4, CD8) incorrectly paired with bright fluorochromes (PE, PE-Cy7) Lower density antigens (CD127, CD25) incorrectly paired with dimmer fluorochromes (FITC, APC-Cy7)
57 5 7 Second example: some rules Refined panel with focus on fluorochrome assignment based on expression of antigens 6-color panel for a 2-laser system:


58 5 8 Second example: some rules Antigen Expression Fluorochrome Rankings
59 5 9 Second example: some rules ANTIGEN Specificity CD25 CD127 CD45RA CD4 CD8 CD3 ASSIGNMENT Fluorochrome PE APC PE-Cy7 FITC PerCP-Cy5.5 APC-Cy7 Laser
60 6 0 Second example: some rules 6-color panel using antigen density and fluorochrome brightness information to choose reagents FITC CD3 PE CD25 PerCP-Cy5.5 CD4 PE-Cy7 CD127 APC CD45RA APC-Cy7 CD8


61 6 1 Comparison: first vs second Using a dimmer fluorochrome for CD4 did not impact resolution of CD4+ cells Using brighter fluorochromes for low density CD25 and CD127 markers improved their resolution


62 6 2 Third example: best practices Use of best practices to further optimize the panel to maximize the resolution of Treg: Antigen density and co-expression Fluorochrome brightness Spread due to spillover 6-color panel for a 2-laser system:
63 6 3 Third example: best practices The key to any final panel optimization is to focus on the critical populations of interest: the goal is to minimize loss of resolution due to spread from the fluorescence spillover of co-expressed antigens How to avoid spectral spillover When antigens are co-expressed on a cell Avoid significant spillover of a bright marker into a dim marker Spread the antigens across as many lasers as possible Fluorochromes that are excited by more than one laser cause high spillover Amcyan excited by the violet and blue lasers spills into the FITC detector PE-Cy5 excited by the blue and red lasers spills into APC detector Considerations for tandem dyes Take into consideration residual donor emission


64 6 4 Resolution impact matrix FITC PE PerCP-Cy5.5 PE-Cy7 APC APC-Cy7 CD3 CD25 CD4 CD127 CD45RA CD8 Whenever you have a number of events significantly below zero that indicates that there is spread into that detector In this panel something is introducing spread into the PE-Cy7 detector Where is it coming from? The resolution impact matrix suggests that spread from the PerCP-Cy5.5 conjugate of the highly co-expressed CD4 will result in a significant loss of resolution in the PE-Cy7 detector (CD127)


65 6 5 FMO controls FMO controls allows us to assess the effect of spillover and spread of a given fluorochrome into other detectors In this example, the absence of PerCP-Cy5.5 significantly improves CD127 PE-Cy7 resolution To improve CD127 resolution, combinations of reagents with less spillover into the CD127 detector are required

66 66 Optimizing panel design Minimize impact of PerCP-Cy5.5 spillover into the PE-Cy7 channel by assigning PerCP-Cy5.5 to CD8 Maximize Treg resolution by spreading CD25 and CD127 fluorochrome assignment across different lasers and by choosing fluorochromes with minimal spillover into each other Second Example CD3 FITC CD4 PerCP-Cy5.5 CD8 APC-H7 CD45RA APC CD127 PE-Cy7 CD25 PE Third Example CD3 FITC CD4 APC-H7 CD8 PerCP-Cy5.5 CD45RA PE-Cy7 CD127 Alexa Fluor 647 CD25 PE

67 6 7 Third example: best practices 6-color T cell panel optimizing reagent selection to minimize spread due to fluorescence spillover FITC CD3 PE CD25 PerCP-Cy5.5 CD8 PE-Cy7 CD45RA Alexa Fluor 647 CD127 APC-Cy7 CD4

68 6 8 Reviewing three examples The basic rules of panel design were not applied. Panel optimized to use bright fluorochromes for the low expressors. Resolution of CD127+ CD25+ cell improved Panel optimized to minimize loss of resolution due to spillover of coexpressed markers.
69 Questions? 69

70 Thank you! 70


71 7 1 Minimal spectral overlap panels 5-color panel on 5-laser system CD4 CD3 CD8 CD27 CD45RA BUV395 BV421 FITC PE-CF594 APC

72 7 2 5-color panel on 5-laser system
73 color panel To enumerate and characterize multiple leucocyte cell subsets in peripheral blood: T cells: CD3, CD4, CD8, CD27, CD127, CCR7 Regulatory T cells: CD4, CD25, CD127, HLA-DR B cells: CD19, IgD, CD25, CD27 NK and NT T cells : CD3, CD56, CD16, CD8 Dendritic cells: CD3, CD19, CD16, CD56, HLA-DR, CD123, CD11c Monocytes: CD14, CD16, HLA-DR