실험동물을이용한분자영상 (In Vivo Molecular Imaging)
|
|
|
- Milo Wilkerson
- 5 years ago
- Views:
Transcription


1 실험동물을이용한분자영상 (In Vivo Molecular Imaging) May Jehoon Yang


2 Contents Tissue sampling & fixation What s the molecular imaging? In vivo molecular imaging modalities MRI/MRS/fMRI In vivo molecular imaging research

 in water 4% formaldehyde = 10% formalin 8% formaldehyde = 20% formalin The most common fixative is")
3 10% NBF (neutral buffered formalin) Formaldehyde is a gas at room temperature Aqueous solutions of formaldehyde are referred to as formalin. "100%" formalin consists of a saturated solution of formaldehyde (this is about 40% by volume or 37% by mass) in water 4% formaldehyde = 10% formalin 8% formaldehyde = 20% formalin The most common fixative is 10% neutral buffered formalin (4% formaldehyde in phosphate buffered saline).


4 Pre-fixation 1. Sample thickness: 2 ~ 4 mm 2. Vol. of fixative: 15 ~ 20 times of tissue vol.


5 In Vivo Molecular Imaging


6 What is the Molecular Imaging? Molecular imaging is a new biomedical research discipline enabling the visualization, characterization, and quantification of biologic processes taking place at the cellular and molecular levels within intact living subjects including patients. The society for molecular imaging
7 Molecular Imaging MARRIAGE of Imaging Technology to Molecular/Cell Biology Non-invasive and repetitive imaging of target macromolecules (cells) and biological processes (cellular processes) in living organism The in vivo characterization and measurement of biological process at the molecular & cellular level.
8 In Medicine In Classical Method for Assessing Disease Anatomic changes and Physiologic changes that are a late manifestation of the molecular changes that truly underlie disease Using Molecular Imaging Method Focus on to probe the molecular abnormalities that are the basis of disease than to image the end effects of these molecular abnormalities
9 Translational Research: bench-to-bedside (i) Basic Scientists, Who discover new genes & their functions Who discover new materials Imaging Scientists, Who could transform these discoveries into non-invasive imaging method Clinical Scientist, Who transfer the above into patients care
10 Translational Research: bench-to-bedside (ii) Biophysics Molecular biology Radiology Biomathematics Cell biology Medicine Molecular Imaging Lab Chemistry Veterinary medicine Pharmacology Bioinformatics Computer science
11 The GOALS of the field are; To develop technologies and assays for imaging targeted macromolecules, and molecular and cellular events in living organisms To lead to better methods for studying biological processes as well as diagnostics and managing diseases The ultimate outcome of this technique should be for early diagnosis, and pre-disease state therapeutic response at the molecular level


12 The GOALS of the field are; Early diagnosis Life science medicine Gene therapy Targeted cancer drug Molecular Imaging Stem cell research Drug development Clinical pathology


13 Micro US Micro MR In Vivo Animal Imaging Modalities Micro PET-CT Micro CT Optical Imaging Micro PET
14 Commonly used 1. MR Imaging / Spectroscopy small animal imaging - at high field ( > 4.7T) human scanner field (1.5T ~ 3.0T) 2. PET Imaging 3. Optical Imaging bioluminescence imaging fluorescence imaging tomographic imaging.

15 Detection range of imaging modalities Things to be considered: 1. Spatial & temporal resolution 2. Depth 3. Sensitivity 4. Type of molecular probe 5. Perturbation of biological system

16 In Vivo Molecular Imaging Modalities Massoud TF, Gambhir SS. Genes Dev Mar 1;17(5):545-80
 MRS (magnetic resonance spectroscopy) fmri (functional")
17 Magnetic Resonance in Molecular Imaging MRI (magnetic resonance image) MRS (magnetic resonance spectroscopy) fmri (functional MRI)


18 Molecular Imaging MRI/MRS/fMRI Noninvasive No limitation of depth Repetitive (no irradiation, stable) Near-cellular resolution (25~100 micron)

,")


19 micro MR scanner for in vivo (mouse, rat), 7.0 Tesla at SBRI, SMC for monkey, cat, and rabbit, 4.7 Tesla for in vitro and small animal (mouse, rat), 11.7 Tesla at NIH
20 Magnetic Resonance Anatomic MR Gross morphology Specific target Metabolic MR Tissue functionality MRI/MRS/ fmri Functional MR Function Activity Molecular MR Target imaging Probe development

21 Gyromagnetic Ratio Nucleus Spin Quantum Number Gyromagnetic Ratio (MHz/1T) Relative Sensitivity at Constant Field Natural Abunda nce (%) 1 H 1/ C 1/ P 1/ Na 3/ F 1/ Li 3/ K 3/ ex: 1 H, 3T MHz, 1H, 11.7T 500 MHz
 is a relatively new procedure that uses MR imaging to measure the tiny")
.")
22 WHAT IS fmri? Functional magnetic resonance imaging (fmri) is a relatively new procedure that uses MR imaging to measure the tiny metabolic changes that take place in an active part of the brain (Ogawa, et al, 1990 a and b, 1992, 1993; Belliveau, et al, 1990, 1991). Functional MRI is based on the increase in blood flow to the local vasculature that accompanies neural activity in the brain. Since deoxyhemoglobin is paramagnetic, it alters the T2* weighted magnetic resonance image signal
23 Increased oxygen consumption in the somatosensory cortex of α-chloralose anesthetized rats during forepaw stimulation determined using MRS at 11.7 Tesla Neuroimage 32 (3) (2006) Jehoon Yang and Jun Shen Fig. Typical in vivo time course of proton-detected, 13C-edited spectra following intravenous infusion of [1, 6-13C2]glucose (TR/TE = 2000/22 ms, NS = 128 2, AQ = 196 ms, lb = 10, gb = 0.175). The [4-13C]glutamine signal at 2.46 ppm and the [2-13C]GABA signal at 2.30 ppm are spectrally resolved in vivo from the target [4-13C]glutamate signal at 2.35 ppm
24 In vivo magnetic resonance spectroscopy
25 MRS provide a noninvasive window into brain In vivo magnetic resonance spectroscopy (MRS) directly measures chemically specific information. It is the only noninvasive technique for measuring concentration of metabolites from the living brain. Our MRS development at 11.7 Tesla, the highest field strength at which in vivo MRS has ever been attempted, has allowed, for the fi rst time, detection of GABA turnover in vivo. In addition to the static levels of metabolites and metabolic fluxes measured by proton or 13 C MRS, our recent discovery of 13 C magn etization (saturation) transfer effect of specific enzyme reactions h as made it possible to probe the action of several enzymes in vivo, pointing to new directions in 13 C MRS technology development a nd applications.
26 In vivo evidence for reduced cortical glutamate-glutamine cycling in rats treated with the antidepressant/antipanic drug phenelzine Yang J and Shen J. Neuroscience 135: (2005) Metabolite a Group A Group B alanine ** 0.05 ± ± 0.38 aspartate 2.85 ± ± 0.30 creatine 3.39 ± ± 0.25 GABA c** 1.02 ± ± 0.26 glutamate d** ± ± 0.28 glutamine d** 5.17 ± ± 0.34 lactate 0.59 ± ± 0.24 myo-inositol 4.52 ± ± 0.33 N-acetylaspartate ± ± 0.40 phosphocreatine 5.11 ± ± 0.25 phosphorylethanola mine 2.31 ± ± 0.33 taurine 4.94 ± ± 0.17 Among 12 metabolites, Glu, Gln, GABA and Ala were the only metabolite which showed statistically significant changes. As a result, we became the first group in the world to detect turnover of the major inhibitory neurotransmitter GABA in the brain in vivo.


27
, and for monitoring arterial blood pressure")
28 The left femoral artery was cannulated for periodically sampling arterial blood to monitor blood gases (po 2, pco 2 ), ph, and glucose concentration using a blood analyzer (Bayer Rapidlab 860, East Walpole, MA), and for monitoring arterial blood pressure levels.


29 Bruker microimaging spectrometer (Bruker Biospin, Billerica, MA) interfaced to an 11.7 Tesla 89-mm bore vertical magnet (Magnex Scientific, Abingdon, UK)


30 Animal preparation monitoring of physiological condition Arterial blood po2, pco2, mean blood pressure, and ph were maintained at approximately mm Hg, mm Hg, 150±30 mm Hg, and , respectively. Heart rate, end-tidal CO2, and tidal pressure of ventilation were monitored continuously.
31 Blood glucsoe (mm/l) Mean blood pressure (mmhg) ph pco2 (mmhg) The change of arterial ph, pco 2, glucose and mean blood pressure in each group Control PHA ACZ Time (min) Control PHA ACZ Time (min) Control PHA ACZ Control PHA ACZ Time (min) Time (min)


32 In Vitro 1H/13C Spectroscopy microwave fixation system Immediately after in vivo MRS data acquisition, the metabolism of the rat brain was arrested using a microwave fixation system (Model TMW-6402C, Muromachi Kikai Co., Tokyo, Japan). The microwave device inactivates enzymatic processes in approximately one second (Tappaz et al, 1977).
33 Detection of reduced GABA synthesis following inhibition of GABA transaminase using in vivo magnetic resonance signal of [13C]GABA C1. J Neurosci Methods 182(2) 15: (2009) Jehoon Yang, Christopher J and Jun Shen
34 Fast isotopic exchange between mitochondria and cytosol in brain revealed by relayed 13 C magnetization transfer spectroscopy J Cereb Blood Flow Metab 29(4):661-9 (2009) Jehoon Yang, Su Xu and Jun Shen Fig. The relationship between the TCA cycle and V x used in brain metabolic models to describe the kinetics of 13 C label incorporation from mitochondrial TCA cycle intermediates into predominantly cytosolic glutamate and aspartate pools (adapted from Figure 43 in Siesjo (1978)). V x represents the lumped exchange between mitochondrial -ketoglutarate/oxaloacetate and cytosolic glutamate/aspartate.


35 Non-human primate experiment

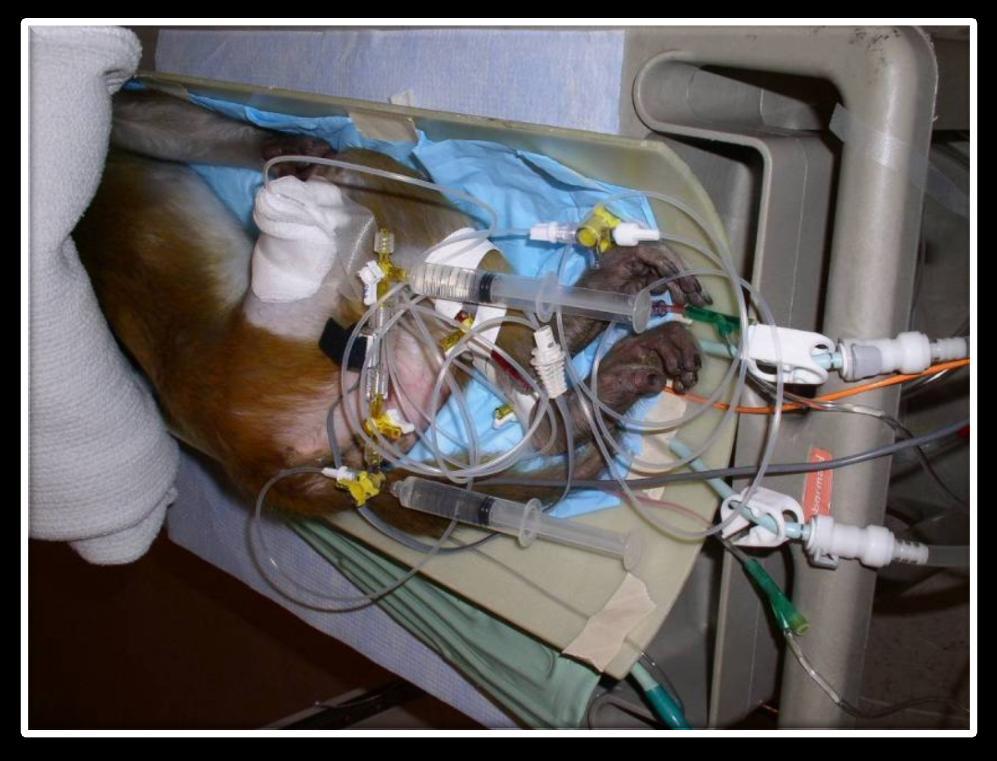
36 Surface coil and cannulation for Monkey MRS


37 All procedures were approved by the National Institute of Mental Health Animal Care and Use Committee and the physiological data should be recorded by certificated person.
![In vivo 13C magnetic resonance spectroscopy of human brain on a clinical 3 T scanner using [2-13C]glucose infusion and low-power stochastic decoupling.](/docs-images/94/119580845/images/38-2.jpg "Magnetic Resonance in Medicine 62(3): 565-73 (2009) Li S, Zhang Y, Wang S, Yang J, Ferraris Araneta M, Farris A, Johnson C, Fox S, Innis R, Shen J.")
38 In vivo 13C magnetic resonance spectroscopy of human brain on a clinical 3 T scanner using [2-13C]glucose infusion and low-power stochastic decoupling. Magnetic Resonance in Medicine 62(3): (2009) Li S, Zhang Y, Wang S, Yang J, Ferraris Araneta M, Farris A, Johnson C, Fox S, Innis R, Shen J. Time course spectra of glutamate, glutamine, and aspartate turnover detected in the occipital lobe during intravenous infusion of [2-3C]glucose.
39 Weaknesses of MRS Limited sensitivity = large voxels (nucleus dependent) = high metabolite concentration (millimolar) Limited specificity = multiple species in many resources = spectral overlap may be difficult to overcome Larger data acquisition windows =spectra are the sums of large numbers at averages =scans are expensive (several hundred dollars/hour) Special equipment may be required =software ( 1 H MRS) =hardware (RF coils, amplifiers, decouplers) Local expertise critical = automated methods variably reliable = multiple issues in data acquisition, analysis
40 Molecular imaging probe


41 Future Drug Therapeutic drug Multimodality Imaging Imaging Drug

42 HMON as an MRI contrast agent HMON (Hollow Manganese Oxide Nanoparticles) Newly developed T1 contrast agent Gd 3+ or Mn 2+ containing colloidal nanoparticles : recently reported as potent T1 MRI contrast agents A nanometer-sized colloid particle with small size, large surface area & internal void spaces Large water accessible surface areas Able to carry high payloads of MR-active magnetic centers with an ability to take up a large amount of drug molecules within the internal void space Cetuximab-conjugated HMON


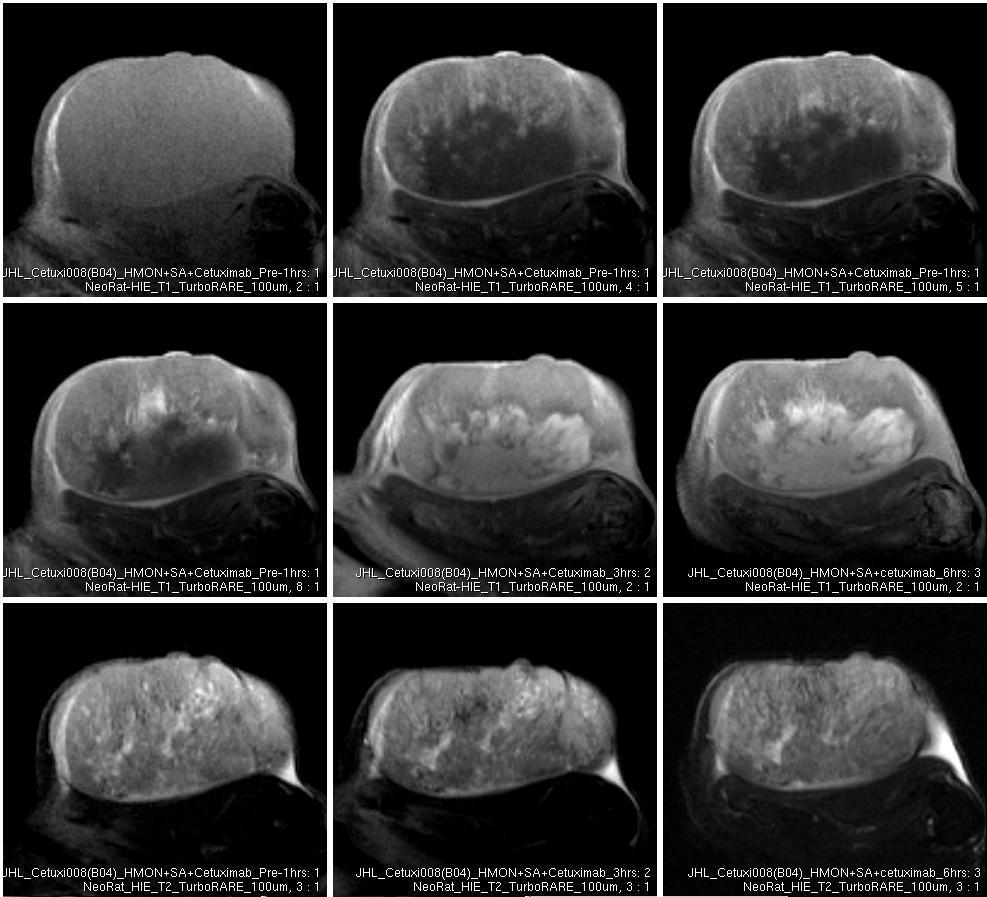
43 Immunohistochemical localization of EGFR T1-Pre T1-15min T1-30min T1-1hrs T1-3hrs T1-6hrs T2-Pre T2-3hrs T2-6hrs
 First described by Dr.")


44 Future study plan (ii) 100 Years of Research on Alzheimer s Disease Alzheimer s Disease (AD) First described by Dr. Alois Alzheimer on November 3rd, 1906 in Tübingen, Germany The most common cause of dementia among people age 65 and older Progressive, irreversible decline in memory, loss of orientation and changes in personality and behavior No disease-modifying therapeutics available to date Page 44
 Aβ42-induced Synaptic Dysfunction Neurodegeneration & Memory Impairment (Clinical AD) Plaques/Tangles Page 45")
45 Molecular Pathogenesis of AD β-secretase Production g-secretase APP Amyloid Cascade Hypothesis Clearance Aβ42 monomer Aggregation/ Deposition Fibrils Soluble Aβ42 Oligomers [dimers, trimers, Aβ*56] Tau abnormalities (e.g. PHF) Aβ42-induced Synaptic Dysfunction Neurodegeneration & Memory Impairment (Clinical AD) Plaques/Tangles Page 45
46 Detection of reduced GABA synthesis following inhibition of GABA transaminase using in vivo magnetic resonance signal of [ 13 C]GABA C1 J Neurosci Methods (2009) 182(2): , Yang J, Johnson C and Shen J Lin AP et al, 2007

47 Thank you for your attention!