Programmable and Multiparameter DNA-based Logic Platform For Cancer Recognition and Targeted Therapy
|
|
|
- Baldwin Alexander
- 5 years ago
- Views:
Transcription
1 Programmable and Multiparameter DNA-based Logic Platform For Cancer Recognition and Targeted Therapy Mingxu You,, Guizhi Zhu,, Tao Chen,, Michael J. Donovan and Weihong Tan, * Department of Chemistry and Physiology and Functional Genomics, Center for Research at the Bio/Nano Interface, Shands Cancer Center, UF Genetics Institute, University of Florida, Gainesville, FL , USA Molecular Science and Biomedicine Laboratory, State Key Laboratory of Chemo/Bio-Sensing and Chemometrics, College of Chemistry and Chemical Engineering, College of Biology, Collaborative Innovation Center for Molecular Engineering and Theranostics, Hunan University, Changsha , China Supplementary Materials: Within this supporting information are found: 1. Supplementary Tables Table S1: DNA sequences used in the 2-input theranostic studies Table S2: DNA sequences for the programmable and scalable logic devices 2. Supplementary Figures and Notes Figure S1: The specific aptamer-target and tag recognition demonstrated in the OR gate Figure S2: The optimization of cx*/cy*-f sequences for the AND gate (Note S1) Figure S3: Flow cytometry analysis of the AND gate Figure S4: Profiling the aptamer-targeting receptor amounts on four types of cancer cells Figure S5: Confocal microscopy images of the studied cell-surface logic gates Figure S6: Competition effect of tagged aptamers on the same surface receptor Figure S7: Experimental schemes of constructing 3-input cell-surface logic devices Figure S8: Optimization of assistant probe concentration for the cell-surface NOT gate (Note S2)
] represent two probes of the same sequence, w/ or w/o labeling.")
2 Figure S9: The competition effect of 4 aptamers on the same CEM surface receptor Supplementary Tables: Table S1. DNA sequences used in the 2-input theranostic studies. The colored nucleotides represent the complementary parts; the parts in parentheses [e.g., (-F)] represent two probes of the same sequence, w/ or w/o labeling. Ce6 = chlorine e6 photosensitizer-modified probe; FAM= fluorescein (FITC)-modified probe.

-modified probe.")
3 Table S2. DNA sequences used to demonstrate the programmable and scalable cell-surface logic devices. The colored nucleotides represent the respective toehold regions. The underlined nucleotides represent the attached tag parts for each aptamer. Ce6 = chlorine e6 photosensitizermodified probe; FAM= fluorescein (FITC)-modified probe. Bracketed letter-labeled strand (e.g., [c] strand) is complementary to the strand labeled with the same letter (e.g., c strand).

 CEM and (b) Ramos cell-surface fluorescence intensity, after adding different OR gate probes")
4 Supplementary Figures: Figure S1. Proof of the selective aptamer-target and nucleic acid tag recognition from flow cytometry analysis. (a) CEM and (b) Ramos cell-surface fluorescence intensity, after adding different OR gate probes and FITC-labeled cy4 reporter, was recorded by counting events using channel #3 in the flow cytometer; X tag represents the mismatched tag for cy4 reporter.

 complementary to each other, while the more stable")
5 Figure S2 and Note S1. The optimization of cx*/cy*-f sequences for the AND logic gate. (a) Different lengths of cx* and cy*-f probes were synthesized and annealed beforehand. For the cell binding study, cy* probe was fixed at the concentration of 200nM, while the concentration of the cx* probe varied: 200nM, 300nM, 400nM, 600nM or 800nM. The extra cx* probe was added to prevent a false-positive signal by free cy* probe inside the solution. To prevent the unexpected hybridization between Sgc8c-X* and Sgc4f-Y* probes, X* tag and Y* tag were designed to have only seven base pairs (7-bp) complementary to each other, while the more stable X*/cX* and Y*/cY4* duplexes each have 21-bp. (b), (c) For each cx*/cy*-f duplex structure (cx1*/cy1*, cx2*/cy1*, cx1*/cy2*, cx2*/cy2*, cx3*/cy3*, cx4*/cy3*, cx1*/cy4*, cx2*/cy4*, cx3*/cy4* and cx4*/cy4*), five different molar ratios (1:1, 1.5:1, 2:1, 3:1 and 4:1) of cx*/cy* were tested for both CEM and Ramos cells. Based on the flow cytometry analysis, the mean cellsurface fluorescence intensity was determined for three cases, i.e., when only Sgc8c-X* [1, 0], only Sgc4f-Y* [0, 1], or Sgc8c-X*+Sgc4f-Y* [1, 1] was/were attached on the CEM cell surface. The
6 same optimization was performed by using the TE02-X* and TD05-Y* probes for the Ramos cells. By comparing the signal-to-background (S/B) ratios and the gating properties for each test, the cx2*/cy2*-f (2:1 concentration ratio) and cx4*/cy4*-f (1.5:1 concentration ratio) complexes were finally chosen, respectively, for the further CEM and Ramos cell AND gate study. In these two duplexes, each cy* has a two-base overhang at the 3 -end to assure the binding strength after Y* recognition and, at the same time, prevent direct strand displacement in the absence of X* probe (false-positive signal). Figure S3. Flow cytometry analysis of the AND gate. (a, b) For CEM cells, both Sgc8c-X* and Sgc4f-Y* probes should be attached on the cell surface to activate the AND gate; (c, d) for Ramos cells, both TE02-X* and TD05-Y* probes are required. Fluorescence values and their error bars (mean ± s.d.) are calculated based on the FITC signal using channel #3 in the flow cytometer, from three experiments.
7 Figure S4. Flow cytometry analysis of the individual aptamer-targeting receptor profile on the surfaces of (a) K562 cells, (b) HeLa cells, (c) CEM cells and (d) Ramos cells. After biotin-labeled individual aptamer was attached on the cell surface, avidin-tagged PE-Cy5.5 dye was added (free PE-Cy5.5 dye was removed after 15min incubation) to provide the fluorescence signal, using channel #5 in the flow cytometer for detection.

8
 and fluorescence image (right) are shown after adding gating probes for (a) Ramos, (b) CEM, (c) K562 and (d) HeLa cells.")
9 Figure S5. Fluorescence confocal microscopy images of the studied cell-surface logic devices. The optical image (left) and fluorescence image (right) are shown after adding gating probes for (a) Ramos, (b) CEM, (c) K562 and (d) HeLa cells. The fluorescence signal comes from TAMRA dyemodified DNA reporter probes, and the images were taken by an Olympus FV500-IX81 confocal microscope (Olympus America, Melville, NY).
10 Figure S6. Flow cytometry analysis of the competition of different tagged aptamers, including Sgc4f, Sgc8c and TE17, on the CEM cell-surface receptors. After biotin-labeled individual aptamers and an equal amount of nonlabeled competition aptamers (200nM) were attached on the cell surface, avidin-tagged PE-Cy5.5 dye was added (free PE-Cy5.5 dye was removed after 15min incubation) to provide the fluorescence signal, using channel #5 in the flow cytometer for detection.
11
12
13

14

15

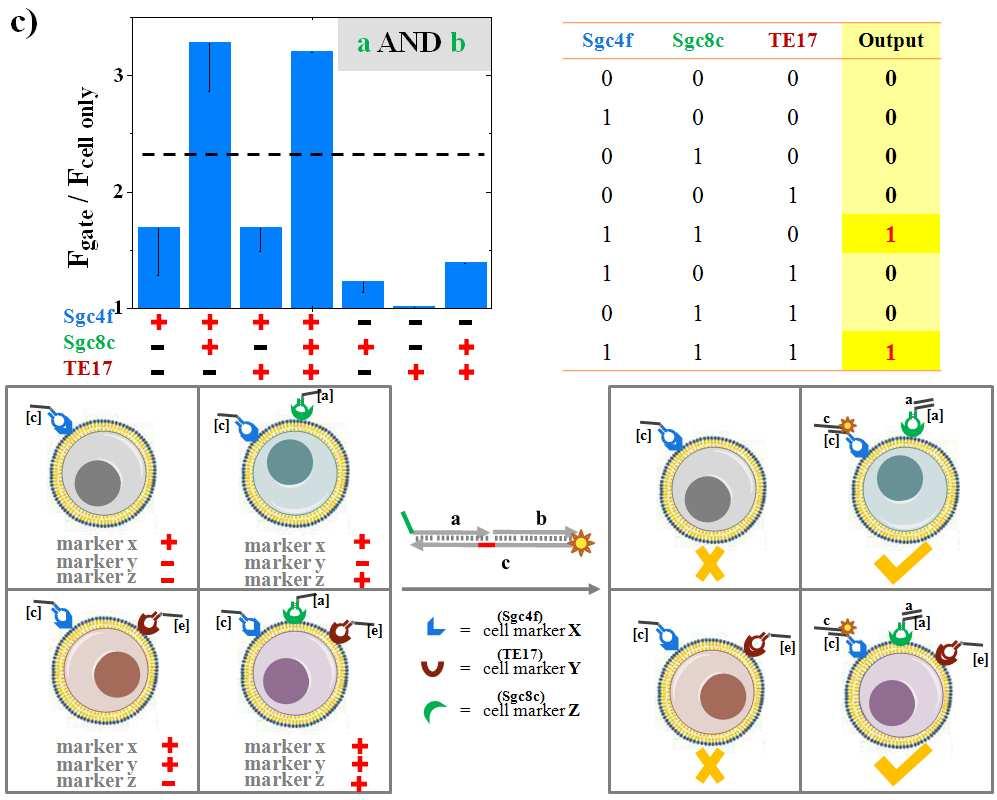
16 Figure S7. The symbols, truth tables and experimental schemes provide the supporting framework for the construction of twelve 3-input cell-surface logic sensors to demonstrate the programmability and scalability of the approach. Rationally designed tagged-sgc4f/sgc8c/te17 aptamer pairs and CEM cells were employed as the examples. Bracketed letterlabeled strand (e.g., [c] strand) is complementary to the strand labeled with the same letter (e.g., c strand). The fluorescence intensity results were based on averaged flow cytometry distributions, from three experiments.
.")
17 Figure S8 and Note S2. The optimization of assistant probe concentration for cell-surface NOT sensor. The efficiency of Sgc4f/Sgc8c/TE17 -based 3-input logic gates was determined after adding 200nM a*/b/c-bio nanostructure and various amounts of assistant [a] probes (from 0 to 150nM, respectively). As shown in the figure, [a] probe could facilitate the opening of the nanostructure, resulting in the enhancement of cell-surface fluorescence intensities. The fluorescence intensities were based on averaged flow cytometry distributions, from three experiments. The assistant probe is used for realizing toehold-based strand displacement and uncovering the real reporter strand from the duplex structure. The concentration of useful assistant probe, e.g., [a*] or [d] strand in this study, is dependent on the amount of the NOT gate aptamer on the cell membrane (more on the normal cells, but much less on cancer cells). These assistant probes will preferentially bind to fully complementary free a* (or d) tag in the cell-surface aptamer strand, instead of the reporting DNA nanostructure (a*/b/c-bio), which involves a competition effect from b/c strands. Theoretically, NOR [output is 1 only if both inputs are false (0, 0)] and NAND [output is 0 only if both inputs are true (1, 1)] gates are unique, since they are functionally complete, i.e., any computational machines could be built by scaling up either of these two gates only. The realization of AND and NOT gates provides the basis for building up these two types of important logic gates, as demonstrated in the design shown in scheme (e) and (f) in Fig. S7. For the 3-input cell-surface logic gate, if provided an output of either 0 or 1 for each possible cell status, there will be 2 8 = 256 kinds of possible logic gates (8 come from the possible status of 3 inputs, i.e., 2 3 = 8). Theoretically, the toehold-based strand displacement strategy demonstrated in this cell-surface study could realize 2 7 = 128 possible logic gates since this strategy requires at least one aptamer
18 binding on the cell membrane to transmit the signal; as a result, the cell surface condition of receptor a / receptor b / receptor c will always be reported as 0, instead of 1. Figure S9. Flow cytometry analysis of the competition of different tagged aptamers, including Sgc4f, Sgc8c, TE17 and TC01, on the CEM cell-surface receptors. After biotin-labeled individual aptamer and equal amount of nonlabeled competition aptamers (200nM) were attached on the cell surface, avidin-tagged PE-Cy5.5 dye was added (free PE-Cy5.5 dye was removed after 15min incubation) to provide the fluorescence signal, using channel #5 in the flow cytometer for detection. These experiments demonstrate that the four aptamers employed in these 4-input logic gate studies, Sgc4f, Sgc8c, TE17 and TC01, bind with different cell-surface receptors.