Transcriptome atlases of the craniofacial sutures Harm van Bakel Icahn School of Medicine at Mount Sinai
|
|
|
- Kristina Cox
- 5 years ago
- Views:
Transcription

1 Transcriptome atlases of the craniofacial sutures Harm van Bakel Icahn School of Medicine at Mount Sinai NIH/NIDCR 1 U01 DE024448


2 Differential gene expression & suture development Coronal Suture 1 Twist1 +/- Saethre-Chotzen Syndrome Fgfr2 +/S252W Apert syndrome Mouse Human Mouse Human 9 months P0 P P F F El Ghouzzi et al, 1997 Mathijssen et al, 1996 Johnson et al, 2000 Holmes et al, 2009 Comprehensive suture gene expression profiles are unknown


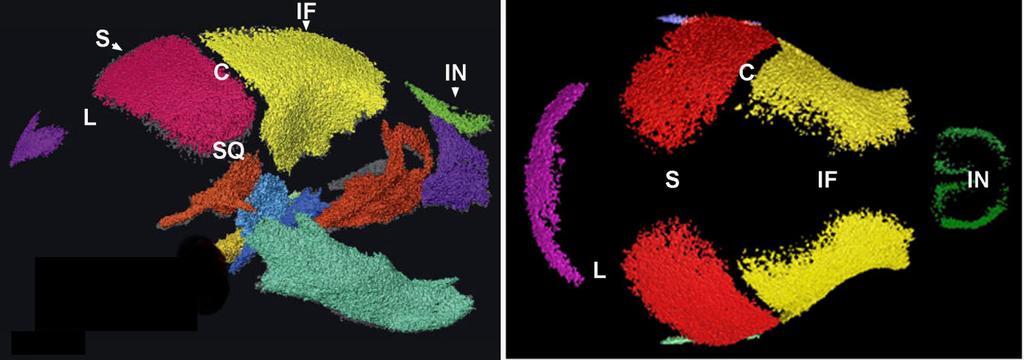
3 Laser Capture Microdissection of Suture Regions Interfrontal Suture


4 Eleven craniofacial sutures for Atlases Chris Percival
5 Data generation for each suture Suture LCM Mesenchyme Osteogenic fronts 5 replicates RNA extraction 1-10 ng, RIN 7-8 SPI amplification rrnas suppressed Total RNA-Seq - Illumina HiSeq - rrna depleted - Paired-end 100 nt reads - Depth: ~40M read pairs

6 Planned wild-type mouse suture profiles 285 WT profiles

7 Planned Fgfr2 +/S252W and Twist1 +/- suture profiles 350 mutant profiles 635 total
8 RNA-Seq Data Analysis & QC pipeline Raw reads assessment of base-level qualities Adapter and quality filtering Map filtered reads to mouse genome (mm10) Mapped read bam files and genome browser tracks Quality control of mapped reads Global stats: % mapped reads, % unique reads, duplicated reads, intronic and exonic read mapping rates, library diversity, etc. Generate gene, transcript and exon-level read counts per sample Data is made available through


9 Total RNA-Seq Mapping statistics Origin Fraction mapped Genes x1000 Mapping statistics Mapping rate ~80% rrna contamination < 10%
10 Genome browser example Ibsp expression profiles E18.5 FR E18.5 PA Interfrontal Coronal E16.5 FR E16.5 PA E18.5 SM E16.5 SM E18.5 FR E16.5 FR E18.5 SM E16.5 SM Splice junctions RefSeq

11 Expression differences in Interfrontal suture regions 624 genes >> expression in suture mesenchyme 684 genes >> expression in osteogenic front
12 Interfrontal suture gene ontology analysis

13 Developmental time differences E16.5 vs. E18.5


14 Combined analysis: Interfrontal & Coronal Sutures Region Stage Genotype Suture


15 Multiscale embedded co-expression network analysis Network construction v Screening: pairs with FDR < 0.05 v Parallelization of network construction Reduce false- posi0ves, improve 0me complexity. Multi-scale cluster detection Downstream analyses v Unsupervised hierarchical divisive approach to identify multiscale organization Iden0fica0on of modular structures. v Identification of: - Significant modules, - Significant hubs, - Identify suture development modules - Association with suture phenotypes poten0al drivers/mechanisms of disease e0ology
16 Global network: Interfrontal Suture 16


17 Global network: Interfrontal Suture
18 Interfrontal Suture Osteogenic front vs. Mesenchyme Up in osteogenic front Up in mesenchyme Module genes
19 Top 10 enriched biological processes (Module 18) Name Term gene Overlap FE Pvalue Padjust collagen fibril organization E ossification E biomineral tissue development E regulation of ossification E-05 1 response to yeast inorganic diphosphate transport extracellular matrix organization extracellular structure organization organ development protein trimerization
20 Coronal Suture Osteogenic front vs. Mesenchyme Up in osteogenic front Up in mesenchyme Module genes
21 Coronal Suture Osteogenic front vs. Mesenchyme Up in osteogenic front Up in mesenchyme Module genes
22 Top 10 enriched biological processes (Module 168) Name Term genes Overlap FE Pvalue Padjust pattern specification process E E-05 organ morphogenesis E E-05 organ development E skeletal system development E ossification E tissue development E system development E appendage morphogenesis E limb morphogenesis E skeletal system morphogenesis E
 Up at E16.5 Up at E18.")
23 Interfrontal Suture Development network (E16.5 vs E18.5) Up at E16.5 Up at E18.5 Module genes
24 Top 10 enriched biological processes (Module 6) Name Term genes Overlap FE Pvalue Padjust single-multicellular organism process E E-06 anatomical structure morphogenesis E E-06 multicellular organismal process E E-06 multicellular organismal development E E-06 system development E E-06 locomotion E E-05 regulation of multicellular organismal process E E-05 single-organism developmental process E E-05 organ morphogenesis E E-05 tissue development E E-05
25 Conclusions Analysis of datasets for Interfrontal and Coronal sutures at E16.5 and E18.5 for wild-type and Twist1 +/- mutant mice High-quality LCM RNA-Seq captures known and novel aspects of suture biology Embedded co-expression network analysis has enabled us to construct regulatory networks and identify candidate regulatory hubs Additional suture datasets will allow further refinement of network modules

26 Acknowledgements Icahn School of Medicine at Mount Sinai Greg Holmes Harm van Bakel Michael Donovan Ethylin Wang Jabs Bin Zhang Cincinnati Children s Medical Center Steven Potter NIH/NIDCR 1 U01 DE024448