RAD51 in Tetrahymena thermophila Allison Dwyre and Jenna Culver Fall 2011
|
|
|
- Alannah Burke
- 5 years ago
- Views:
Transcription
1 Abstract RAD51 in Tetrahymena thermophila Allison Dwyre and Jenna Culver Fall 2011 From other experiments on RAD51 it can be deduced that the gene, in most mammals, is responsible for the repair of broken DNA. The importance of RAD51 is most obvious when the gene is missing. When the RAD51 is not expressed it leaves the cells open to chromosome breaks or abnormalities, mutagenesis and cell death. 1 An experiment done on mice relating to the absence of RAD51 resulted in embryonic lethality. 2 In this experiment we are attempting to isolate and replicate a gene homolog of RAD51 in Tetrahymena thermophila. In this experiment, after finding a good homolog in Tetrahymena, we will do various things with it like isolation, PCR, cloning, placing it in a plasmid vector, cutting the gene out with restriction enzymes to confirm its identity, and cryopreservation of the successful plasmid. This will allow others to use our isolated RAD51 homolog to determine its function in Tetrahymena as well as in humans. With this stated, the information gathered in this experiment will help in other experiments to better our understanding of all of the functions of RAD51. Introduction In previous research on RAD51, this gene has been found to play a role in homologous recombination repair of double-stranded DNA breaks that can make genes unstable or cause cancer. 1 DNA breaks occur from environmental factors like UV radiation, tobacco smoke, and oxidative damage from things like free radicals. Another cause of these breaks is from DNA replication during cell division. In replication, DNA polymerase adds incorrect nucleotides faster than enzymes can repair them, creating unstable strands of DNA that eventually break. 4 What
2 RAD51 does in homologous recombination repair is it binds to the DNA at the site of a break and encases it in a protein sheath. It then finds a homologous chromosome to use as a template for repairing the breaks in the DNA. This is an essential first step in the repair process. 2 Surprisingly, in cancers no mutations have been found in RAD51, but instead its expression is higher in cancer cells. This is believed to occur because it is being used to allow the cells to divide rapidly by repairing breaks in DNA. 3 Most studies are currently focusing on the gene s link to breast cancer because RAD51 commonly interacts with breast cancer causing genes (BRCA1 BRCA2). Recent studies of the three genes have shown that a variation in RAD51 can actually modify the risk of carriers of a BRCA1/BRCA2 mutation5 The Tetrahymena is a eukaryotic cell that has two nuclei; the macronucleus, which has somatic genes and divides amitotically, and the micronucleus, which has germline genes and divides mitotically. Using a Tetrahymena gene as a homolog of RAD51 will allow more insight for the exact functions of RAD51. In this experiment we will first find a suitable homolog. Then, we will isolate the genomic DNA from Tetrahymena. The isolated DNA will then be amplified with a PCR reaction and ran in an electrophoresis gel. The DNA will be cloned into a plasmid and then a plasmid map will be created with restriction enzymes represented. A few of these enzymes represented on this map will be taken and used on the plasmid to isolate the gene from it. The gene isolated will then be confirmed as RAD51 with the use of agarose gel electrophoresis. Lastly, figures will be made of the results and the confirmed sample will be cryopreserved for later experiments.
3 Methods Bioinformatics The amino acid sequence of RAD51 in Homo sapiens was found using the protein database at A Tetrahymena homologue of the gene RAD51 was then found using the Tetrahymena Genome Database Wiki Also on the TGD Wiki page a protein sequence, nucleotide sequence, and EST s of the Tetrahymena homolog were obtained. The Tetrahymena homolog coding sequence was then compared with the genomic sequence using the alignment program on the MGAlignIt homepage ( The protein sequences of the homologs were compared with the NCBI Specialized BLAST at Complete protocol can be found in the BMS110 Lab Protocols: Lab 3 Bioinformatics: Molecular Computational Tools. 6 Genomic DNA Isolation 1.4mL of the Tetrahymena culture was put into a microcentrifuge tube and centrifuged for 1 minute at 10,000 rpm. The supernatant was decanted and 700µL of Urea Lysis buffer was added. Next the lysate was Phenol-extracted\ by using 600µL of phenol:chloroform:isoamyl alcohol mixture. The mixture was centrifuged for 5 minutes at maximum speed. The supernatant of this was moved to a fresh microcentrifuge. The phenol extraction was done again. To reduce the carbohydrate content of the final precipitate 150µL of 5M NaCl was added to the extracted lysate. The DNA was then precipitated by adding isopropyl alcohol and letting stand at room temperature for 10 minutes. The precipitate was collected by centrifuging the mixture at a maximum speed for 10 minutes. The supernatant was decanted and 500µL of 70% ethanol was added to the precipitate. This mixture was again centrifuged, at maximum speed for 3 minutes,
4 and the supernatant was also decanted. After the pellet was air dried, it was resuspended in 50µL of Tris-EDTA (TE) buffer, combined with 1µL of RNase A, and incubated at 37 C for 15 minutes. Complete protocol can be found in the BMS110 Lab Protocols: Lab 4 Genomic DNA Isolation & Quantification of genomic DNA. 6 Quantification of genomic DNA A Nanodrop was used in the quantification of 1µl of our sample of genomic DNA. Using the A 260 reading we were able to calculate the concentration of the original genomic DNA solution, and the A 260 /A 280. Complete protocol can be found in the BMS110 Lab Protocols: Lab 4 Genomic DNA Isolation & Quantification of genomic DNA. 6 Polymerase Chain Reaction (PCR) First, Gene-TF(GCTGAGTACGCTGAAGACGTTG)and Gene-TR(GTATTGAAGACTTCAA CGAGTGA) were diluted with 158.5µL and 223µL of sterile water respectively, to create the primer stock solutions. To set up the PCR reactions 2 different master mixes were made (3X reaction mix), each with either gdna or cdna. Each master mix had, 1.5µL of 10 μm Forward primer (TF), 1.5µL of 10μM Reverse primer (TR), 1.5µL of 2 U/μL Phusion polymerase, 30µL of 5X GC buffer (1.5mM MgCl2), 30µL of 5.0 M Betaine, 3.0µL 10 mm dntps, 79.5µL sterile distilled water. One master mix had 3.0µL of 1.0µg/µL gdna, the other had 3.0µL of cdna. *Note: cdna master mix was diluted with 26.5μL of H2O instead of 79.5µL and then had 53µL H2O added after being split up then put all back into one container. Each master mix was divided into 3 equal parts, each 50µL. the separate PCR reactions were placed in an incubator at different primer annealing temperatures. gdna 1 at 53.5 C, gdna 2 at 55.5 C, gdna 3 at 57.5 C, cdna 1 at 53.5 C, cdna 2 at 55.5 C, and cdna 3 at 57.5 C.
5 Complete protocol can be found in the BMS110 Lab Protocols: Lab 5 Polymerase Chain Reaction. 6 Agarose Gel Electrophoresis An agarose gel was prepared using 70mL of a 1% agarose gel, 70mL of 1X TAE, 0.7µL of 10 mg/ml Ethidium Bromide and the electrophoresis chamber was filled with 1X TAE. In the first lane 20µL of the kb ladder was added. 10µL of each sample of PCR reacted DNA was mixed with 1µL of 10X sample dye on a piece of Parafilm and loaded into the lanes next to the 1 kb ladder. The agarose gel electrophoresis was then run at constant volts ( volts). This was run until the bromophenol blue band was half way down the gel. The UV light box and camera was used to take a picture of the gel. Complete protocol can be found in the BMS110 Lab Protocols: Lab 6 Agarose Gel Electrophoresis. 6 Cloning To set up the TOPO cloning reactions 1.5 L (5-10 ng total) *PCR product, 1µL salt solution, 2.5µL sterile water, and 1µL TOPO vector were combined. Complete protocol can be found in the BMS110 Lab Protocols: Lab 7 TOPO Cloning & E. coli Transformation. 6 *note: the PCR reaction was done again with gdna and a different cdna at a new temperature E. coli Transformation First, the E. coli was thawed on ice for about 5 minutes. Then, 2µL of the TOPO cloning reaction place into a vial of chemically competent E. coli and mixed gently. This mixture was incubated on ice for 30 minutes and then heat-shocked for 30 seconds at 42 C in a water bath, immediately returning the tubes to ice for 1-2 minutes. Next, 250µL of room temperature SOC Medium was added to the mixture and placed in a shaking incubator at 37 C for 1 hour. 200µL of the new mixture was spread on an LB plate containing 50µg/mL kanamycin with glass beads,
6 the remaining 50µL of the mixture was spread on a second plate. Both plates were incubated overnight in an incubator at 37ºC. The plates were taken out of the incubator the next day and place in the cold room. After the plates grew, 6 colonies were taken from the 50µL plate and placed on a third plate to let grow (these colonies will be used later in Lab 10). Complete protocol can be found in the BMS110 Lab Protocols: Lab 7 TOPO Cloning & E. coli Transformation. 6 Construction of Plasmid Map Using the program Gene Construction Kit we were able to create a map of the plasmid that was created. In a pre-made template the gene sequence of RAD51 in Tetrahymena was inserted over the CACC sequence. Next, the introns were marked. Complete protocol can be found in the BMS110 Lab Protocols: Lab 8 Plasmid Map Construction & Restriction Enzyme Digest Design. 6 Restriction Enzyme Design On the same program, enzymes were added to the plasmid map. These enzymes were as follows: Avr II, Bam HI, Bgl II, EcoR I, EcoR V, Hind III, Kpn I, Nco I, Nde I, Nhe I, Not I, Nru I, Nsi I, Pst I, Pvu I, Pvu II, Sac I, Sal I, Spe I, Sph I, Xba I, Xho I. With the enzymes visible on the map, restriction enzymes that will allow us to confirm that RAD51 is in the plasmid, were then chosen. The chosen enzymes (XhoI/Avr II and Pst I/ EcoRI)* were placed on a virtual gel. Complete protocol can be found in the BMS110 Lab Protocols: Lab 8 Plasmid Map Construction & Restriction Enzyme Digest Design. 6 *note: Pst I was changed to EcoRI in the next lab due to a limited amount of Pst I. Plasmid Purification
7 The six colonies taken from Lab 7 (cloning and transformation) were inoculated in 2mL cultures of LB liquid media tubes and placed in a 37 C in a shaking incubator. After allowing the cultures to grow, 1.5 ml of each culture were placed into microcentrifuge tubes and centrifuged at maximum speed for 2 minutes. After decanting the supernatant we added 350 µl of sucrose lysis buffer and resuspended the pellet. 25 µl of lysozyme solution was then added and the mixture was incubated at room temperature for 5 minutes. Next, the mixture was heat shocked at 99 C for 1 minute. The heat shocked mixture was centrifuged for 15 minutes at maximum speed and the pellet was removed from the supernatant. Then, the DNA was precipitated by adding 40µl of 3M NaOAc and 220 µl of isopropanol and incubating at room temperature for five minutes. The precipitate was isolated by centrifuging the solution for 10 minutes at maximum speed and decanting the supernatant. The DNA pellet was washed by 1000 µl of 70% ethanol and centrifuging for 2 minutes at maximum speed (decanting the supernatant). After drying the pellet we resuspended it in 50 µl of Tris-EDTA(TE) buffer making sure to let it rehydrated by sitting for 3 minutes. Complete protocol can be found in the BMS110 Lab Protocols: Lab 10 Plasmid Purification & Restriction Enzyme Digest. 6 Confirmation of Plasmid by Restriction Enzyme Digestion Two different cocktail solutions were made for each digest chosen from lab 8. The first solution contained 14 µl 10x NE Buffer 2, 3.5 µl XhoI, 6.5 µl AvrII, 1.4 µl 100x BSA, and 96.6 µl of sterile water. The second solution contained 14 µl 10x NE Buffer 2, 3.5 µl EcoRI, 6.5 µl EcoRV, 1.4 µl 100x BSA, and 96.6 µl of sterile water. Each solution was split up into 7 separate tubes containing 17 µl of the cocktail solution and 3 µl of each plasmid into its own tubes. These mixtures were incubated at 37 C for at least an hour. When samples are finished incubating 10x sample dye was added to each sample and they were run on a gel (refer to Lab 6 protocol for
8 procedure). Complete protocol can be found in the BMS110 Lab Protocols: Lab 10 Plasmid Purification & Restriction Enzyme Digest. 6 Preparing Data of Publication To make figures of quality for this experiment pictures were saved in the highest quality format as possible (TIFF or JPEG). The program Microsoft PowerPoint was used to create each figure and table. Necessary cropping, sizing and labeling were preformed in this program. Figure legends were also written. These Figures were saved again as JPEG or TIFF files to retain their quality. Complete protocol can be found in the BMS110 Lab Protocols: Lab 13 Preparing Data for Presentation and Publication. 6 Cryopreservation of Bacterial Strains The successfully confirmed plasmid was inoculated in a 2 ml culture of LB liquid media tube and placed in a shaking incubator at 37 C. 700 µl of this culture was then added to a 2 ml cryopreservation tube containing 700 µl of sterile 50% glycerol. The tube was labeled with the clone #, our initials, and the plasmid name. The tube was placed in powdered dry ice until solid. Then it was transferred to a -80 C freezer. Complete protocol can be found in the BMS110 Lab Protocols: Lab 14 Cryopreservation of Bacterial Strains. 6 Results Finding RAD51 homolog in Tetrahymena thermophila In the Bioinformatics lab after finding the amino acid sequence of RAD51 in Homo sapiens we took that sequence and put it into the Tetrahymena Genome Database (TGD) and that gave us potential homologs. Out of the results there was only one really good homolog and that was TTHERM_ This had the largest e value (5.3e-110), making it the closest match to
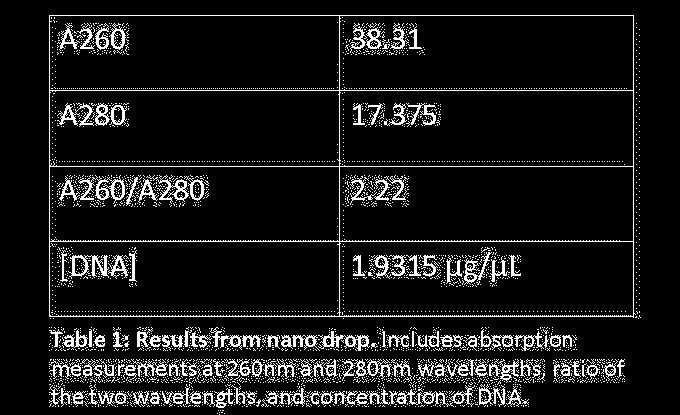
9 RAD51. The TGD also provided the protein sequence, nucleotide sequence, and EST s of the Tetrahymena homolog. The nucleotide sequence was also able to determine what our forward and reverse primers would be useful for the PCR lab (figure 1). Comparing the protein sequences of RAD51 and its homolog with NCBI Specialized BLAST further confirmed their similarities. Isolation of DNA and Visualization of DNA band sizes In the genomic DNA isolation lab we took the DNA out of the Tetrahymena and purified it using various solutions and centrifuging it numerous times. We saw a very small whitish pellet form from this process. When we resuspended it we then quantified it to test its purity using a Nanodrop. After being given the readings for the A260, A280, and A260/A280 that gave us the concentration of the DNA that we isolated and that value was µg/µl (table 1). The next step was to use the Polymerase Chain Reaction to amplify the DNA enough to clone. The two primers found in the bioinformatics lab were used here in master mixes to be split up later. While making the cdna master mix we diluted it with 26.5 µl of sterile water instead of 79.5 µl and had already split it up. To fix this we put all of the cdna solutions back into one tube and added another 53 µl of sterile water. We also used these primers sequences to calculate the annealing temperatures we were going to use on our samples of cdna and gdna (figure 1). We calculate the temperatures to be 53.5 C, 55.5 C, and 57.5 C. To actually visualize the band sizes from the PCR amplified DNA samples we had to use agarose gel electrophoresis using Ethidium Bromide and bromophenol blue dye. We could see the blue dye run to the end of the gel as we ran a current through our samples. Once the band reached half way on the gel we stopped the current and placed the gel in a UV light box so the bands would show up giving us a clear visualization of the band sizes. The band size for the gdna was approximately 1400 base pairs, although the bands got lighter as the temperature got
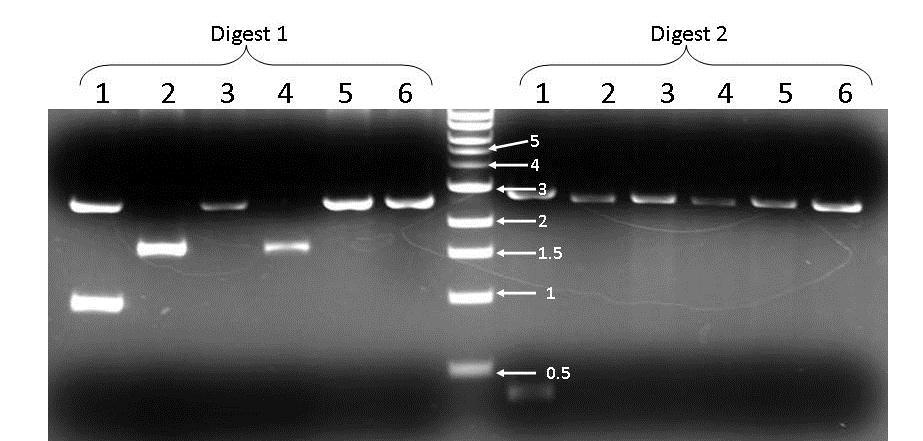
10 higher and only the first two showed up (figure 2). The cdna did not show up at all. The second run of our DNA samples gave better results. This time both the gdna and cdna bands showed up. The band size for the gdna was the same and for the cdna the size was approximately 1000 base pairs. Cloning and E. coli Transformation From the gel we saw there were no primer dimers so we skipped right to the TOPO cloning process. Cloning ended up being with the cdna because we thought it would give better results in the end. After the cloning process, we inserted our cdna into a vector (E. coli) so it could replicate. They were then placed on plates with SOC medium to allow them to grow; a small amount on one plate (50µL) and a larger amount (200µL) on the other. The plate with more had about 130 colonies and the plate with less had 7 (table 2). Construction of Plasmid Map and Restriction Enzyme Digest The plasmid map construction lab we digitally placed our cdna into a plasmid and marked restriction enzyme sites. We chose XhoI/AvrII and PstI/EcoRV as the best enzymes for isolating our plasmid (figure 3). When creating the master mixes for the digest we were out of PstI restriction enzyme, so our best bet was to change it to EcoRI. We also created digital gels of these restriction enzyme digested plasmids, this showed us predicted band sizes. Each digest had two bands (figure 4). The first digest had 2590 base pairs and 999 base pairs. The second digest had 390 base pairs and 2812 base pairs. After the actual digest of the plasmid the first digest showed clone 1 having about 2500 bp and about 900 bp which is what was predicted (figure 5). Clone 2 and 4 showed one band at 1500 bp and 3,5, and 6 showed one as well but at 2500bp. On the second digest the plasmid from clone 1 had two bands one at about 2900bp and one below 500bp, which was also predicted,

11 although these bands are pretty faint. Clones 2 through 6 had only one band at 2900bp. Clone 1 was picked and cryopreservation of the E. coli containing the plasmid with RAD51 cdna cloned in it. Figures and Tables

12
13
14
15 Discussion In conclusion our experiments have generally gone as planned. The bioinformatics lab introduced us to many great databases and how to use them for finding our homolog. The results from this lab, mainly the high e value for the homolog showed us that it was a very close match which will make further experiments on it more helpful to understanding RAD51 s functions in homo sapiens. The isolation of the genomic DNA went smoothly, and that was verified by the value of the concentration of DNA ( µg/µl) calculated by the Nanodrop when quantifying the DNA that was isolated. This value was higher than the recommended value for purity, which was 1.8 µg/µl, showing that our sample was indeed pure enough to use in the PCR lab. During the PCR reaction lab when we were creating the cdna master mix, the mix was diluted with 26.5μL of H2O instead of 79.5µL and then had 53µL H2O added after being split up then put all back into one container. It is possible that this mistake may have affected some of our results, but as far as we can tell it did not. The results from the agarose electrophoresis gel that we ran on our gene showed only the gdna, and of the gdna the gel only showed two of the three temperatures tested. The results of the gdna just show that the first temperature(55.5 C) was the best of temperatures, and allowed the DNA to anneal better than the other two which showed up more faint or not at all. As for the cdna, it could have not shown up because of some mistake earlier, but most likely it was either because the calculated annealing temperatures were not as good as predicted or the cdna was bad. When the gel was run a second time at a new temperature using new cdna the cdna showed up with the correct band size confirming our thoughts about what could have happened. The results from the cloning lab show that the gene was indeed successfully cloned. The DNA
16 replicated successfully as was shown by the colony counts in the results. Also, after the cloned plasmids were digested with various enzymes and run through agarose gel electrophoresis the band sizes for at least one of the plasmids matched the ones predicted by the restriction enzyme digested plasmid digital gel. This confirms that the gene was in the plasmid that was cloned. The successfully cloned and digested plasmid was then cryopreserved to keep it for future projects and experiments. Later, the upper level classes at Missouri State University will be using these plasmids and tagging them with a green fluorescent tracker so they can better understand the genes function in Tetrahymena thermophila. Other scientists are looking into RAD51 function in cancer, so this research will help to determine some of its functions in Tetrahymena, which later can be translated into its functions in Homo sapiens. Something that could be changed for this experiment could be a better overall description of the main purpose of the entire experiment that links together each lab so students might understand what they are actually trying to accomplish in the end. References 1. J. Lu1, L. Wang1, P. Xiong1, E. Sturgis, M. Spitz1, Q. Wei G.T variant in the 5# untranslated region of DNA repair gene RAD51 reduces risk of squamous cell carcinoma of the head and neck and interacts with a P53 codon 72 variant. Carcinogenesis 28: R. Amunugama, R. Fishel Subunit Interface Residues F129 and H294 of Human RAD51 Are Essential for Recombinase Function. PLoS ONE 6(8): e doi: /journal.pone L. Hasselbach, S. Haase, D. Fischer, H. Kolberg, H Stürzbecher. Characterization of the promoter region of the human DNA-repair gene RAD51. Eur J Gynaecol Oncol 26: S. Clancy. (2008) DNA damage & repair: mechanisms for maintaining DNA integrity. Nature Education 1(1) 5. A. Antoniou, O. Sinilnikova, J. Simard, M. Léoné. (2007). RAD51 135g-->c modifies breast cancer risk among brca2 mutation carriers: results from a combined analysis of 19 studies. American Journal of Human Genetics, 81(6), Retrieved from 6. Smith, JJ (2011) BMS110 Section 999 Introduction to Biomedical Sciences Laboratory Procedures.