Supplementary Figure S1. The tetracycline-inducible CRISPR system. A) Hela cells stably
|
|
|
- Bernard Porter
- 5 years ago
- Views:
Transcription
1 Supplementary Information Supplementary Figure S1. The tetracycline-inducible CRISPR system. A) Hela cells stably expressing shrna sequences against TRF2 were examined by western blotting. shcon, shrna sequence against GFP served as a negative control. B) Of the two-vector inducible CRISPR/Cas9 system, one lentiviral vector encodes Cas9 under the tetracycline-inducible promoter and the tetcontrolled transactivator (rtta), and the other lentiviral vector encodes the guide RNA sequence. C) Western blotting analysis of the Hela cell clone with robust and dose-dependent expression of Cas9 in response to different concentrations of doxycycline (dox). Actin served as a loading control. Supplementary Figure S2. Generation of inducible KO cell lines for the six core telomere proteins. A) The region encompassing the sgrna target sites was PCR amplified for TOPO cloning and Sanger sequencing for TIN2_DG cells. All of the 20 TOPO clones sampled are consistent with TIN2 inactivation, with most clones containing large deletions of the intervening sequences while the remainder having small indels at both target sites. B) Positions of sgrna target sites within the genomic loci of the six telomeric proteins are indicated. C) Knockout efficiencies of single vs. dual (DG) sgrna strategies are compared. Cells were collected at different days after dox induction for immunoblotting with the appropriate antibodies. Antibodies against SMC1 and actin were used as loading controls. Molecular weight makers (kda) are indicated on the right. Supplementary Figure S3. Analysis of inducible KO cell lines. A) Cells were collected six days after Dox induction for telomere ChIP assays using appropriate antibodies and dot blots 1
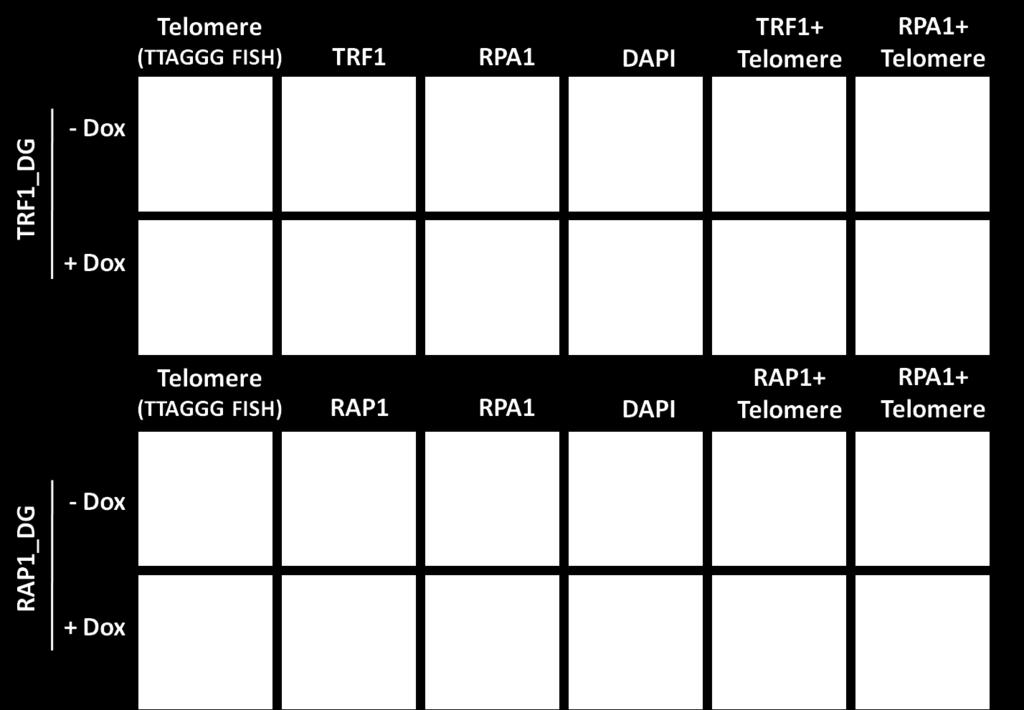
2 with a (TTAGGG) 3 probe. IgG served as a negative control. B) Cells were harvested for metaphase spread and FISH analysis using a telomere probe. Data were quantified and graphed as indicated. At least 50 metaphases were scored for each sample. Supplementary Figure S4. Activation of ATM and ATR in individual KO cell lines. Cells were immunoblotted using the indicated antibodies. The anti-smc1 antibody served as a loading control. Supplementary Figure S5. Genomic DNA was extracted at the indicated time points following Dox induction from various KO cells for hybridization using a 32 P-labeled Alu repeat probe, in addition to analysis using the telomere probe (TTAGGG) 3 (Figure 4B). Supplementary Figure S6. Knockout of RAP1 and TRF1 had no effect on the telomeric recruitment of RPA1. Cells were collected six days after induction and immunostained using antibodies against RAP1 or TRF1 and RPA1 along with a telomere PNA probe. DAPI was used to stain the nuclei. Scale bars 10 µm Supplementary Figure S7. Analysis of POT1 variants in POT1 KO cells. A) Genomic organization of the five splice variants of human POT1. Exons that are added (12a and 15a) or skipped (8 and 17) in various isoforms are in yellow. B) POT1 KO cells ectopically expressing different HA-tagged POT1 variants (that were also sgrna resistant) were collected 7 days after Dox induction, and blotted with the antibodies indicated. Antibodies against SMC1 served as loading controls. * indicates the expected size for the exogenously expressed POT1 variant 2
3 proteins. C) POT1 KO cells ectopically expressing different POT1 variants (that were also sgrna resistant) were stained 6 days after dox induction with anti-rpa1 antibodies and a telomere PNA probe. DAPI was used to stain the nuclei. Scale bars 10 µm D) POT1 KO cells ectopically expressing different HA-tagged POT1 variants (that were also sgrna resistant) were stained six days after dox induction with the indicated antibodies and a telomere PNA probe. DAPI was used to stain the nuclei. Scale bars 10 µm Supplementary Table S1. List of grnas, shrnas, and primers used in the study. 3


 B")
4 Kim et al, suppl. Figure S1 A C MW (KDa) MW (KDa) B
5 Kim et al, suppl. Figure S2a A Percentage of TOPO clones
6 B Kim et al, suppl. Figure S2b


7 C Kim et al, suppl. Figure S2c

8 A Kim et al, suppl. Figure S3A
9 Kim et al, suppl. Figure S3B B TRF2-KO TIN2-KO

10 MW (KDa) Kim et al, suppl. Figure S4

11 Kim et al, suppl. Figure S5

12 Kim et al, suppl. Figure S6

13 Kim et al, suppl. Figure S7a A * Pot1_g1 * Pot1_g2

14 Kim et al, suppl. Figure S7b B MW (KDa)


15 Kim et al, suppl. Figure S7c C


16 Kim et al, suppl. Figure S7d D
17 Kim et al, suppl. Table S1 Name of grna! TRF1 g1! TRF1 g2! TRF2 g1! TRF2 g2! RAP1 g1! RAP1 g2! TPP1 g1! TPP1 g2! TIN2 g1! TIN2 g2! TIN2 g3! POT1 g1! POT1 g2! Target sequence (5'----3')! TAGGGATGCCGACCCTACTG! AGAATTTGAGATCTGGCGTG! GCCTTTCGGGGTAGCCGGTA! CTGTGATGATTAAGGATCGC! CGGCGGCGGACACCGGCTCG! TAAGATCATTCGGCAGTTAA! GCCCCTGATACGTCCGACGT! TCTGTGCTCGGGTCCAAGCT! AGCTGCGGGACCCGCCACCA! GGCCCATACAAAGGCGTTCG! GAACTCTTCGTCGGCCTAGA! GAGATATTGTTCGCTTTCAC! GGAGGTACCAGTTACGGTCG! Name! TIN2 PCR forward primer! TIN2 PCR reverse primer! sequence (5'----3')! GGAGGAGCAACTTTGCTGCACC! ATGGAAGGGAGCCGAGTCAGATC! Name! Target sequence (5'----3')! TRF2 shrna1! AGGAAATGGTGAAGTCTAT! TRF2 shrna2! GAGCATGGTTCCTAATAAT! GFP shrna! CACAAGCTGGAGTACAACT! Table S1. List of grnas, shrnas, and primers used in the study.