CCRD Proteomics facility RIH-Brown University
|
|
|
- Paulina Robinson
- 5 years ago
- Views:
Transcription

1 CCRD Proteomics facility RIH-Brown University Experimental design TO Publication Nagib Ahsan, PhD


2 Where is the CCRD Proteomics Facility COBRE CCRD Proteomics Core Facility 1 Hoppin St, Providence, CORO West, St # TSQ Quantiva Q Exactive Plus Our clients
3 Talk outline 1. Quantitative proteomics 2. Development of highly reproducible Label-free quantitative Phosphoproteomics methods 3. Targeted proteomics for absolute protein quantitation
4 1. Quantitative proteomics 2. Development of Label free Phosphoproteomics 3. Targeted proteomics for absolute protein quantitation


5 The OMICS Cascade
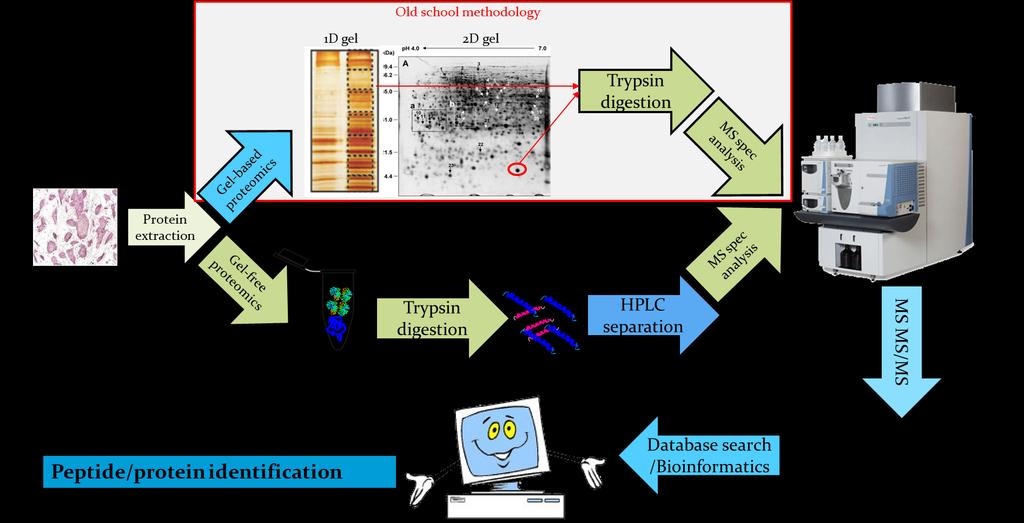
6 Proteomics work flow

7 Comparison of Gel-based and Gel-free proteomics approach


8


9

 for visualization")
10 How CCRD Proteomics Facility analyze the data Automated pipeline developed by Professor Art Salomon group, MCB, Brown Diagram showing intercomponent data flow and communication scheme for HTAPP. PC-1: Data acquisition component; PC-2: perform SEQUEST or Mascot database search; Cluster: perform clustered SEQUEST and/or Mascot search; PC-3: autonomous post-acquisition analysis; PC-4: database server (Peptide Depot) for visualization of proteomic data and execution of post-comparison analyses.
. Proteomics.")
11 How CCRD Proteomics Facility deliver DATA to the Clients A) B) C) Integration of Third-Party Protein Knowledge K. Yu, and A. Salomon (2009). Proteomics. 9:

12 Bioinformatics to handle Large scale proteomics dataset
13 1. Quantitative proteomics 2. Development of highly reproducible Label-free quantitative Phosphoproteomics methods 3. Targeted proteomics for absolute protein quantitation


14 Characterization of the Phosphoproteome Phosphopeptides must be enriched!
15


 and protein")


16 Characterization of the Phosphoproteome Standard Pressure HPLC, Ultra Resolution and Sensitivity Fritless column, methanol packing UHPLC ~ 1000 bar Figure. Comparison of the number of identified unique peptide-spectrum matches (A) and protein groups (B) from a single-run analysis of Jurkat whole cell lysate tryptic peptides using 1.9 μm, 50 cm fritless analytical columns integrated with two different electrospray tips. N. Ahsan, et al., Journal of Proteomics, 2017
17 331% increase in significant changes in the T cell phosphoproteome detected N. Ahsan, et al., Journal of Proteomics, 2017

18 Figure. Venn diagram of the number of unique phosphorylation sites residing on significantly changed phosphopeptides and volcano plot analysis of significantly changed phosphopeptides in T cells in response to CD3/4 stimulation analyzed by the three different analytical columns. N. Ahsan, et al., Journal of Proteomics, 2017

19 Figure. Comparative quantitative phosphoproteomic analysis of T-cells in response to CD3/4 stimulation. Quantitative changes in phosphorylation state of the proteins within the KEGG TCR signaling pathway ontology are represented as heatmaps.
20 Steady Improvement in Method Sensitivity Yield of Unique, Confidently Assigned ptyr Sites (1% FDR)
21 1. Quantitative proteomics 2. Development of highly reproducible Label-free quantitative Phosphoproteomics methods 3. Targeted proteomics for absolute protein quantitation

22 Discovery Proteomics Targeted Proteomics Figure. The balance between scope, sensitivity and scalability of discovery and targeted proteomics.

23 Discovery vs Targeted proteomics workflows using mass spectrometry
24 Targeted proteomics Absolute quantitation Global comparative proteomics Relative quantitation Biological samples Proteins Peptides LC-MS/MS Data analysis LTQ-Orbitrap LTQ-Orbitrap LTQ-Orbitrap LTQ-Orbitrap Triple Quadrupole

25
, creating a slight increase (8-10 daltons) in molecular")

26 What is AQUA Peptide in SRM /MRM Technology 1. An AQUA Peptide is simply a synthetic tryptic peptide corresponding to a peptide of interest. 2. Each AQUA peptide incorporates one stable isotope labeled amino acid ( 13 C and/or 15 N), creating a slight increase (8-10 daltons) in molecular weight. 3. When mixed, the native peptide and the synthetic AQUA Peptide elute together chromatographically, migrate together electrophoreticly, and ionize with the same intensity. 4. However, by mass spectrometry, the native peptide and the synthetic AQUA Peptide are easily distinguished.
27 A case study for quantification Of food Allergen
28 Food allergens -Food allergens are mainly proteins that trigger allergic reactions -Proteins with binding affinity for human IgE antibodies. -According to the allergen nomenclature subcommittee ( around 387 plant and 333 animal food allergens - The Big 8 food which includes egg, fish, milk, peanut, soybean, tree nuts and wheat

29


30 Current status of quantitative proteomics of food allergens N. Ahsan, et al., Journal of Proteomics, 2016

31 Comparison of different methods used for food Allergen quantification
32 Proteomics services in CCRD Proteomics Facility 1. Discovery Proteomics 2. Label-free comparative and quantitative proteomics 3. PTMs analysis and quantitation 4. Enrichment of ptyr peptides and label-free quantitation 5. Targeted proteomics using AQUA-MRM/SRM technology


33 Let us know how we can help you


34 Acknowledgements NIH COBRE Center for Cancer Research Development P20GM103421(NIGMS) NIH Proteomic Core for T Cell Proteomics P01AI091580(NIAID) Dr. Bharat Ramratnam COBRE CCRD Director and Principle Investigator Professor of Medicine Dr. Arthur Salomon COBRE CCRD Proteomics Core Director Professor of Molecular Biology, Cell Biology and Biochemistry Dr. Philip Gruppuso Professor of Pediatrics, Medical Science, and Molecular Biology, Cell Biology and Biochemistry Chris Marshall Departmental Research Administrator COBRE CCRD Jillian Coburn Research Assistant COBRE CCRD Proteomics