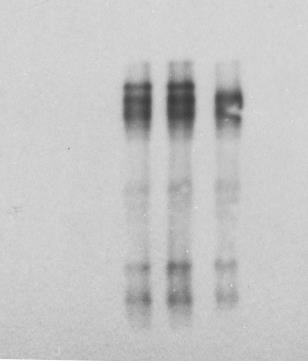
Supplementary Figure 1 Collision-induced dissociation (CID) mass spectra of peptides from PPK1, PPK2, PPK3 and PPK4 respectively.
|
|
|
- Aubrie Barker
- 5 years ago
- Views:
Transcription
1 Supplementary Figure 1 lision-induced dissociation (CID) mass spectra of peptides from PPK1, PPK, PPK3 and PPK respectively.


2 % of nuclei with signal / field a 5 c ppif3:gus pppk1:gus Dk Dk 0 N-YFP:PPK1+ C-YFP N-YFP:PPK1+ C-YFP:PIF3 N-YFP:PIF3+ C-YFP N-YFP:PIF3+ C-YFP:PPK1 b PPK1:CFP (ppk1) Rc Rc Dk R10 Supplementary Figure Intranuclear interaction and overlapping, seedling-wide expression of PPK1 and PIF3. a, PIF3 and PPK1 interact in transient-transfection, Bimolecular Fluorescence Complementation (BiFC) assays. Quantification of BiFC assays in Nicotiana leaves as in Figure 1d. Nuclei displaying a split-mvenus YFP fluorescence signal were counted in five microscope fields, at 0X for each construct, and expressed as a percentage of the total number of nuclei visible in that field. Constructs used: N-YFP and C-YFP, N- and C-terminal domains of split mvenus10 fluorescent protein, respectively, fused (or not) to PIF3 or PPK1 proteins, and infiltrated in two reciprocal configurations. Data are shown as mean ± SEM. b, PPK1 subnuclear localization analysis in the PPK1:CFP (ppk1) transgenic line as in Figure 3. Representative epifluorescent images of CFP fluorescence in hypocotyl-cell nuclei are shown. Seedlings were grown for 3 days in the dark, and then either maintained in the dark (Dk), or given a saturating red-light pulse and returned to the darkness for 10 min (R10 ) before imaging. Arrows indicate apparent light-induced nuclear speckles. c, PPK1 displays a gene expression pattern similar to PIF3 both in the dark and light. Representative images of histochemical staining of GUS activity in -day-old transgenic seedlings grown in the dark (Dk) or continuous red light (Rc). The GUS reporter gene was driven by the PIF3 (left panels) and PPK1 (right panels) promoters, respectively.

 in a Hela cell lysate, then immunoprecipitated with anti-myc antibodies.")

3 PPK3 PPK PPK1 PPK YFP PPK3 PPK PPK1 PPK YFP a In vitro PREY PPK1: FLAG BAIT Input PIF3:MYC Anti-MYC IP 50 b In vitro Input Anti-MYC IP PREY PIF3:HIS BAIT PPK:MYC YFP:MYC 5 c In vitro PREY PIF3:HIS Input BAIT PPK1:MYC PPK1N:MYC YFP:MYC Anti-MYC IP 50 5 d YFP:MYC In vitro phyb - - Pfr Pr PPK1:HA PREY Input Anti-MYC IP phyb:flag PPK1:HA BAIT PIF3:MYC YFP:MYC 5 Supplementary Figure 3 PIF3 interacts with PPK1, PPK, PPK3 and PPK in vitro. a, PIF3 interacts with PPK1 in vitro. PPK1:FLAG was co-expressed with PIF3:MYC or YFP:MYC (control) in a Hela cell lysate, then immunoprecipitated with anti-myc antibodies. Bait and prey proteins were detected by immunoblot using anti-myc (bottom) and anti-flag antibody (top), respectively. b, PIF3 interacts with PPKs in vitro. PIF3:HIS was co-expressed with PPK3-, PPK-, PPK1 or PPK-MYC-fusion proteins, then immunoprecipitated with anti- MYC antibodies. Proteins were analyzed by immunoblot using anti-his antibody (top panel, Prey) or anti-myc antibody (bottom panel, Bait). YFP:MYC was used as a negative control. c, PIF3 interacts with the N-terminal kinase domain of PPK1 (PPK1N) in vitro as detected by co-ip assay as described in b. d, phyb, PIF3 and PPK1 form a trimolecular complex in vitro but phyb- Pfr binding does not enhance PPK1 and PIF3 interaction in vitro. In vitro expressed PPK1 and PIF3 were incubated in the absence (-) or presence of phyb (Pfr or Pr conformer), then immunoprecipitated with anti-myc antibodies. Proteins were analyzed by immunoblot using anti-flag antibody (top panel, phyb Prey), anti-ha antibody (middle panel, PPK1 Prey), or anti-myc antibody (bottom panel, PIF3 Bait). YFP:MYC was used as a negative control.
4 ppk3 gdna ppk gdna ppk1 gdna ppk gdna ppk3 gdna ppk gdna a PPK1 Kinase domain ppk ppk1 703aa PPK ppk3 91aa PPK3 F R R1 ppk 701aa PPK F F1 R R1 7aa b cdna cdna cdna cdna PPK1 PPK PPK3 PPK ACTIN ACTIN ACTIN ACTIN cdna cdna PPK3 5 PPK 5 Supplementary Figure Characterization of ppk mutants. a, Cartoon of ppk T-DNA-insertion mutants. Boxes indicate the exons in the four PPK genes. Red area represents the kinase domain, triangles indicate the positions of T-DNA insertions, and arrow heads refer to the positions of primers used for RT-PCR analysis in panel (b). b, RT-PCR analysis of ppk mutants. Top, primers specific for the full-length open reading frame corresponding to the gene indicated were used to amplify the respective gene from cdna derived from the indicated line or from wild-type genomic DNA (gdna). The ACTIN gene was amplified as a control. Bottom, primers specific for a portion of the PPK3 or PPK gene upstreamto the site of the T-DNA insertion, were used to amplify cdna by RT-PCR for the indicated line. Primer sequences can be found in Supplementary Table 1.

 seedlings of the indicated genotypes were irradiated with red light for the period indicated before protein")

5 a ppk1 ppk3 Min in R Min in R Min in R b ppk1 ppk3 NS Dk 10 0 Dk 10 0 Dk 10 0 ppk1 ppk3 PIF3-P PIF3 NS Tubulin 50 Dk Rc Supplementary Figure 5 PPK1, PPK, PPK3 and PPK function collectively in promoting light-induced PIF3 phosphorylation and degradation. a, Light-induced PIF3 phosphorylation and degradation is normal in the ppk1 single and ppkppk3ppk triple-mutants (ppk3). Dark-grown (Dk) seedlings of the indicated genotypes were irradiated with red light for the period indicated before protein extraction and Western blot analysis using anti-pif3 antibodies. NS: nonspecific bands. PIF3-P, phosphorylated PIF3. b, the ppk1 single and ppk3 triple-mutant seedlings have normal phenotypes. Seedlings of the indicated genotypes were grown for days in the dark (Dk) or continuous red light (Rc).
 Supplementary Figure The ppk13 triple-mutant responds normally to prolonged, continuous far-red light (FRc).")
6 Hypocotyl length (mm) Hypocotyl length (mm) a c FRc ppk13 b ppk13 Dk FRc 1 1 ppk Far-red fluence rate (µmol/ m /s) Supplementary Figure The ppk13 triple-mutant responds normally to prolonged, continuous far-red light (FRc). a, The ppk13 triple-mutant seedlings have phenotypes indistinguishable from WT in FRc, at 3 micromole/m /s 1. b, The ppk13 triple-mutant seedlings respond normally to both dark and FRc. Seedlings of the indicated genotypes were grown for days in the dark (Dk) or continuous far-red light (FRc), at 3 micromole/m /s 1. Error bars represent SE. c, Far-red fluence-rate response curve for hypocotyl elongation in ppk13 triple-mutant seedlings is normal. Seedlings of the indicated genotypes were grown for days in the dark (Dk) or continuous far-red light (FRc). Error bars represent SE.
 Peak area (10E) Peak area (10E8) Peak")
 Peak area (10E8) Peak area")

 PPK1 mppk1 PIF3 100 PIF3:MYC-P")
 1 10 8 d DDFVPWLNHHPSL + DDFVPWLNHHP SL")


 h DKVLNESVASA")
 1 8 j")
 k AVVCSSVGSGNSL DGPSESPSLSLK 3+ 1 8")

7 Peak area (10E) Peak area (10E) Peak area (10E9) Peak area (10E) Peak area (10E8) Peak area (10E) Peak area (10E8) Peak area (10E8) Peak area (10E) Peak area (10E8) Peak area (10E) Peak area (10E) PPK1 mppk1 PIF3 a Anti GST b Anti MYC PPK1+PIF3-WT PPK1+PIF3-A (hrs) PPK1 mppk1 PIF3 100 PIF3:MYC-P PIF3:MYC 100 c NIPPPQANSSR + 8 NIPPPQANSSR + (S58) d DDFVPWLNHHPSL + DDFVPWLNHHP SL + (S10) e DGYCSDFLR Non-phosphopeptide not detected DGYCSDFLR + (S108) 1 8 f KDGNESAPAASS SQYNGFQSHSLY GSDR KDGNESAPAASSSQY NGFQSHSLYGSDR 3+ (S151-3 double) 1 g 1 VLGAKDSEDKVL NESVASATPK 3+ VLGAKDSEDKVLNE SVASATPK 3+ (S) h DKVLNESVASA TPK + 1 DKVLNESVASATPK + (S50 and S53 double) i DNQKACLISE + DNQKACLISE + (S) 1 8 j ACLISEDSCRKD QESEK ACLISEDSCRKDQ ESEK 3+ (S9) k AVVCSSVGSGNSL DGPSESPSLSLK AVVCSSVGSGNSL DGPSESPSLSLK 3+ (S97/99/301) l KHSNIQDIDCHSED VEEESGDGRK + HSNIQDIDCHSEDVE EESGDGRK + (S31) m SAEVHNLSER + SRSAEVHNLSER 3+ (S3) 1 PPK1 mppk1 PPK1 mppk1 Supplementary Figure 7
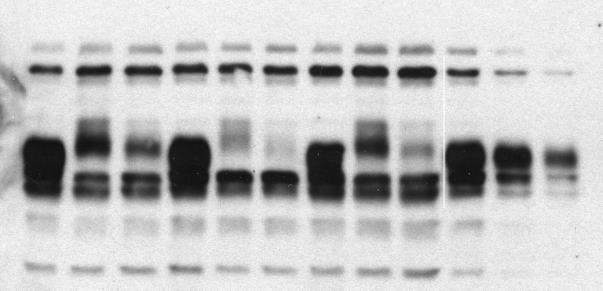
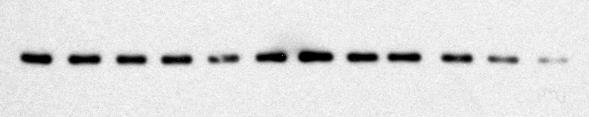
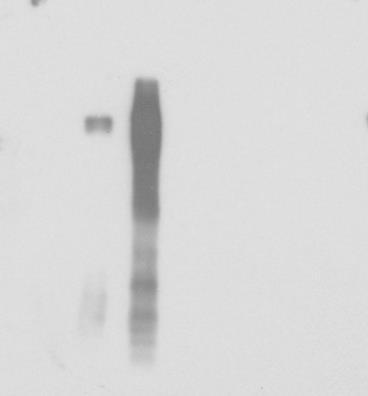
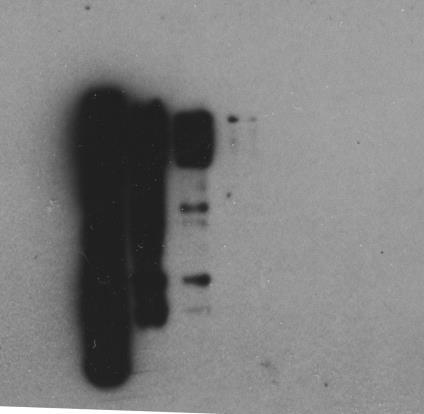
8 Supplementary Figure 7 PPK1 alone phosphorylates PIF3 in vitro at previously-identified light-inducible phosphosites. a, Western blot analysis, using an anti-gst antibody, of N-terminal GST-fusion proteins purified from E.coli for in vitro kinase assays. Top band in each lane represents full-length proteins, lower bands are partially degraded products. b, PPK1 induces a strong phosphorylation-related, mobility-shift in wild type, but not phosphosite mutant-variant of PIF3 in vitro. In vitro kinase assays were performed over the time-course indicated using purified GST-fusion proteins from (a). Fulllength PIF3 proteins were detected by immunoblot using an antibody against the MYC epitope fused at the C-terminus. A0: phosphosite-dead mutant of PIF3 mutated in the 0 phosphoresidues induced by light in vivo. c-m, Mass spectrometric quantification of PIF3 phosphorylation from the in vitro kinase assays with PPK1 or mppk1 (kinase-dead mutant of PPK1) as in Fig. a, using the Parallel Reaction Monitoring (PRM) method. The total integrated fragment ion signal for each peptide containing the light-induced phosphorylation site is plotted as a bar graph. The contribution from each individual fragment ion is displayed as a different color in the bars. Data from three technical repeats of the nonphosphopeptide (left) and phosphopeptide (right) fragments are shown in each panel.


9 mock Bikinin min in red min in red Dk 10 0 Dk 10 0 BZR1:GFP-P BZR1:GFP 50 NS PIF3-P PIF3 Tubulin 50 Supplementary Figure 8 BIN kinase is not required for the light-induced PIF3 phosphorylation and degradation in vivo. Three-day-old dark-grown transgenic seedlings expressing a BZR1:GFP transgene were pretreated with the BIN-kinase inhibitor, Bikinin, or mock for 1 hour before red light treatment for the period indicated. Extracted Proteins were analyzed by immunoblot using anti-gfp antibody (for BZR1, top panel), or anti-pif3 antibodies (middle panel), or anti-tubulin as a loading control (bottom panel).


10 Fig. 1b PIF3:MYC phyb PPK1:CFP 50 Fig. 1e Fig. 1f PIF3: HIS phyb:flag BAIT phyb:flag Shorter exp. BAIT Supplementary Figure 9 Scanned original full-length images of gels and immunoblots.


11 Fig. a PIF3 Fig. b PIF3 Tublin Fig. c PIF3 Tublin Supplementary Figure 9. (continued)


12 1.5X -Dk pk13 pk13 0.X -Dk 0.X 0.5X 0.3X 0.5X pk13 pk13 phyb Fig. 3a Tublin Third replicate for quantification in Fig. 3a, right-hand panel -Dark Dark Rc-9h phyb Fig. 3d phyb Longer exposure phyb Dark Rc-9h Tublin Tubulin Fig. 3f phyb Tublin Supplementary Figure 9. (continued)

13 Fig. a Fig. b Supplementary Figure 9. (continued)


14 Fig 5a PIF3:Myc Fig 5b Phospho proteins Stained membrane Fig 5c 100 Phospho casein 5 Supplementary Figure 9. (continued)


15 Fig. a Fig. b PIF3: MYC phyb: FLAG Phospho proteins PIF3: MYC Fig. c Fig. d PIF3: MYC Stained membrane Phospho proteins Fig. e Supplementary Figure 9. (continued)
16 Supplementary Table 1 Primer sequences Primer name Genotyping PPK3gF PPK3gR PPK3-F LBa1 PPK-F3 PPK-R PPK-F1 PPK1-F PPK1-R PPK1 T-DNA PPK-F PPK-R: RT-PCR PPK3RT-F PPK3RT-R1 PPK3RT-R PPKRT-F PPKRT-R PPK1RT-F PPK1RT-R PPKRT-F1 PPKRT-R1 PPKRT-F PPKRT-R ActinRT-F ActinRT-R Promoter GUS PPK1-Pr-F PPK1-Pr-R: Pull down NdeI-PPK1F SalI-PPK1R SalI-HA-PPK1-R SalPPK1N-R NdeI-PPK3F SalI-PPK3R SalI-PPKR NdeI-PPKF SalI-PPKR In vitro kinase assay PPK1-D7N BiFC AscI-PIF3 PIF3-AvrII AscI-PPK1 PPK1-SpeI SanDI-PIF3 PIF3-BspEI SanDI-PPK1 PPK1-BspEI Primer sequence TCCTCGAGGCAGTTACGAAT GCCAAAATAAATGCAAAGCC TCATGCATTGTTCATTCCCT TGGTTCACGTAGTGGGCCATCG GCAAAGGATGCAATTTTGGT GCCAAGAAAATGCAAATGGT atgccagagttaagaagtggagc TTCAGTTATGTGCATGGGGA ATGTCACCTTTTGAGCACCC ATATTGACCATCATACTCATTGC TCCTGGCAACTTTCCTTGTC AACCACGAATGAGTTCCCAC GATCGAGACGCCTTGACGAGC TAGACTGAAATCCACTGTGTG ACGACCAAGATGTGCATGGCA AACCTAGCCCTCAGGTGAC AGACTGAGATCCACTGACAA AGTGGAGAGAAGGTGGTAGCGGAC GCGATGTTGCCATCTTCTTTTTGC TGGATCAGCATTTACAGTGCTCACAGAC TCCACTTGAAGGGAAAAGAATCACTGAC CTGATGATGAAGGAAACGCTCC GTCTGTGAGCACTGTAAATGCTG GTTGGGATGAACCAGAAGGA GAACCACCGATCCAGACACT ATGTCGAGGCTCGCACCAAG AGCTCAAACCCCATGCAATCG catatgatgccggagc TTCGCCGTGG gtcgacagatacagttcggccatagc gtcgacggcgtagtcgggcacgtcgtaggggtaagatacagttcggccatagc gtcgacttcgcccaagaggtcttga TGGCCACCACCCATATGCCAGAGT TAAGAAGTGG GTGCGGCCGCGTCGACGCAAACTGTCCGACCATAGC GTGCGGCCGCGTCGAC GCAAACTGTCCTCCCAAAGC TGGCCACCACCCATATGCCTGAGCTGCGTAGCAA GTGCGGCCGCGTCGAC TGACACAGTTCGACCATAAC ggttatgtgcatgggaatgttaagccagaa TTggcgcgccATGCCTCTGTTTGAGCTTTTC AGAcctaggccCGACGATCCACAAAACTGATC TTggcgcgccATGCCGGAGCTTCGCCGTGG GGactagtAGATACAGTTCGGCCATAGC GCATGgggtccCCTCTGTTTGAGCTTTTCAG TGTGtccggaCGACGATCCACAAAACTGATCA GCATGgggtccCCGGAGCTTCGCCGTGGAG TGTGtccggaAGATACAGTTCGGCCATAGC