Aim of lecture:to get an overview of the whole process of microarrays, from study design to publication
|
|
|
- Juniper Welch
- 5 years ago
- Views:
Transcription
1 Microarray pipeline Aim of lecture:to get an overview of the whole process of microarrays, from study design to publication Rita Holdhus Intoduction to Microarray technology September 2010 Many of the slides are adapted from a presentation by Christine Stansberg
2 The microarray pipeline
3 Workflow microarray experiment 1 Problem-driven experimental design Wet-lab experiments Quality control RNA labelling Microarrays Hybridisation Washing Scanning Image analysis Gridding Feature extraction 2 3 Data pre-processing Filtering Normalisation Transformation Missing values, Gene expression table Secondary data analysis Differential expression Pattern recognition Functional characterisation Knowledge integration Biological interpretation or discovery Raw data
4 Experimental design What to compare: Groups? Timeseries? How many samples? How many biological replicates? Do we expect big changes in gene expression? Budget? Sampling and extraction- plan
5 Wet lab Sampling Take tissue/cells/aminals and prepare for extraction All according to experimetal plan Extraction Use microarray compatible method Column- based recommended DNase-treatment All according to experimental plan
6 Quality Control RNA-quality measures 260/280 ratio NanoDrop value +/ /260 ratio NanoDrop value normally Bioanalyzer (Agilent Bioanalyzer 2100) profile RIN-number (RNA Integrity Number) 18S and 28S peaks (ribosomal RNA), baseline Rule of thumb: RIN 7.5 DNA contamination? Globin contamination?
7 Characteristic of intact eucaryotic totalrna Fluorescence No small, well defined peaks between ribosomal peaks Distinct 18S Ribosomal Subunit (5s Subunit) Prep Dependant Distinct 28S Ribosomal Subunit (usually ~2X 18S) Flat Baseline throughout electropherogram S 28S Time (seconds) Slide from presentation by May, Hoover, Sims 2002
8 Partially Digested total RNA Fluorescence S ribosomal subunit Intensities of the smaller degraded RNA increases 18S 28S 28S ribosomal subunit In general, the 28S peak begins to degrade first. The peaks begin to shift toward the left of the electropherogram Time (seconds) Baseline between and to the left of the ribosomal peaks becomes jagged. Intensities of the peaks decrease. Slide from presentation by May, Hoover, Sims 2002
9 Genomic DNA contaminated total RNA Genomic DNA skewing 28S peak Fluorescence Additional Genomic DNA Peak 5.0 Nano Peak Sharper 28S Peak S 28S Nano Peak 4 Time (seconds) Fluorescence 3 2 Flat baseline indicates Genomic DNA digestion S 23S Time (seconds) Slide from presentation by May, Hoover, Sims 2002
10 Labelling and hybridization RNA AAAAA AAAAA AAAAA AAAAA Reverse Transcription cdna-mrna hybrid 2nd strand synthesis cdna In vitro Transcription and Labelling Labelled crna Fragmenting Raw Data Wash, Scan, Quantitate Hybridisation
11 Scanning Excitation of dyes Emission of fluorescence Photomultiplier tube (PMT) Raw data analysis Signal detection, amplification, digitisation Data storage,

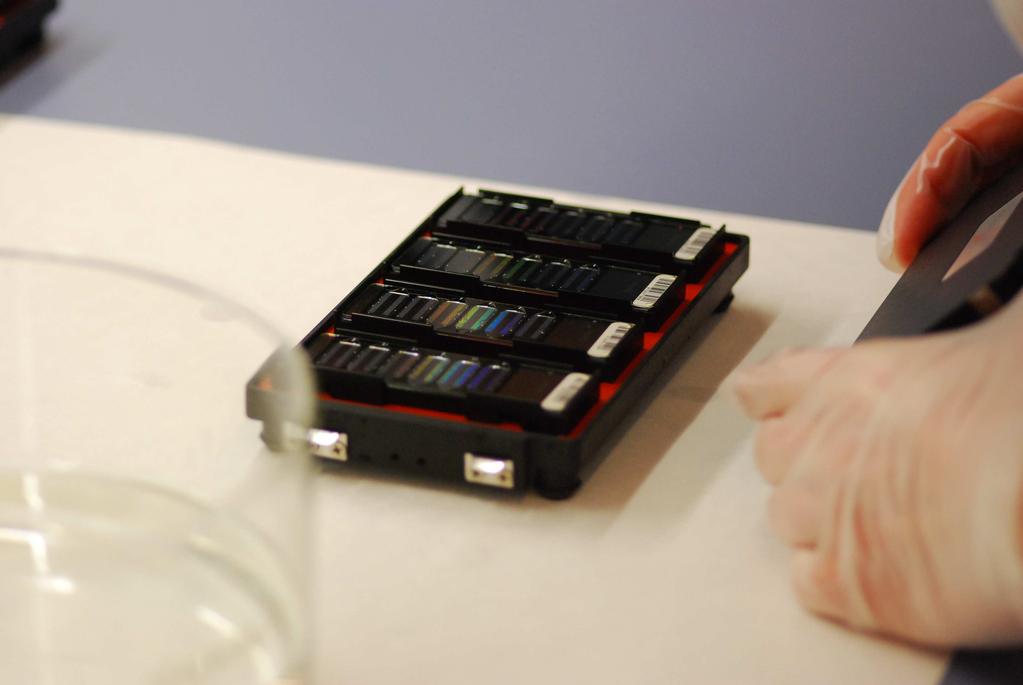
12 Microarrays hands-on Hybridization and washing
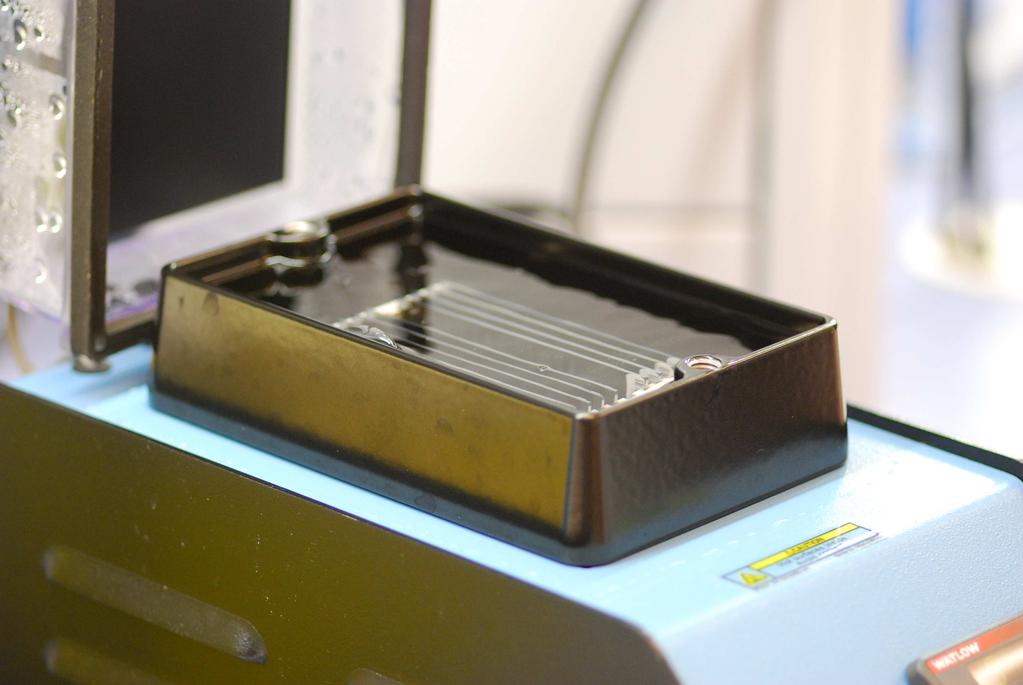
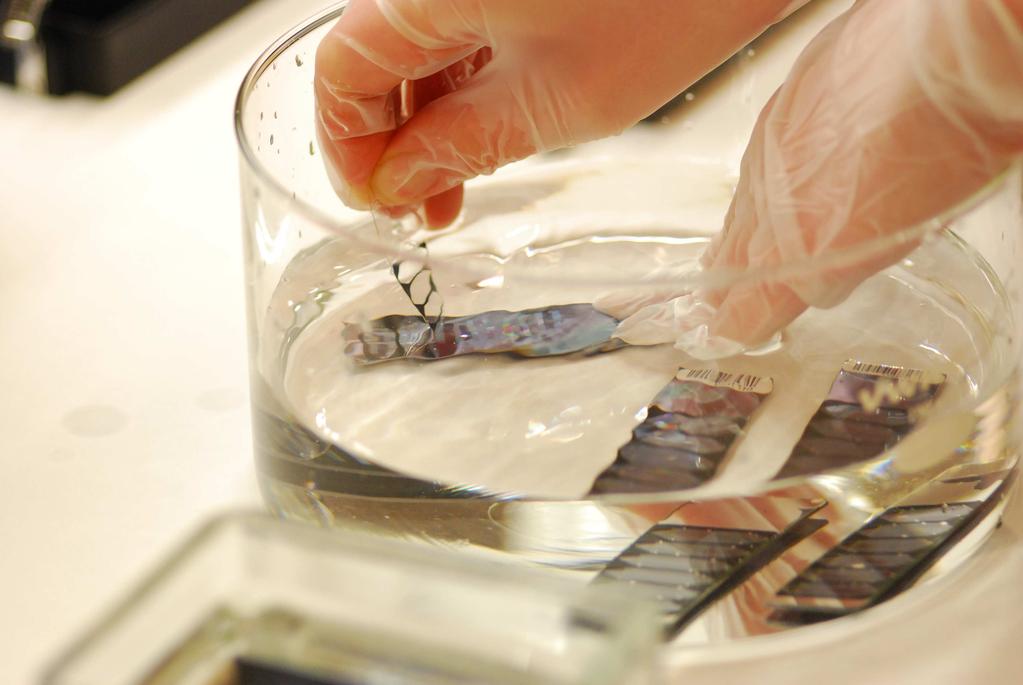

13 Microarrays hands-on Hybridization and washing


14 Microarrays hands-on Hybridization and washing


15 Image analysis Gridding / addressing: Add coordinates to each of the spots Feature extraction: Measure foreground & background signals Quality measures Filtration: Remove bad spots and noise
16 Data Pre-processing Filtering: Low intensity spots (signal to noise) Bad quality spots Normalization: Arrays needs to have a similar signal distribution to be comparable Missing values: Filtering leaves missing values, These has to be replaced Gene expression table Log transformation: To variansstable the microarray data


17 Secondary data analysis Differential expression: ANOVA SAM Pattern recognition Clustering Functional characterisation: Pathway analysis/go Knowledge integration :


18 Tools for data analysis J-express


19 Tools for data analysis TMeV R/Bioconductor
20 Validation Some of the genes found differentially expressed should be validated using Real- Time PCR. Do not only validate genes on the top of the list but some further down as well.

21 BASE BASE in Bergen: BASE Lund:

22 Publication Many journals demand that microarray data should be stored in public repositories such as ArrayExpress or GEO.
23 Summary