Application of Genotyping-By-Sequencing and Genome-Wide Association Analysis in Tetraploid Potato
|
|
|
- Beryl McCormick
- 5 years ago
- Views:
Transcription


1 Application of Genotyping-By-Sequencing and Genome-Wide Association Analysis in Tetraploid Potato Sanjeev K Sharma Cell and Molecular Sciences The 3 rd Plant Genomics Congress, London 12 th May 2015

 PGSC, 2011")

2 Potato genome sequencing DMDD map UHD map (Van Os, 2006) PGSC, 2011 Nature Sharma et al., 2013 G3: Genes, Genomes, Genetics


3 SolCAP 8k Infinium SNP array Stenotomum Cultivated 4x

4 Ascertainment bias Genotyping and Genome type Fixed arrays Flexible platforms A B C D E
5 Genotyping-by-sequencing (GBS) Sample 1 SNP and small INDELs Loss of cut site Sample 2 GBS sequence tag Restriction site Exploits complexity reduction by Restriction digestion Repetitive regions of genomes can be avoided
6 Pros and Cons Simultaneous marker discovery and genotyping Complexity reduction is easy, quick, specific and highly reproducible Simple library preparation, highly multiplexed and less expensive Reduced sample handling, few PCR and purification steps No DNA size fractionation Variation in sample representation less than other protocols Large amount of missing data (43% vs 89%, Elshire et al., 2011 PLoS-One)

7 Establishment of GBS in potato Sequencing-ready GBS library Elshire et al. 2011, PLoS-One; Poland et al. (2012), PLoS-One
 SbfI (CCTGCA*GG) BfaI (T*TAA) PstI NsiI SbfI MseI")
8 Restriction Enzyme combinations PstI (CTGCA*G) NsiI (ATGCA*T) SbfI (CCTGCA*GG) BfaI (T*TAA) PstI NsiI SbfI MseI (C*TAG)
9 Different levels of multiplexing 12plex 24plex 48plex 96plex
10 Consistency in read counts across different multiplexing levels plex 24plex 48plex 96plex

11 De-multiplexing and reads filtering clones per Illumina HiSeq lane, 150 bp reads Average categorised reads/library: ~103 million Average categorised reads/sample: ~4.3 million


12 GBS bioinformatics analysis workflow Raw Reads FastQC Initial quality control of sequences Barcodes De-multiplexing of reads Removal of index and addition of cultivar code to reads Sequence variant calling & genotyping Processing of read depth and coverage Alignment of reads to reference genome sequence VCFtools Filtering genotype calls
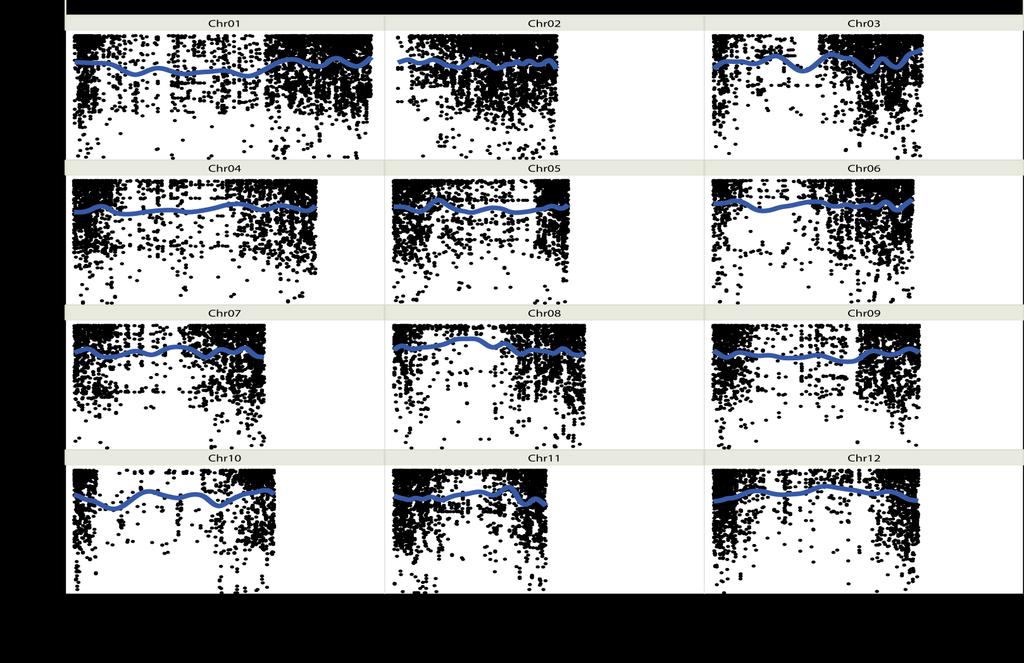
13 Genome-wide coverage of GBS tags All 12 Chromosomes Higher coverage in gene-rich regions Lower coverage in centromeric regions Read depth Chr01 Chr02 Chr03 Chr04 Chr05 Chr06 Chr07 Chr08 Chr09 Chr10 Chr11 Chr12 GBS tags genome-wide coverage Genome-wide gene density Genome-wide repeat region density

14 Aligned GBS tags
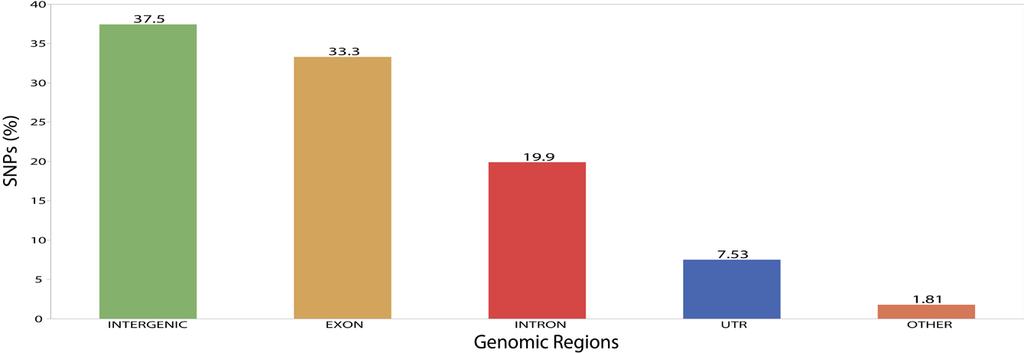
 117,542 (Multiallelic and other filters) 44,700 (Minor Allele Frequency filter) SNP frequency:")
15 Genotyping and SNP calling 270,358 (Total) 219,059 (Association Panel only) 136,903 (Missing data cutoff, 20%) 117,542 (Multiallelic and other filters) 44,700 (Minor Allele Frequency filter) SNP frequency: ~1/46bp
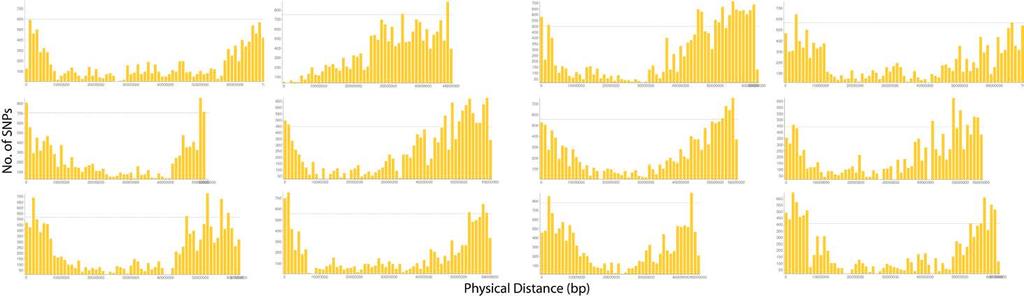
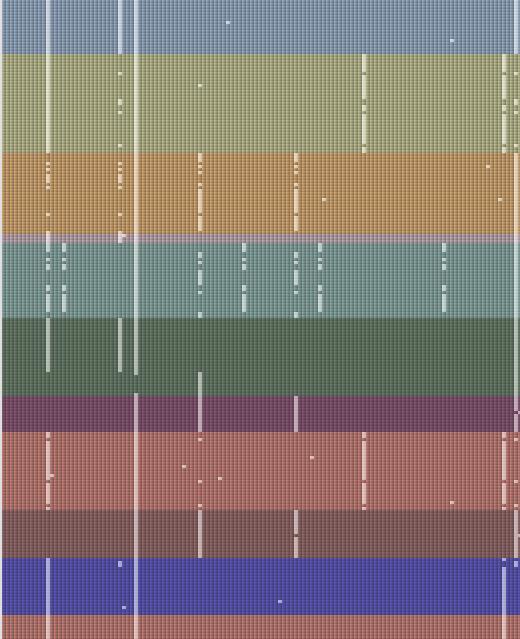
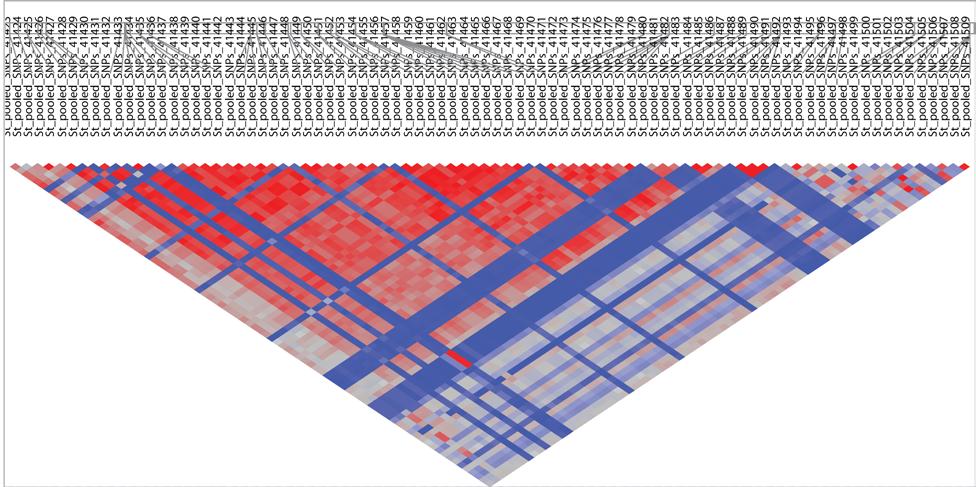
16 SNP Distribution


17 Kinship analysis and Population structure GBS SolCAP


18 Association Panel subgroups Old/European USA Breeding lines European/UK UK
19 Genomic distribution of FST
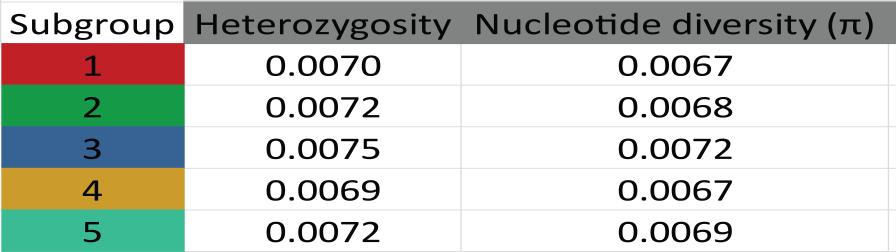
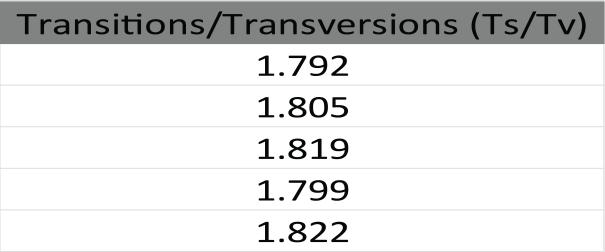
20 Polymorphism Information Content (PIC)


 Association Mapping QTL segregation")
 Larger subset")
21 (Adapted from Soto-Cerda and Cloutier, 2012; InTech) Linkage Mapping vs Association Mapping Linkage Mapping QTL segregation in offspring Marker-trait linkage within-family Poor (0.1 to 15 cm) Subset (only the portion segregating in sampled pedigrees) Association Mapping QTL segregation in population Marker-trait LD in collected population Can be excellent (10 s to 1000 s kb) Larger subset (Theoretically all variation segregating in targeted regions)


22 Genome-wide association analysis (GWAS) ~300 tetraploid genotypes Genotyping by 8K Infinium array and GBS Field trials for evaluation of >20 traits at two sites for two years Cygnet Plant Breeders Ltd


23 Phenotypic trait correlations Inter-replicate reliability Cambridge N+ York N+ Cambridge N- York N- Cygnet Plant Breeders Ltd
24 Different model tests for GWAS Flesh colour locus on chromosome III Full Model (Q&K) Structure (Q) Only Kinship (K) Only Naïve Model (No Q&K)

25 Model Fitness criteria
26 Quantile-Quantile Plot Full Model (Q&K) Structure (Q) Only Kinship (K) Only Naïve Model (No Q&K)
27 GWAS: Flesh Colour SolCAP SNPs GBS SNPs

28 GWAS: Tuber Shape SolCAP SNPs GBS SNPs
29
30 GWAS: After Cooking Blackening
31 GWAS: Stolon Attachment

32 Development of Diagnostic Markers KASP TM marker assay Allelic Discrimination Plots *Kompetitive Allele Specific PCR genotyping system

33 Conclusions GBS validated in 4x material, ~45k robust SNPs for basic and applied research Combines marker discovery and genotyping into a single approach GBS data is dynamic and not affected by ascertainment bias GBS SNPs are confined to gene-rich regions Weak population structure in tetraploid material Good associations with simple and more complex traits Potential for developing diagnostic markers


34 Acknowledgements CMS, JHI Glenn Bryan Finlay Dale Karen McLean Malcolm Macaulay ICS, JHI David Marshall Micha Bayer Industrial Partners Cygnet Plant Breeders Ltd McCain Foods (GB) Ltd Mylnefield Research Services Ltd PGSC BioSS Katrin MacKenzie

35 Traits are highly heritable Codominant additive mode of inheritance (Slide from Leopold Parts, EMBL; Photo by Rene Maltete)