SEQUENCE QUALITY CONSIDERATIONS FOR THE WET LAB
|
|
|
- Brook Daniel
- 5 years ago
- Views:
Transcription
1 National Center for Emerging and Zoonotic Infectious Diseases SEQUENCE QUALITY CONSIDERATIONS FOR THE WET LAB Eija Trees, Ph.D., D.V.M. Chief, PulseNet Next Generation Subtyping Methods Unit PulseNet/OutbreakNet East Coast Regional Meeting January 16, 2019

2 Troubleshooting a MiSeq Run Can Feel Like.
3 Outline Evaluating run parameters using SAV Using SAV for troubleshooting abnormal run parameters Evaluating individual sequences using FastQC SAV-FastQC phenotype vs. troubleshooting


4 Evaluation of a Run in Illumina Sequencing Analysis Viewer (SAV) May be used for an evaluation of the sequencing run Q30, Cluster Density & % Passing Filter Additional useful metrics: Phasing/Pre-Phasing FWHM Intensity Imaging Can use a stand-alone version Need the following for analysis: InterOp folder RunInfo.xml RunParameters.xml Thumbnail images (optional) See SOP PNQ07 for details

 Normal drop in Q30 Abnormal Q30 decrease V3, 600 cycle 70 V2, 500 cycle 75 V2, 300 cycle 80 Nano, v2, 500 cycle Micro, v2, 300")
5 Using SAV for Troubleshooting Q30 Q30 = the percentage of reads within the entire run that have Q scores above 30 Q score = quality indicator of individual reads; Q score of 30 = 1 in 1000 base calls may be incorrect The higher the Q score, the higher accuracy of base calls Normal to see a drop in Q 30 (from Read 1 to Read 4), but a large drop (see images below) is abnormal Could be due to library preparation or reagent issues Kit Chemistry Q 30 (%) Normal drop in Q30 Abnormal Q30 decrease V3, 600 cycle 70 V2, 500 cycle 75 V2, 300 cycle 80 Nano, v2, 500 cycle Micro, v2, 300 cycle 75 80
6 Using SAV for Troubleshooting Cluster Density & Clusters Passing Filter (%PF) Low cluster density can be due to library prep issues: Poor denaturation Incorrect fragment length (too long), etc. Check other metrics for signs of poor library prep (Q30, % Base, FWHM, etc.) Do not rule out other reagent issues (e.g. Qubit) High cluster density typically also due to library prep issues: Overloaded flow cell (may need to lower loading concentration) Incorrect fragment length (too short) Check other metrics for signs of short fragment lengths (% Base, etc.) Cluster density and % Passing filter are inversely related typically if there is a high cluster density the %PF will be low and vice versa. Low % Passing filter may lead to loosing coverage on some samples within the run If they are not inversely related (e.g. cluster density is within range but %PF is low) consider an instrument or reagent issue Kit Chemistry Recommended CD (K/mm²) V3, 600 cycle V2, 500 cycle V2, 300 cycle Nano, v2, 500 cycle Micro, v2, 300 cycle Percent passing filter should be above 80% A run is not failing if the run parameters are outside of the recommended range

7 Using SAV for Troubleshooting Phasing/Pre-Phasing Indicate the rate at which single molecules within a cluster loose sync with each other phasing means they are falling behind and pre-phasing means they are ahead. Summary Tab: Data by Lane Values above 0.25 mean that 0.25% of the molecules are out of sync May also have low Q30 score for the run, and % base and intensity plots may look abnormal as well Typically indicates an instrument or reagent issue: Expired, bad lot, or mishandled reagents Fluidics problem, chiller not at proper temperature, etc.
8 Using SAV for Troubleshooting FWHM Full Width Half Mass (FWHM related to cluster size and intensity) should be between 2 and 3.5. Access graphs of FWHM in the Analysis Tab: Data by Lane, Data By Cycle or Flow Cell Chart Can indicate library prep issues: Values above 3.5 could be indicate longer fragment lengths Normal FWHM graph Values below 2 could indicate shorter fragment lengths Can also demonstrate an instrument issue: Irregular spikes and peaks can indicate an instrument issue
9 Using SAV for Troubleshooting FWHM Chart to the left demonstrates FWHM graph related to an instrument issue (notice spikes ) Graph to the right demonstrates FWHM related to long libraries (note rising above 3.5)
 Irregular jumps/spikes in intensity can indicate instrument or reagent")
10 Using SAV for Troubleshooting Intensity Overall run intensity should be above 90 (Summary Tab) Access graphs of Intensity in the Analysis Tab: Data by Lane should be relatively flat (left) Irregular jumps/spikes in intensity can indicate instrument or reagent issues (right)

 Can also demonstrate an instrument issue: Irregular spikes and")
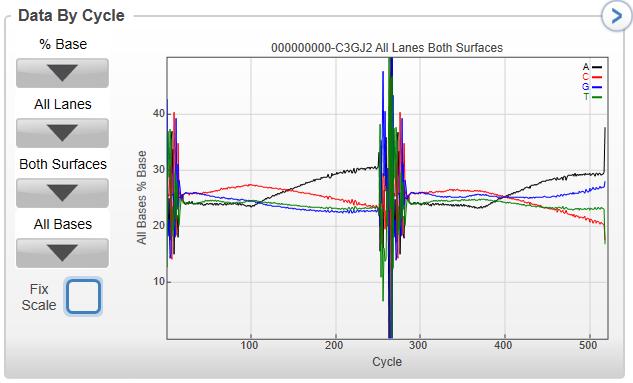
11 Using SAV for Troubleshooting Percent Base (% Base) Access graphs of % Base in the Analysis Tab: Data by Lane or Data By Cycle, should be smooth and relatively together. Typically can indicate library prep issues: Trumpeting at the end of read 1 and read 4 indicates the presence of short libraries (bottom graph) Can also demonstrate an instrument issue: Irregular spikes and peaks can indicate an instrument issue (graph to the right)


 Find the run images on")
12 Using SAV for Troubleshooting Imaging Images may help identify if runs are truly over or underclustered They may reveal flow cell issues (bubbles, etc.) or possible focusing issues (see image on bottom right) Find the run images on the Imaging Tab

13 Using SAV for Troubleshooting Short read lengths - Overtagmentation Short fragment s - Bead ratio incorrect (too high) - Insufficient recovery of longer fragments - Shearing of genomic DNA High cluster density - Low FWHM values - Trumpeting on % Base graph - Low %PF - Q30 drops off at higher cycles Use other tools to confirm presence of short fragments (ex. FastQC, fragment analyzer, etc.), then trouble shoot your workflow.
14 QC of Individual Sequences Minimum Thresholds Organism Estimated Genome size (bp) Target Quality Thresholds Passing but with additional qualifications Scenario 1 Passing but with additional qualifications Scenario 2 Q scores Coverage Q scores Coverage Q scores Coverage L. monocytogenes x x x E. coli/shigella spp x x x Salmonella spp x x x Campylobacter spp x x x Vibrio spp x x x

15 FastQC Analysis Coverage Estimation Basic Statistics Campylobacter estimated from FastQC: 60658x250x2/1,600,000 =18.96x Actual from CDC command line: 12.82x Before trimming Actual average read length


16 FastQC Analysis Passing Q Scores Per Base Sequence Quality & Per Sequence Quality Scores R2 Q score = R2 Q score = Horizontal red line: median Q score Horizontal blue line: mean Q score Yellow boxes: 50% of the reads Whiskers: 80% of the reads Vertical blue line: 125 bp of the read Vertical blue line : Q score 30

 Per Base")


17 FastQC Analysis Suboptimal Q Scores (pass with extra coverage) Per Base Sequence Quality & Per Sequence Quality Scores R2 Q score = R2 Q score = 28.56


18 FastQC Analysis Failing Q Scores Per Base Sequence Quality & Per Sequence Quality Scores R2 Q score = 27.08
19 Insert vs. Fragment vs. Read bp bp bp 800-1,100 bp Median insert size of 300 bp equals to an average read length of: ~ 225 bp with 500 cycle chemistry ~ 135 bp with 300 cycle chemistry


20 FastQC Analysis Acceptable Read Lengths Sequence Length Distribution Average read length = bp Average read length = bp Flat line Slightly elevated line


21 FastQC Analysis Shorter Than Expected Read Lengths Sequence Length Distribution Average read length = bp Average read length = bp


22 FastQC Analysis Normal Per Sequence GC Content Campylobacter Salmonella Vertical blue line: 50%


23 GC Content Can Be used for Contamination Detection if Target and Contaminant Have Different Enough QC Content Kraken: Salm 78.0%, Campylobacter 10.4% Kraken: Enterobacter 10.5%, Citrobacter 9.54%, Salm 8.17% Shoulder
24 SAV Metrics + FastQC Metrics If you observe: Low CD/high FWHM Could be: Long fragments Poor tagmentation (reagent OR technique) Ratio of tagmentation enzyme to DNA is too low Check: Fragment lengths on FA, Qubit reagents, etc. If you observe: Low CD/normal FWHM Could be: Poor denaturation (NaOH or technique) Could be: Instrument or sequencing reagent (may see poor PF%, low quality) Check: Fragment lengths on FA, other SAV metrics If you observe: High CD/short read lengths/trumpeting of % Base Could be: Short fragments Over-tagmentation (technique, reagent issue) Ratio of tagmentation enzyme to DNA is too high Sheared DNA Check: Fragment lengths on FA, FastQC sequence length distribution, etc. If you observe: Poor Q30 Could be: Libraries (technique) or reagents Check: FastQC, all SAV metrics
25 Troubleshooting Approaches for Common Issues Short Read Lengths: Time elapsed before adding NT Visually inspecting pipet tip while pipetting Thoroughly mixing beads prior to use, ensure they do not settle Qubit accuracy Use 0.5x bead ratio (or dual bead clean up, NOT 0.6x) Very often related to method experience Low coverage: What was the cluster density and passing filter % What was loading concentration What MB was loaded Sample sheet calculations correct Low yield after bead clean up: RSB at room temp Decreased drying time Longer re-suspension time in RSB


26 Run Evaluation Practice V2, 500 cycle Read Read Q Length score R R
27 PulseNet SOPs (SharePoint) Resources NOTE: PNL032 is being archived and broken into the following new SOPs: DNA Extraction and QC Nextera XT & Nextera DNA Flex Library Preparation MiSeq Instrument Use and Maintenance PNQ07: Illumina MiSeq Data QC PulseNet QuickTips (SharePoint) Illumina Website & Documents PulseNet troubleshooting account Illumina Tech Support CC: Dan Schoeffner & PulseNet Troubleshooting inbox

28 For more information, contact CDC CDC-INFO ( ) TTY: The findings and conclusions in this report are those of the authors and do not necessarily represent the official position of the Centers for Disease Control and Prevention.