Bioinformatic Analysis of SNP Data for Genetic Association Studies EPI573
|
|
|
- Reynard Horton
- 5 years ago
- Views:
Transcription
1 Bioinformatic Analysis of SNP Data for Genetic Association Studies EPI573 Mark J. Rieder Department of Genome Sciences washington.edu
2 Epidemiology Studies Cohort Outcome Model to fit/explain data Covariates Age, Weight, Sex, Exposure/Environmental Environmental Variables Biomarkers Genetic Factors**
3 Class objectives: What you should learn today What is a SNP? Use as a biomarker - Background What is linkage disequilibrium (LD), tagsnp? Importance Candidate gene vs GWAS (Genome wide assoc. study) What is dbsnp - why is it useful? What is the HapMap? Importance. How to use the Genome Variation Server (GVS): View genotype data, LD, tagsnps. Tutorial
4 How different are humans? CGAAGTGGACACAGGCCTTGAACGTGACGGATTT TTGAACGTGACGGATTT CGAAGTGGACACAGGCGTTGAACGTGACGGATTT TTGAACGTGACGGATTT Single Nucleotide Polymorphism (SNP( SNPs) 0.1% = 1/1000 bp difference 3 billion bp/genome -- 3 million SNPs
5 Genetic Mechanisms Giving Rise to Traits Protein Structure A T A Protein Levels (Expression) T QuickTime and a TIFF (Uncompressed) decompressor are needed to see this picture. QuickTime and a TIFF (Uncompressed) decompressor are needed to see this picture. QuickTime and a TIFF (Uncompressed) decompressor are needed to see this picture. QuickTime and a TIFF (Uncompressed) decompressor are needed to see this picture. QuickTime and a TIFF (Uncompressed) decompressor are needed to see this picture. QuickTime and a TIFF (Uncompressed) decompressor are needed to see this picture. QuickTime and a TIFF (Uncompressed) decompressor are needed to see this picture. QuickTime and a TIFF (Uncompressed) decompressor are needed to see this picture. Phenotype Phenotype PHENOTYPE phenotype
6 Strategies for Genetic Analysis Families Linkage Studies 1. Populations Association Studies C/C C/T C/C C/T C/C C/T C/C C/C 40% T, 60% C 15% T, 85% C C/T C/C C/T C/T C/C C/C Cases Controls Simple Inheritance - Mendelian 2. Continuous Complex Inheritance Single Gene Multiple Genes Rare Variants Frequency Common Variants 300,000-1,000,000 SNPs Phenotype Measure
7 Approaches to Association Studies % T, 60% C 15% T, 85% C Frequency Continuous Quantitative Cases Controls Phenotype Measure Directed - Candidate Gene Studies Genome-Wide Association Studies (GWAS) - tagsnps
8 Candidate gene association studies Choose gene based on previous knowledge Hypothesis driven Gene function Biological pathway Previous linkage or association study Choose DNA variations for genotyping Direct association approach - resequencing (discov.) Indirect association approach - dbsnp (catalog)

9 Individuals Sequence diversity and genetic structure for each gene is different

10 Interleukin 6 Collapsed Dataset: Minor Allele Frequencey (MAF) > 10 % African-Am. Am. European-Am. Most of the SNPs in the genome are rare Significant differences in SNP frequency can exist between populations Correlation between SNPs can be used to select the most informative SNPs

11 SNPs Are Correlated (aka linkage disequilibrium) the nonindependence of alleles at different sites. Pritchard and Przeworski 2001 Genotype at one site can predict genotype at another site Proportion of sites are correlated
12 LD Statistics: Practical Uses SNP correlation described by linkage disequilibrium (LD) r 2 = D 2 f(a 1 )f(a 2 )f(b 1 )f(b 2 ) r 2 is inversely related to power 1/r 2 1,000 cases 1,250 cases 1,000 controls r 2 =1.0 1,250 controls r 2 = 0.80

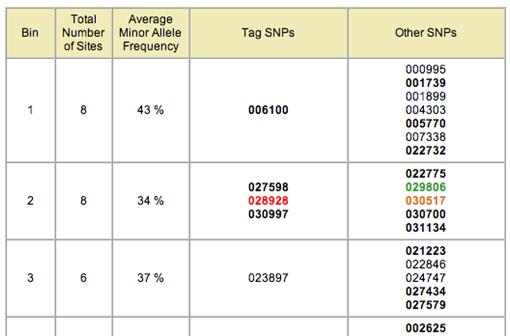
13 Using LD to Pick tagsnps LDSelect Finds all correlated SNPs to minimize the total number Maintains genetic diversity of locus 24 common SNPs 10 tagsnps Carlson et al. AJHG (2004)

14 Why Do We Need tagsnps? Ex: E2F2 Average Gene: 26.5 kb Too Many SNPs to Genotype! 130 SNPs 44 SNPs 5% MAF tagsnps = 8-15 Whole Genome: 15,000,000 SNPs 6,000,000 SNPs > 5% MAF tagsnps = 600,000-1 M
15 Genotype correlations among SNPs decreases the number of SNPs that need to be genotyped tagging SNPs (tagsnps) tagsnps for the whole genome?
16 Finding SNPs: Marker Discovery and Methods SNP discovery has proceeded in two distinct phases: 1 - SNP Identification/Discovery (HapMap Consortium) Define the alleles Map this to a unique place in the genome 2 - SNP Characterization (HapMap genotyping) Determination of the genotype in many individuals Population frequency of SNPs
17 Finding SNPs: Sequence-based SNP Mining (8 samples) Genomic mrna DNA EQUENCING BAC Library BAC Overlap RRS Library Shotgun Overlap Random Shotgun Align to Reference cdna Library EST Overlap SNP Discovery - Sequence Overlap - Few Chromosomes GTTACGCCAATACAGG ATCCAGGAGATTACC GTTACGCCAATACAGC ATCCAGGAGATTACC
 Nov 2008-6.")
18 Development of a genome-wide SNP map: How many SNPs? Feb million (1/1900 bp) Nov million (1/1500 bp) Feb million (1/900 bp) Mar million (validated - 1/535 bp) Nov million (validated - 1/460 bp) ~ 7-10 million common SNPs (> 1-5% 1 MAF) - 1/300 bp Nickerson and Kruglyak, Nature Genetics, 2001
19 Finding SNPs: Marker Discovery and Methods SNP discovery has proceeded in two distinct phases: 1 - SNP Identification/Discovery Define the alleles Map this to a unique place in the genome 2 - SNP Characterization (HapMap genotyping) Determination of the genotype in many individuals Population frequency of SNPs
20 HapMap Project: Create a genome-wide SNP map Genotype SNPs in four populations: CEPH (CEU) (Europe - n = 90, trios) Yoruban (YRI) (Africa - n = 90, trios) Japanese (JPT) (Asian - n = 45) Chinese (HCB) (Asian - n =45) To produce a genome-wide map of common variation GTTACGCCAATACAGG ATCCAGGAGATTACC GTTACGCCAATACAGC ATCCAGGAGATTACC ATCCAGGAGATTACCX X 6 M
21 Finding SNPs: Genotype Data Adds Value to SNPs Indiv.#1: GTTACGCCAATACAG[G/G]ATC ATC CAG G A GATTAC C Indiv.#2: GTTACGCCAATACAG[C/G]ATC ATC CAG G A GATTAC C Indiv.#3: GTTACGCCAATACAG[C/C]ATC ATC CAG G A GATTAC C Confirms SNP as real and informative Minor Allele Frequency (MAF) - common or rare MAF differs by different population Detection of SNP x SNP correlations (Linkage Disequilibrium) Determine tagging SNPs (tagsnps) HapMap completed (3 populations)
22 Phase II - 6M SNPs Genome-wide Density ~ 1 SNP/750 bp Genotype data - 3 pops tagsnps

23 SNP Discovery: dbsnp database dbsnp -NCBI SNP database

 Validated Unvalidated (by")
24 SNP data submitted to dbsnp: Clustering dbsnp processing of SNPs SNPs submitted by research community (submitted SNPs = ss#) Unique mapping to a genome location (reference SNP = rs#) Validated Unvalidated (by 2hit-2allele) 2allele)
 14.7 M reference SNPs (rs# s) s) 6.5 M validated SNPs")
25 Current dbsnp build (129) stats 56 M submissions (ss# s) s) 14.7 M reference SNPs (rs# s) s) 6.5 M validated SNPs
26 rs # s# s are THE nomenclature for SNPs
27 Phase II - 6M SNPs Genome-wide Density ~ 1 SNP/750 bp Genotype data - 3 pops tagsnps
28 Select SNPs to Genotype Based on Linkage Disequilibrium 6 M HapMap SNPs- 3 populations European(CEU), Asians (CHB+JPT), African(YRI) Some SNPs are in LD with many other SNPs Some SNPs are in LD with no other SNPs SNPs between a pair of associated SNPs are not necessarily associated with the flanking SNPs 600,000-1 M common (>5%) tagsnps
, 1 M (v6) Quasi-Random")
 of common SNPs (> 5%) can")
29 Whole Genome Genotyping Platforms Affymetrix Illumina 500K (v5), 1 M (v6) Quasi-Random SNPs 550K, 660K, 1 M SNPs A significant proportion (~80%) of common SNPs (> 5%) can be captured
30 Genome-Wide Association Studies (GWAS) Advantages Genome-wide assay. Multiple independent genes can be tested Association (indirect) defines a relatively small region 10 s kb - (based on linkage disequilibrium) Does not require a priori knowledge of what genes or regions are involved Caveats Typically, requires thousands of samples to find a significant association Statistical issues related to multiple testing (Bonferroni correction) Analysis and replication strategies are important The Hope The identified targets will lead to new biological and medical insights (hypothesis generating)
31 Strategy for GWAS 40% T, 60% C 15% T, 85% C Cases Controls

32 Genome-wide Tour de force Nature 447: ; 2007

33 WTCCC - Wellcome Trust Case/Control Consortium -log 10(P)
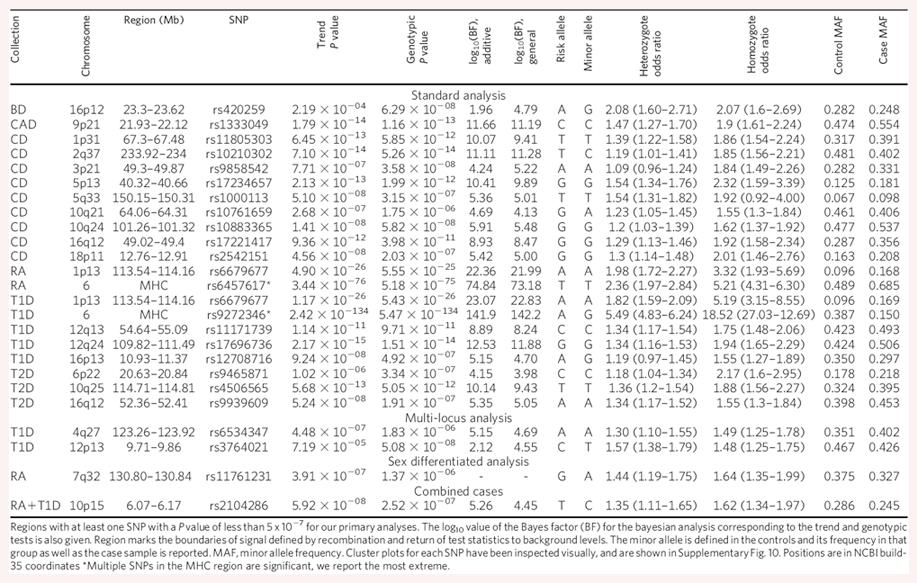
34 WTCCC SNP Associations
35 SNP-Based Association Studies Direct: Catalog and test all functional SNPs 5 Arg-Cys 3 Val-Val Indirect: Use dense map of SNPs and test for linkage disequilibrium (site association) 5 3 Arg-Cys Val-Val Collins, Guyer, Chakravarti Science 278: , 1997
36 tagsnps are indirect associations

 22 Mbp 125,000 SNPs")
37 HapMap SNPs (Indirect) Genome-wide Density ~ 1 SNP/750 bp Genotype data - 3 pops tagsnps egp.gs.washington.edu pga.gs.washington.edu 943 candidate genes (Direct) 22 Mbp 125,000 SNPs Density - 1 SNP/166 bp Genotype data tagsnps
38 Typical Approach: Genotype - Phenotype Studies I have candidate gene/region and samples ready to study. Tell me what SNPs to genotype. Questions: How do I know I have *all* the SNPs? Resequencing How good are the SNPs that are known? Genotype data Are these SNPs informative in my population/sample? Genotype data How do I pick the best SNPs? tagsnps What do I need to know for selecting the best SNPs? LD What SNPs are available to genotype? What are the associations with other SNPs?
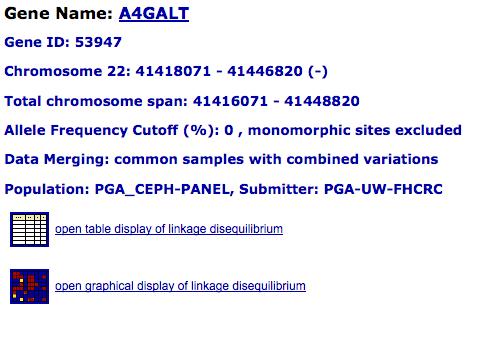
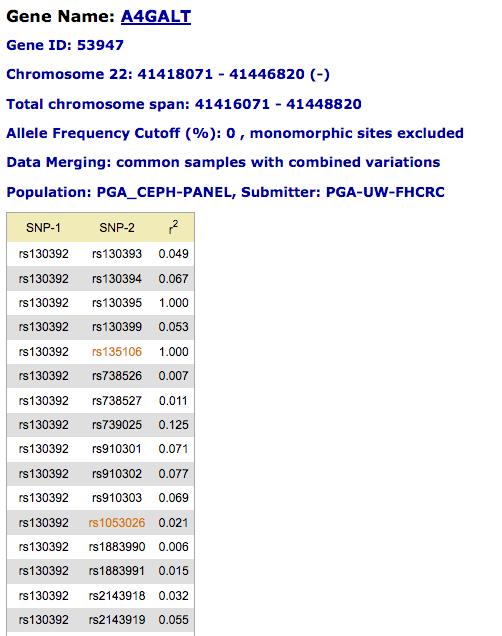
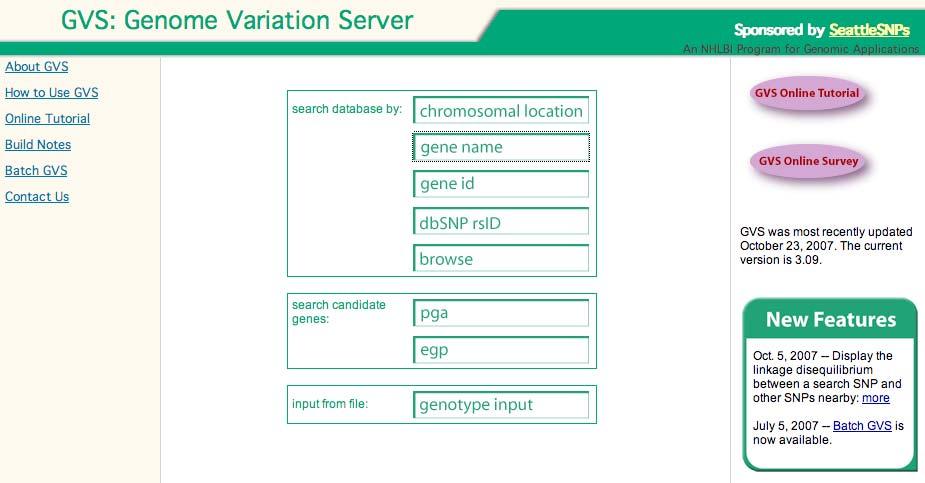
39 Finding SNPs: Databases and Extraction How do I find and download SNP data for analysis/genotyping?. Entrez Gene (NCBI) dbsnp ( Entrez SNP ( Genome Variation Server (GVS) Genotype data from dbsnp HapMap (genome-wide) + high density Tools to find SNPs, tagsnps, and analysis Tools to find SNPs, tagsnps, and analysis (gvs.gs.washington.edu/gvs/)

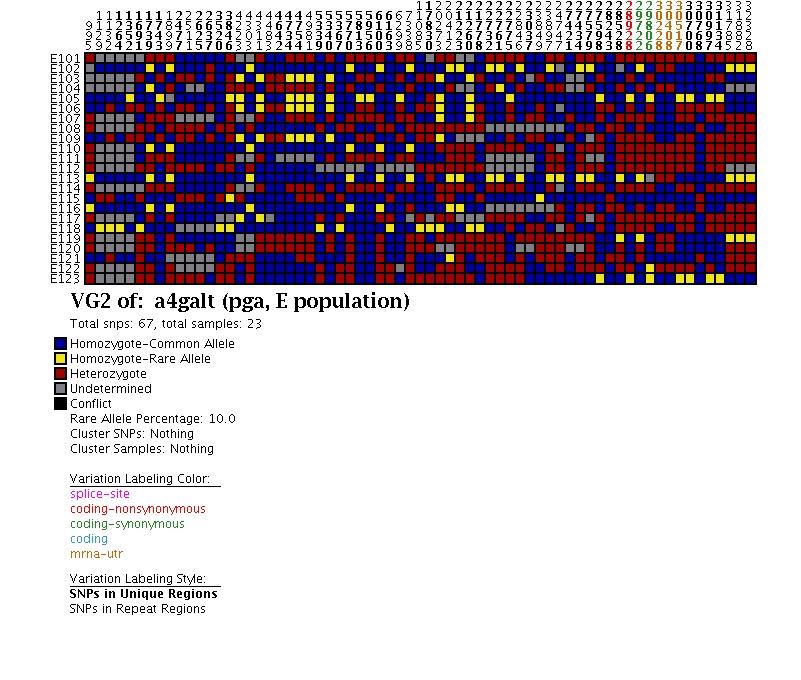
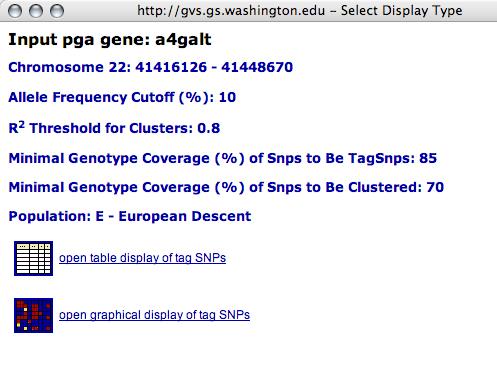
40 GVS : Genotype/Analysis Tool
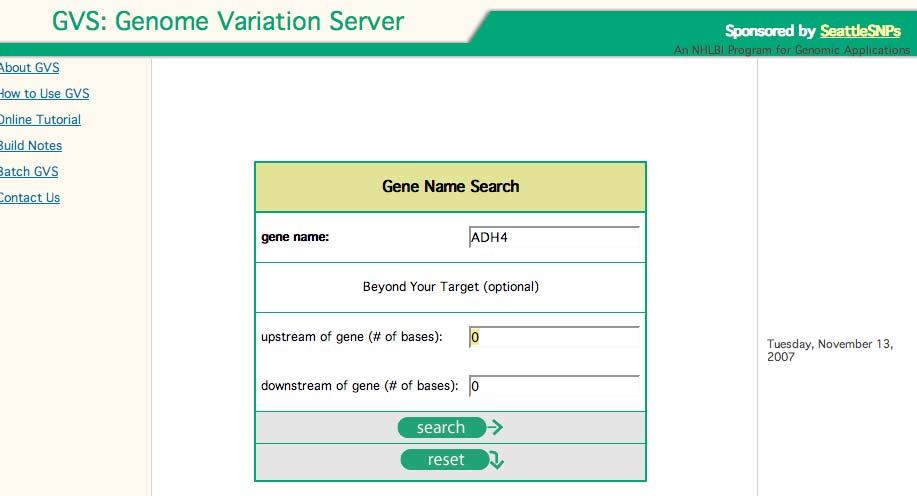
41 GVS: Customized Data Analysis

42 GVS: Customized Data Analysis

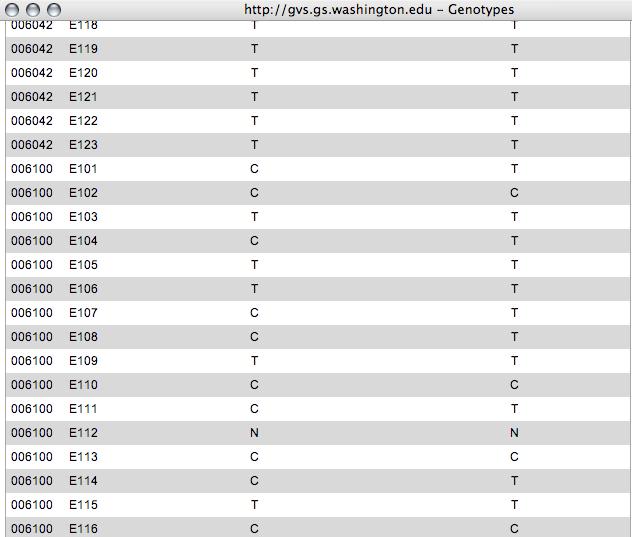
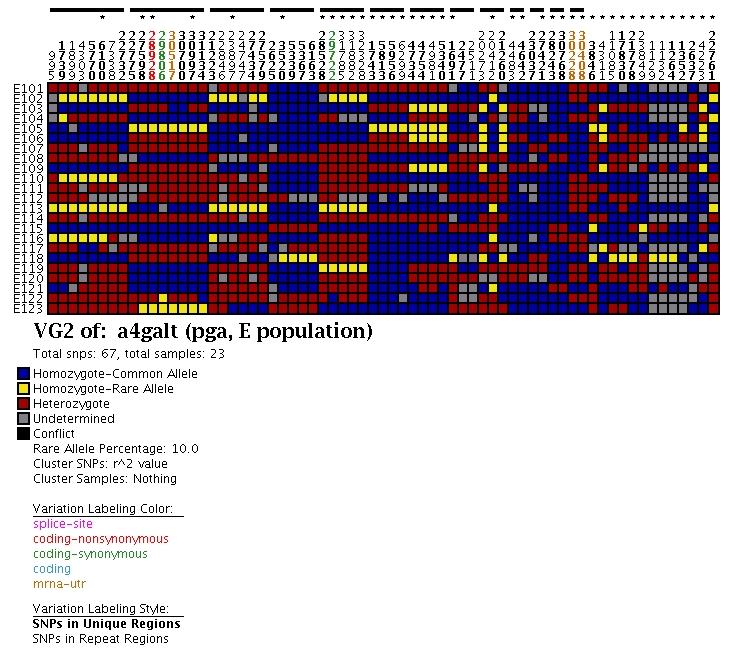
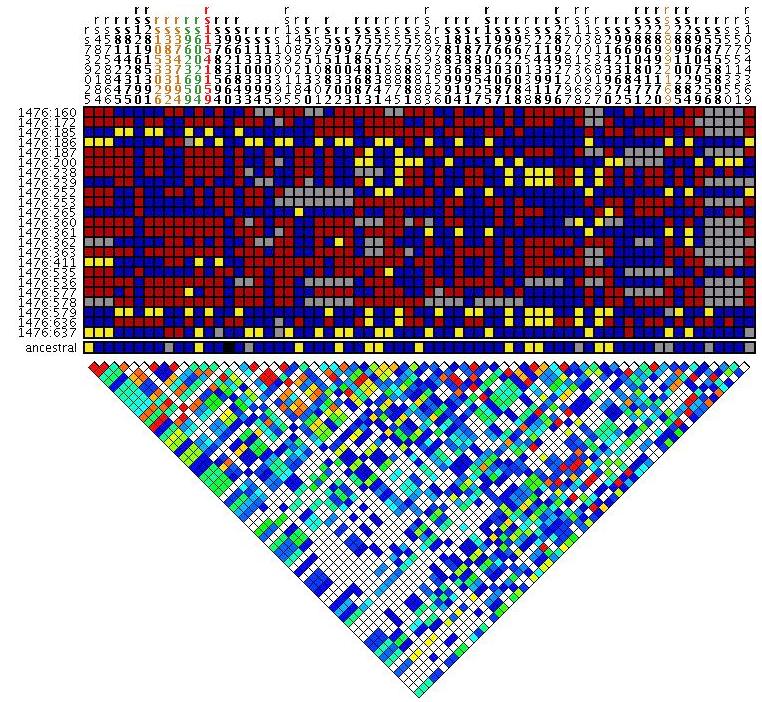
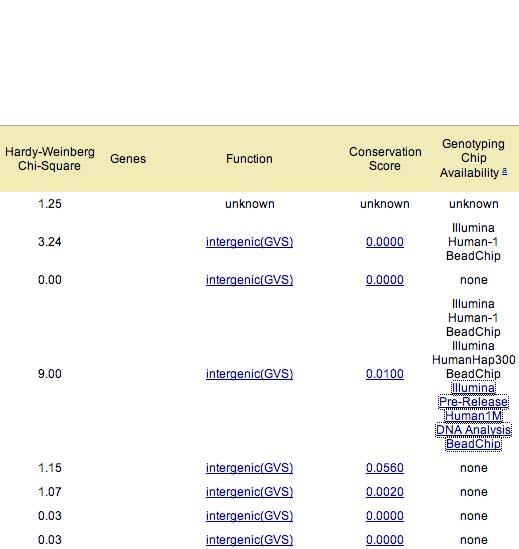
43 Genotypes tagsnps LD Functional Summary
44
45
46
47
48 GVS: Integrates Complementary SNP Data Dense genotypes around a candidate gene can be integrated with broader HapMap genotypes High Density Genic Coverage (Resequencing) Low Density Genome Coverage (HapMap) = SNP discovery/resequencing (1/200 bp) = HapMap SNPs (~1/750 bp)
49
50
51 are needed to see this picture eded to see this p GVS: Genome Variation Server Dense genotypes around a candidate gene can be integrated with lower-density HapMap genotypes QuickTime and a TIFF (LZW) decompressor QuickTime and a TIFF (LZW) decompressor are needed to see this picture. QuickTime and F (LZW) decompr
52 GVS: Genome Variation Server QuickTime and a TIFF (LZW) decompressor are needed to see this picture. A. Common samples- combined variations B. Combined samples- common variations C. Combined samples- combined variations Common Combined
53 GVS: Genome Variation Server A. Common samples- combined variations -Common samples- QuickTime and a TIFF (LZW) decompressor are needed to see this picture. Combined variations
54 GVS: Genome Variation Server B. Combined samples- common variations -Combined samples- HapMap EGP QuickTime and a TIFF (LZW) decompressor are needed to see this picture. QuickTime and a TIFF (LZW) decompressor are needed to see this picture.
55 GVS: Genome Variation Server C. Combined samples- combined variations Combined variations -Combined samples- QuickTime and a TIFF (LZW) decompressor are needed to see this picture. QuickTime and a TIFF (LZW) decompressor are needed to see this picture.
56 GVS In-class Tutorial Use GVS website to: Display Linkage Disequilibrium Select tagsnps Merging SNP data from multiple data sources Answers in back of handout Online tutorial provided at OpenHelix.com