Quantitative Genetics: Markers for Conventional Breeding
|
|
|
- Colleen Atkins
- 5 years ago
- Views:
Transcription

1 Quantitative Genetics: Markers for Conventional Breeding P. K. GUPTA MOLECULAR BIOLOGY LABORATORY DEPTT. OF AGRICULTURAL BOTANY CCS UNIVERSITY MEERUT
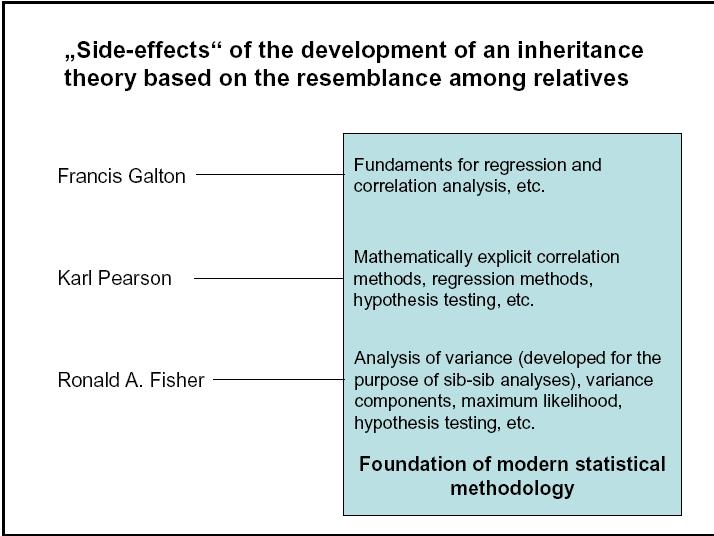
2 Quantitative Genetics Pre-Mendelian Work Francis Galton & Karl Pearson s Work Era 1 ( ) Multi-Factor Hypothesis: simple traits Era 2 ( ) Biometrical Genetics: complex traits Era 3 (1990s and 2000 onwards) QTL (Quantitative Trait Loci) Analysis LD & Association Mapping: complex traits
3

4
5
6 Molecular Markers 1 st Generation Markers (RFLP, RAPD) 2 nd Generation Markers (SSR, AFLP) 3 rd Generation Markers (SNPs) New Generation Microarray-based Markers (SFPs, DArT) Gupta et al. 2008: Heredity
7 Statistical Tools Maximum Likelihood EM Algorithm Bayesian Approach & MCMC Population Structure and TASSEL for Association Mapping
8 Methods: QTL Analysis 1. Linkage Analysis (single marker analysis and interval mapping) 2. Linkage Disequilibrium (LD) and Association Analysis Requirements: 1. Normal distribution of the trait 2. No segregation distortion of marker genotypes
9 Methods of QTL Mapping Single Marker Methods Interval Mapping (SIM, CIM, MIM) Bayesian Approach & Markov Chain Monte Carlo (MCMC) Methods
10 Mapping Populations for QTL Mapping Backcross (BC 1 ) F 2 Doubled haploids (DH lines) Recombinant inbred lines (RI lines) Advanced backcross (BC t ) Advanced intercross (F t )
11 Segregation Distortion Can be caused due to selection It can bias the estimation in recombination It can reduce the power to identify QTL It can bias the estimation of QTL position and effects
12 Statistical Issues Involed in QTL Mapping Hypotheses Distribution of test Statistics (t, F, 2,LR/LOD) Single QTL Multiple QTL Significance level (Churchill & Doerge, 94)
13 Single Marker Analysis (SMA) Model: y j = + β 1 x i + ε j i = Individuals 1 to n; y j = trait value for individual i = population mean; β 1 = trait-marker regression x i = QTL genotype t-test for means of two marker allele classes Marker-trait association through regression of trait on marker genotypes
14 t - Test for QTL Analysis Genotype the population using markers Classify the population in two groups for each marker (on the basis of marker alleles) Work-out trait-means for each group Apply t-test for significance for difference between means for each marker Significant difference means marker-trait association
15 QTL Analysis of Protein Content
16 SMA (Continued) Likelihood Ratio Test (equivalent t-test): L(,β 1, 2 /y,x) = N{y i ( + β 1 X i ), 2 } y i ( + β 1 X i ) = ε j (normally distributed) LR = {L(,β 1, 2 )/ L(, 0, 2 )} LOD = Log 10 LR
17 Limitations of SMA Means of QTL genotype are confounded QTL positions can not be precisely determined (can not distinguish between QTL with minor effect and close linkage from QTL with major effect and loose linkage) Statistical power low
18 Interval Mapping: Three Steps Recording of Data on Mapping Population - 1. Phenotype (Trait) & Genotype (Markers) Construction of a molecular map: MAPMAKER Estimation of position and effects of QTL
19 Simple Interval Mapping (SIM) SIM involves scanning of each bin (1-2cM) for the presence of QTL: two approaches Maximum Likelihood Approach (Lander and Botstein, 1989) Regression Approach (Haley & Knott, 1992; Martinez & Curnow, 1992)
20 Maximum Likelihood Interval Mapping (MLIM) Approach EM (Expectation-Maximization) algorithm Maximize the probability of the presence or absence of QTL Work out LR ratio/lod score Find threshold LOD score Prepare a LOD plot and detect QTL
21 Interval Mapping by Regression Haley & Knott; Martinez & Curnow, 1992 Phenotypes are regressed on a variable l, based on (r, 1-r) for each position in a map interval & for flanking markers genotypes Y = m + l (m = mean, = QTL effect); can be calculated and its significance tested
22 Interval Mapping by Regression Substitute Probabilities for Missing Genotypes A Q B Marker P(QQ) AABB 0.99 AAbb 0.75 aabb 0.25 Aabb b Y. 0 P(QQ) 1
23 MLIM vs RIM MLIM is computationally demanding RIM is simpler and less demanding In general, MLIM and RIM give similar results, and RIM is sometimes preferred Under certain conditions, MLIM may be more precise and powerful
24 Limitations of SIM Number of QTLs can not be resolved (QTLs may be linked) Exact positions of QTLs can not be determined (QTL interactions) Statistical power low (limited information in the model)
25 Composite Interval Mapping (CIM) A combination of SIM & multiple linear regression (Zeng, 1993, 1994): y j = μ +β i x ij + Σβ k x kj + ε j β i = effect of QTL between markers i & i + 1; x ij, x kj = dummy variables for markers i and k in individual j; β k = partial regression of trait on marker k CIM can be conducted using MLIM or RIM QTL Cartographer can be used (all softwares do not have facility for CIM)
26 Advantages of CIM The effects of other QTLs are removed QTL locations and effects unbiased Resolution much higher than SMA/SIM More informative and efficient, since there are more variables in the model
27 Limitations of CIM The test statistics in marker rich region and marker poor regions are not comparable Only QTL main effects can be determined Joint contribution of multiple linked QTL can not be worked out (epistatic interactions can not be worked out) Use of tightly linked markers as cofactors can reduce the statistical power
28 Multiple Interval Mapping (MIM) Model: y j = μ + Σβ ir x ij + Σ (β ir x is )+ ε j Σβ ir x ij = main effects; Σ (β ir x is ) = epistasis May start with CIM results to save time Allows estimations of epistasis Allows estimation of Q x E interactions
29 QTLs with No Main Effects, But Only Epistatic Interactions Many QTLs with no main effects, and having only epistatic interactions may be involved (Xing et al., 2002) At the molecular level also protein protein interactions may be involved in regulations of gene expression
30 Softwares for QTL Mapping QTL Cartographer QTLmapper 1.0 MapMaker/QTL PLABQTL QGENE Bmapqtl (Bayesian Interval Mapping)
31 Gene/QTL Tagging in Wheat Two Markers for GPC Two Markers for PHST One Marker for GW Validation of QTLs for GPC Using NILs QTL Interval Mapping for GPC Using RILs QTL Interval Mapping for 14 Traits Using ITMImap and ITMIpop
32 QTL Analysis of Protein Content
33 Composite Interval Mapping (CIM) for days to maturity involving chromosome 2D
34 What is Association Mapping? Population-study for marker-trait associations - Also called Association analysis/ld mapping - Relies on historic sources of disequilibrium Two main approaches in humans: - Case-control studies - Transmission disequilibrium tests
35 Association Mapping: Why? More opportunities for recombination giving rare recombinants Map distances more precise with relatively small sample sizes If LD decays too fast in a region, many markers needed to scan target region Contd
36 Association Mapping: Why? Population survey: multiple alleles are represented, & inferences are broader than for a single mapping population - QTLs identified are useful in diverse genetic backgrounds
37 Association Mapping: Where? Initially used for outbreds: controlled crosses are difficult or impossible In humans, association used to identify & clone several genes for diseases like: Cystic fibrosis Diastrophic dysplasia One of the major Alzheimer s factors
38 Association Mapping: How? Two Main Approaches - Candidate Gene Approach - Genome-Wide Association Mapping

39 Genome-Wide vs Candidate-Gene Association Mapping
40 Steps for Association Studies: (1) Selection of population samples, (2) Study of population structure (3) Phenotyping for traits of interest (4) Genotyping candidate genes/genome (5) Testing marker-trait association
41 Types of Populations Classic Association Populations (diversity estimated and population of diverse unrelated individuals developed) Family Based Association Populations Joint linkage & association analysis: TDT, family based association tests (FBATs); QTDT, Q Inbred Pedigree DT (QIPDT) Special Association Populations (e.g. NAM)
42 Population Structure (PS) PS creates genome-wide LD between unlinked loci; effect of PS on Association is controlled by -Genomic Control (GC) -Structured Association (SA) -Unified mixed model approach (Q+K) (K = familial relatedness between individuals; Q = relatedness due to population structure are considered as independent variables) The genetic makeup of the study population defines association tests to be used.
43 TASSEL for Association Studies TASSEL = Trait Analysis by association. Evolution, Linkage (Yu et al. 2006) -LD calculated as D and r 2 and P-values -Diversity analysis tools also available -Sequence align, SNP/indel extraction -Uses SNPs/SSRs/sequences/phenotypes

44 Nested Association Mapping (NAM) Proposed by Ed Buckler -Yu et al. 2008, Genetics 178: 539 Combines QTL & Association Mapping -Select diverse founders & develop ~5000 RILs from 25 families (~200 RILs/family) -Densely genotyping the founders

45 Genome reshuffling between 25 diverse founders
")
46 A pair of polymorphic CPS markers leading to fine mapping of NAM CAP markers CPS Markers = Common Parent Specific (B73) Markers
47 TDT & Admixture Mapping Mapping by Admixture LD (MALD) Transmission Disequilibrium Test (TDT) controls false positives by using two parents and single progeny MALD detects linkage by testing ancestry of marker-trait association (when parent populations differ in allele frequencies)
48 Multi-trait Association Mapping (MTAP) Stich et al. (2008), TAG 117 (6): (Melchinger group on sugar beet) Generally single traits are studied at a time in association mapping; same QTL may affect two or more correlated traits MTAP distinguishes between pleiotropy & close linkage
49 Association mapping in Multiple Segregating Populations (AMMSP) Stich et al. (TAG: 117, # 7, Nov. 2008) (Melchinger s group on sugar beet) NAM needs populations by crossing many inbreds with a common genotype AMMSP uses multiple related crosses from routine plant breeding programs AMMSP Successfully used in sugar beet
50 Multiparent Advanced Generation Inter-Cross (MAGIC) for LD First prposed and applied in mice Population captures majority of variation Coarse mapping possible with low marker density in early generation Fine mapping in advanced generations using higher marker density Will exploit advances in genomics
51 Ideal Population for Association Formed from a few founding ancestors Maintained in relative isolation Random mating has occurred over a number of generations, but not too many LD decayed over fairly small map distances Adequate LD still exists between marker & linked QTL Linkage disequilibrium (LD) decay plot of shrunken 1 (sh1) in maize. Data from Remington et al., 2001
52 Association Analysis in Maize (Dwarf8 and sugary1) Dwarf8 gene in maize: Thornsberry et al., 2001 Associated with early flowering & low pl ht LD decayed rapidly no association between flowering time and tb1, located 1 cm from d8 Sugary1 (su1) in sweet corn: Whitt et al., 2002 Little recombination observed within the locus
53 More Genes for LD in Maize Yellow1 (Y1) Teosinte Branched 1 (Tb1) Lycopene epsilon cyclase (LcyE) - Recommended for biofortification of maize for vitamin A using MAS (Science Jan 2008)
54 Extent of LD in Other Plants Arabidopsis LD extends much farther (Ca maize) Self-pollinating LD typically decays within ~250 kb ( 1 cm) Sugarcane LD extends ~10 cm Due to bottleneck in breeding history (interspecific cross) May also be an artifact due to polyploidy
55 Association Mapping of Kernel Size and Milling Quality in Wheat Mark E Sorrells (Cornell) Association Studies Crop Sci 45: Genetics 172: QTL Interval Mapping Field Crop Res 101:
56 Association Studies in Other Plants Oryza sativa (Olsen and Purugganan 2002). Pinus taeda (Ersoz 2006) Eucalyptus spp. (Thumma et al. 2005) Lolium perenne (Sk øt 2005) Beta vulgaris (Hansen et al. 2001) (For details, see review by Ersoz et al., 2007)
57 Integration of Association Analysis in a Breeding Program Parental Selection Germplasm Hybridization Novel & Validated QTL/Marker Associations Marker Assisted Selection New Populations Selection (Intermating) New Synthetics, Lines, Varieties Evaluation Trials Elite germplasm feeds back into hybridization nursery Genotypic & Phenotypic data Elite Synthetics, Lines, Varieties