Association studies (Linkage disequilibrium)
|
|
|
- Monica Brown
- 5 years ago
- Views:
Transcription
1 Positional cloning: statistical approaches to gene mapping, i.e. locating genes on the genome Linkage analysis Association studies (Linkage disequilibrium)
2 Linkage analysis Uses a genetic marker map (a map of polymorphic loci) Looks for co-segregation with a marker (polymorphic locus) Simple Idea: To determine if marker allele at a known location travels with the disease in a family
3 Linkage Analysis To identify the chromosomal region in which the disease-gene is located without knowing its function If in a family a disease D is transmitted associated with specific markers M, then the disease -gene mapped near these markers and D and M segregate together Main aim of linkage analysis: To evaluate the distance between D and M
4 Chromosomal region non in-linkage with the disease Chromosomal region in-linkage with the disease Meiotic recombination is exploited to define the small region in-linkage with the disease

5 Linkage Analysis is based on RECOMBINATION Genetic mapping the aim is to discover how often two loci are separated by meiotic recombination If two loci are on different chromosome they will segregate independently Children will have 50% chance to receive each of these loci. Recombination fraction is = 0.5 If loci are on the same chromosome they are expected to segregate together ( = 0) but due to meiotic recombination this does not always happen (0 < < 0.5 ) The further two loci are on the chromosome the more they recombinate The is a measure of the distance between two loci

6 Recombination will rarely separate loci which lie very close ( =0) Alleles on the same small chromosome segment tend to be transmitted as a block through a pedigree - called haplotype -that can be tracked in families and populations Recombination fraction defines genetic distance How can we calculate the? The proportion of children who are recombinant is the recombination fraction between the two loci A and B during meiosis
 However there is interference during crossing-over since one chiasma can inhibit another Kosambi function d=0.")
7 Two loci which show 1% of recombination are defined as 1 centimorgan distance (cm) The mathematical relationship between recombination fraction and genetic map distance is described by the mapping function Haldane function d= 0.5ln (1-2 ) However there is interference during crossing-over since one chiasma can inhibit another Kosambi function d=0.25ln[(1+2 )/(1-2 ) Recombination map Physical map 1 male cm = 0.9 Mb 1 female cm = 0.7 Mb


8 To perform linkage analysis you need genetic markers Characteristics: highly polymorphic the rarest allele with a frequency of at least 1% feasible and stable in the pedigree well-known position in the genome genetic map of markers Genetic map of markers in 1980 Human complete genetic map of microsatellite markers in 1992 by Cohen and colleagues
9 Genetic linkage and disease Suitable large families are collected and segregation of the disease is compared with the segregation of the markers By using statistics it is tested the probability that the two loci (markers) are not in linkage (null hypothesis; threshold is p=0.05) in one family (LOD SCORE) Data from different families are collected and combined LOD SCORE = is the logarithm of the odds that the loci are linked rather than unliked It is a function of recombination fraction and is the product of the probabilities in each individual family When is 0.5, lod score is 0 Z =3 is the threshold to accept linkage

10 The overall probability of linkage in a set of families is the addition of LOD scores in each family Linkage analysis can be more efficient if data for more than two loci are analyzed simultaneously Multipoint mapping
11 Linkage analysis and positional cloning: BRCA1 The existence of BRCA1 was proven in 1990 by mapping predisposition to youngonset breast cancer in families to chromosome 17q21. Knowing that such a gene existed and approximately where it lays triggered efforts by public and private groups to clone and sequence it.brca1 was positionally cloned in September 1994 Mary Claire King identification of the more informative families identification of the locus for the susceptibility

12 Linkage analysis and positional cloning: BRCA1 Families were analyzed with microsatellites spanning the region lod scores were calculated for each family and add up for all the families characterization of an open reading frame
13 Parametric Linkage Analysis Parametric linkage analysis can be applied when there is a probability that a gene important for a disease is linked to a genetic marker It is studied using the LOD score, which assesses the probability that the disease and the marker are cosegregating. It can be used when we have a pedigree with a clear type of inheritance and genotype-phenotype correlation Non- Parametric Linkage Analysis Non-parametric linkage analysis studies the probability of an allele being identical by descent with itself It is used when the type of inheritance is not known Less powerful, but you can apply it to a lot of families
14 Linkage analysis Great success in identifying genes for simple Mendelian diseases Few success in identifying genes contributing to complex disease Unsuccessful in identifying genes contributing to common complex disease
15 Linkage disequilibrium (LD) The nonrandom association of alleles in the population Alleles at neighboring loci tend to cosegregate Linkage disequilibrium implies population allelic association
16 Linkage Disequilibrium Mapping Population based Look for variant allele in LD with disease If most affected individuals in a population share the same mutant allele, then LD can be used to locate the chromosomal region harboring the disease
17 Association studies: which allele of which gene is associated with the disease? Case-Control Studies Common method in epidemiology Cases Controls from the same population this implies that cases and controls should have similar genetic backgrounds
18 Linkage and association are different phenomena - Association is a statistical statement about the co-occurrence of alleles or phenotypes (e.i. allele A is associated with disease D if people who have D also have more A). The association can have many possible causes (not all genetics). - Linkage is a relationship between loci and does not of itself produce any association in the general population. Linkage creates association within families, but not among unrelated people. However, if two supposedly unrelated people with disease D have inherited it from a distant common ancestor, they may well also tend to share particular ancestral alleles at loci closely linked to D (Linkage disequilibrium ) Statistical association can develop for different reason: direct cause-effect natural selection Stratification of the population linkage disequilibrium Association studies are based on the use of haplotypes
19 Case-control study: OR Cases (disease) Controls (no-disease) a allele A B non-a allele C D Odds ratio = odds allele a in cases / odds allele a in controls Odds ratio= A/B = A/B x D/C= AD/BC B/C OR= 1 (no association); OR>1 the allele contributes to the disease
20
21 HapMap and location of genes involved in medically important traits About 10 million SNPs exist in human populations, where the rarer SNP allele has a frequency of at least 1%. Researchers trying to discover the genes that affect a disease, such as diabetes, will compare a group of people with the disease to a group of people without the disease. Chromosome regions where the two groups differ in their haplotype frequencies might contain genes affecting the disease. Theoretically, researchers could look for these regions by genotyping 10 million SNPs. However, the methods to do this are currently too expensive. The HapMap identifies which 200,000 to 1 million tag SNPs provide almost as much mapping information as the 10 million SNPs. This substantial cost reduction makes such studies feasible to do.
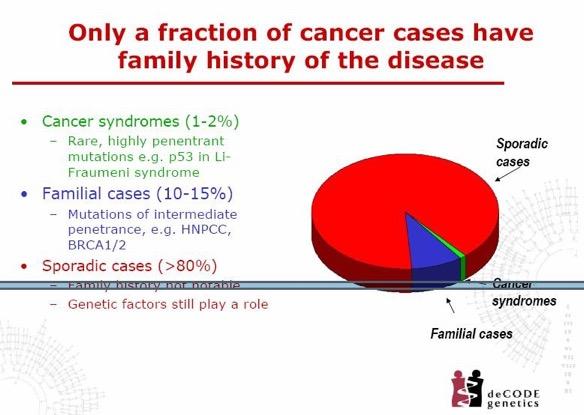
22 Sporadic CRC is a multifactorial (complex) condition environmental factors genetic factors study of twins: 35% of all CRC cases have a genetic component first-degree relatives of CRC patients are well- recognized to have a 2- to 4-fold increased risk of developing the disease recessive genes? pathogenic mutations of low penetrance complex gene-gene and gene-environment interactions
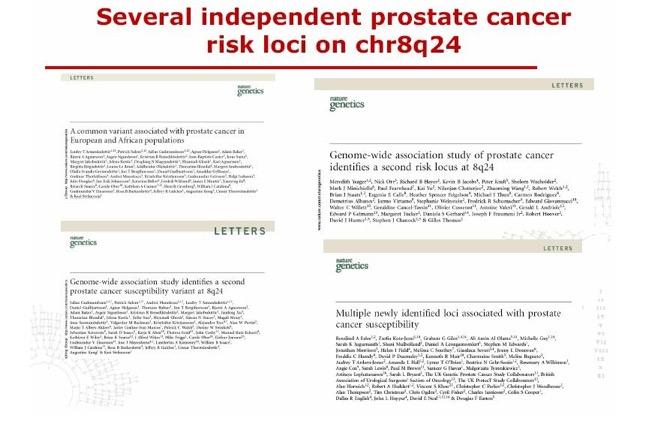
23 Tomlinson et al. A genome-wide association study identifies colorectal cancer susceptibility loci on chromosomes 10p14 and 8q23.3 Nature Genetics 40, (2008) Tenesa et al. Genome-wide association scan identifies a colorectal cancer susceptibility locus on 11q23 and replicates risk loci at 8q24 and 18q21 Nature Genetics 40, (2008)
24 In a genome-wide association study to identify loci associated with colorectal cancer (CRC) risk, we genotyped 555,510 SNPs in 1,012 early-onset Scottish CRC cases and 1,012 controls (phase 1). In phase 2, we genotyped the 15,008 highest-ranked SNPs in 2,057 Scottish cases and 2,111 controls. We then genotyped the five highest-ranked SNPs from the joint phase 1 and 2 analysis in 14,500 cases and 13,294 controls from seven populations, and identified a previously unreported association, rs on 11q23 (OR = 1.1; P = 5.8 times 10-10), showing population differences in risk. We also replicated and finemapped associations at 8q24 (rs ; OR = 1.19; P = 8.6 times 10-26) and 18q21 (rs ; OR = 1.2; P = 7.8 times 10-28). Carrying all six possible risk alleles yielded OR = 2.6 (95% CI = ) for CRC. These findings extend our understanding of the role of common genetic variation in CRC etiology. Tenesa et al. Nat. Genet., 2008
25
26
27
28
29
30
31
32
33
34
35
36
37
38
39
40
41
42
43
44
45
46
47
48
49