POPULATION GENETICS. Evolution Lectures 1
|
|
|
- Maximillian Lawson
- 5 years ago
- Views:
Transcription
1 POPULATION GENETICS Evolution Lectures 1
2 POPULATION GENETICS The study of the rules governing the maintenance and transmission of genetic variation in natural populations.
3 Population: A freely interbreeding group of individuals. Gene Pool: The sum total of genetic information present in a population at any given point in time. Phenotype: A morphological, physiological, biochemical, or behavioral characteristic of an individual organism. Genotype: The genetic constitution of an individual organism. Locus: A site on a chromosome, or the gene that occupies the site. Gene: A nucleic acid sequence that encodes a product with a distinct function in the organism. Allele: A particular form of a gene. Some Definitions Gene (Allele) Frequency: The relative proportion of a particular allele at a single locus in a population (a number between 0 and 1). Genotype Frequency: The relative proportion of a particular genotype in a population (a number between 0 and 1).

4 Genotype vs. Allele frequency
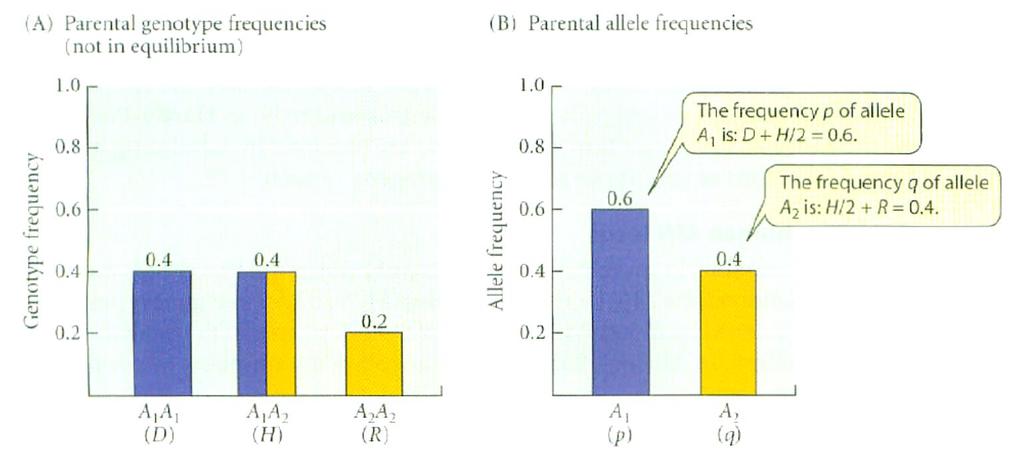
5 Calculation of allele frequency Lets assume: In a population 400 people have the genotype TT, 400 have Tt and 200 have tt So they have 2000 allele total Of these 1200 are T and 800 are t If frequency of T is p, then p=0.60 If frequency of t is q, then q=0.40
6 Calculation of allele frequency By counting T = 800 in TT in Tt = 1200/2000 = 0.60 t = 400 in Tt in tt = 800/2000 = 0.40 Or frequency of an allele=frequency of homozygote for that allele + ½ frequency of heterozygote Using genotype frequency T= 0.40 TT + ½ (0.40 Tt) = = 0.60 t= 0.20 tt + ½ (0.40 Tt) = = 0.40
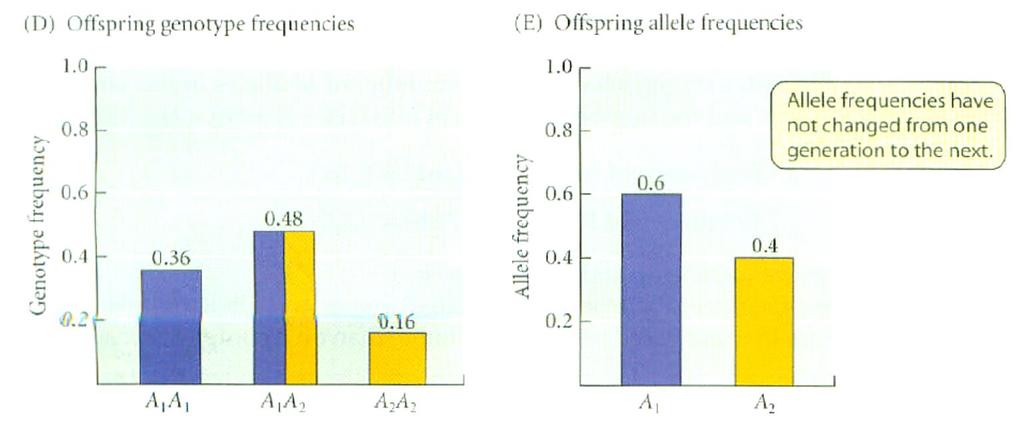
7 Conservation of allele frequency TT=0.40 Tt=0.40 tt=0.20 TT= Tt= tt= In F1; TT=0.36, Tt=0.48; tt=0.16 But; T=0.60 and t=0.40
8 Conservation of allele frequency
9 Calculation of allele frequency In F1; TT=0.36, Tt=0.48; tt=0.16 And T=0.60 and t=0.40 Also if p=t and q=t Then p 2 =0.36, q 2 =0.16 and 2pq=0.48
10 The Hardy-Weinberg Equilibrium A single generation of random mating establishes H- W equilibrium genotype frequencies, and neither these frequencies nor the gene frequencies will change in subsequent generations. p 2 + 2pq + q 2 = 1
11 Hardy-Weinberg assumptions Mating is random (with respect to the locus). The population is infinitely large. Genes are not added from outside the population (no gene flow or migration). Genes do not change from one allelic state to another (no mutation). All individuals have equal probabilities of survival and reproduction (no selection).
12 Implications of the Hardy-Weinberg equilibrium A random mating population with no external forces acting on it will reach the equilibrium H- W frequencies in a single generation, and these frequencies remain constant there after. Any perturbation of the gene frequencies leads to a new equilibrium after random mating. The amount of heterozygosity is maximized when the gene frequencies are intermediate. 2pq has a maximum value of 0.5 when p = q = 0.5

13 Genotype frequency distribution
14 Factors changing equilibrium Inbreeding
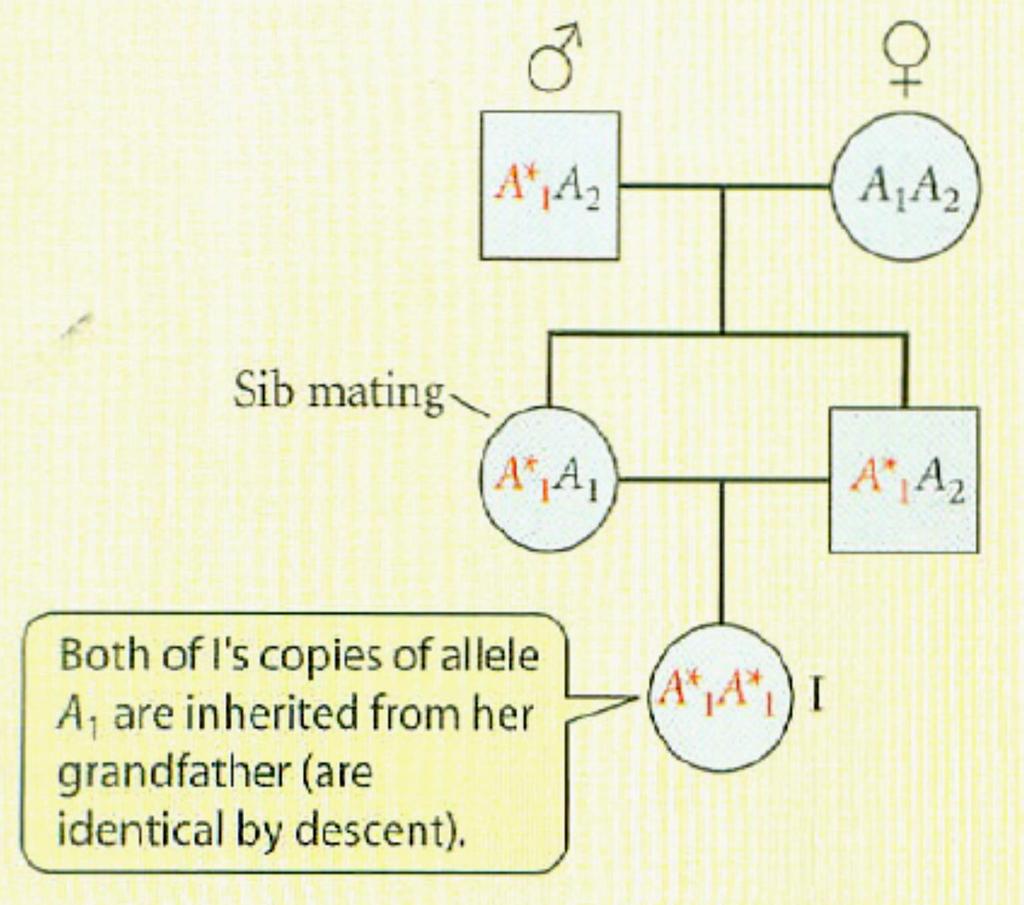
15 Example
16 Calculations Definition first Autozygous: individuals homozygous with the identical allele by descent Allozygous: either heterozygous or homozygous individuals with non-identical allele Inbreeding coefficient (F) is the probability of an individual taken at random from a population will be autozygous In a randomly mating population F=0 and in an all inbreed population F=1
17 Calculations In a population with some inbreeding 1-F is the allozygous frequency if F is autozygous frequency Allozygous Autozygous Genotype frequency A 1 A 1 p 2 (1-F) +pf =p 2 +Fpq A 1 A 2 2pq(1-F) 2pq(1-F) A 2 A 2 q 2 (1-F) +qf =q 2 +Fpq

18 In a graph Find: How to calculate inbreeding frequency in a population?
19 Factors changing equilibrium Genetic drift
20 GENETIC DRIFT Alteration of gene frequencies due to chance (stochastic) effects. Most important in small populations. Tends to reduce genetic variation as the result of extinction of alleles. Generally does not produce a fit between organism and environment; can, in fact, result in nonadaptive or maladaptive changes.
21 How does it work? Calculated by standard deviation σ= pq/n (p is the frequency of one allele, q is another; N is the number of genes sampled) For diploid population σ= pq/2n If we start p=q=0.5 and N= Then σ=.001 That is the frequency of either p or q will vary 0.5±0.001 This is genetic drift and is greater in smaller population
22 Example Laboratory expt by Buri (1956) Set up 107 separate D. melanogaster lines, each with two brown alleles bw and bw 75 Started each generation with 16 parents (8 males and 8 females, random selection) Therefore each generation started with 16X2=32 gene copies Continued for 19 generations See the changes in the allele frequency in the first generation At 19 th 30 populations lost all bw 75 allele and 28 have been fixed. Remember: No selection pressure
23 How does it work? If we start p=q=0.5 and N=214 Then σ=.034 That is the frequency of either p or q will vary 0.5±0.03 This is just one generation In the next at one end 0.47±0.03 and at the other 0.53±0.04 Do the calculations for few more generations This is what is called Founder s Effect

24 Example Argentine ant (Linepithema humile) Introduced in California accidentally Highly aggressive in Argentina, between colonies Each colony has different odor But they form super colony in California Small group brought had same colony odor
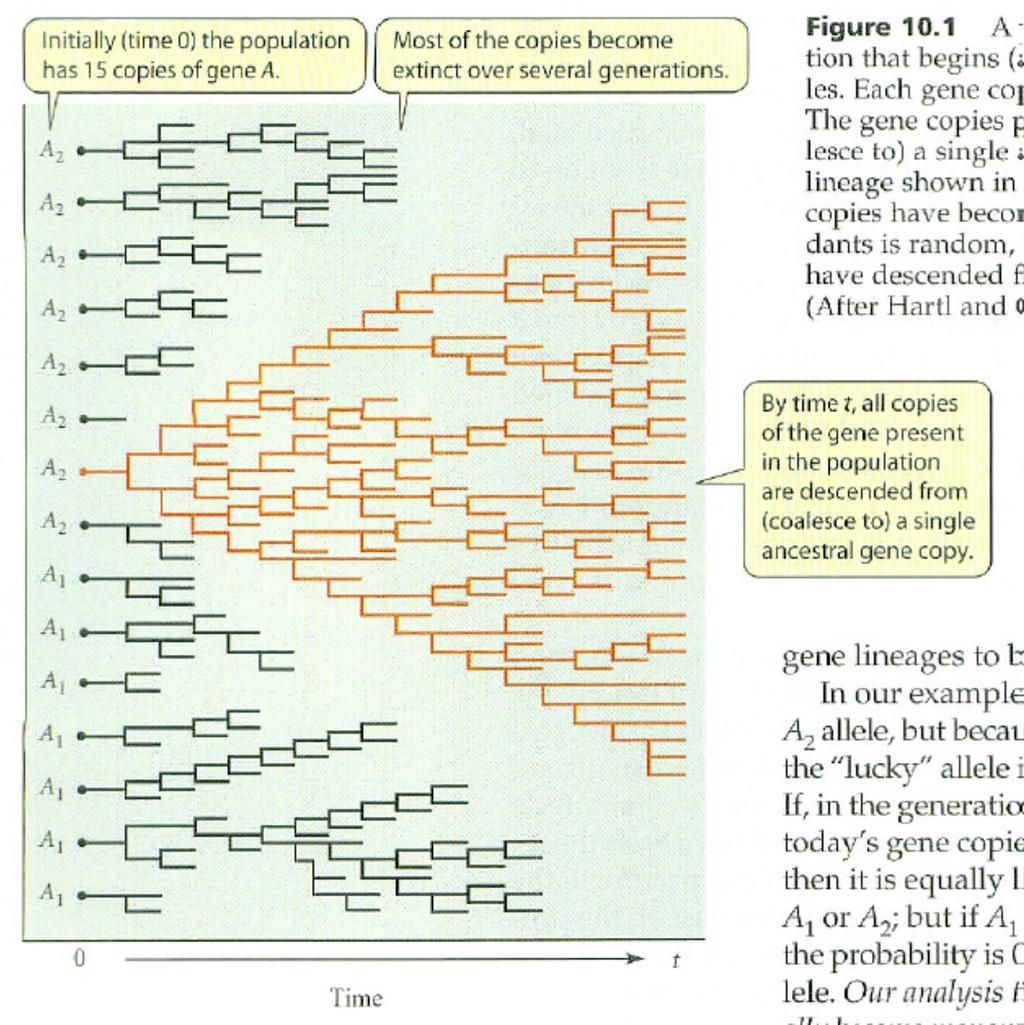
25 Coalescence