BST227 Introduction to Statistical Genetics. Lecture 3: Introduction to population genetics
|
|
|
- Lucy Lawson
- 5 years ago
- Views:
Transcription

1 BST227 Introduction to Statistical Genetics Lecture 3: Introduction to population genetics!1
2 Housekeeping HW1 will be posted on course website tonight 1st lab will be on Wednesday TA office hours have been posted on the class website Tuesday, 4:00 PM- 5:00 PM, Building 2, Room 434 (Kushal) Wednesday, 2:00-3:00 PM, Building 2, Room 428 (Michele)
3 Genetic distance Centimorgan: the distance between chromosome positions for which the expected average number of intervening chromosomal crossovers in a single generation is Historically used to infer distance between markers Approximately 1Mb!3
4 The average effect of a double crossover is to give 50% recombinants. Human Molecular Genetics. 2nd edition., Strachan T, Read AP., New York: Wiley-Liss;
5 Gene length 2000 Count ,000 1,000,000 Gene length (bp)!5
6 What have we studied Background Structure of Human Genome DNA Variants and disease Mendelian Inheritance Mendel s first law Mendel s second law Mode of inheritance Genetic models for mendelian and complex disease 2
7 Overview of Today s Material Population Genetics Concepts: Estimation and Inference About Allele Frequencies Hardy Weinberg Equilibrium Population Substructure Measuring Genetic Contribution to Traits Recurrence Risk Ratios Heritability 3
8 Allele Frequencies Definition: Allele frequency = proportion of chromosomes in population carrying the allele of interest. (e.g. a disease allele) Allele frequencies are compared in association studies to detect disease genes Allele frequencies tell us about the probability of observed genotypes 4
9 From genotypes to allele frequencies 5
10 Inter-generational allele transmission Recall Mendel s first law: Offspring inherit one allele from each parent. Parents transmit alleles independently of each other, and within a parent, transmission is random and with equal probability for each allele. Assume random mating
11 Inter-generational allele transmission pa = 0.5 Parents: Gametes: AA Aa Aa aa A A A a A a a a Probability a parent passes on A = pa
12 Inter-generational allele transmission pa = 0.5 Parents: Gametes: AA AA aa aa A A A A a a a a Probability a parent passes on A = pa
13 Inter-generational allele transmission Estimate offspring genotypes from parental allele frequencies Example: p=0.8, q=0.2 p 2 =0.64 Mother A a pq=0.16 A 0.8 AA Aa Father a 0.2 pq=0.16 Aa q 2 =0.04 aa
14 Inter-generational allele transmission What are the allele frequencies (p*) in the next generation? AA Aa aa p 2 2pq q p* = (2p 2 + 2pq) / 2 = p 2 + pq = p (p+q) = p Allele frequencies remain constant


15 Hardy Weinberg Equilibrium (HWE) Theorem: Allele frequencies in a population remain constant if no evolutionary forces exist. Requirements for Hardy-Weinberg equilibrium: Large population Random mating No mutation No migration No selection Departures from HW equilibrium provide a mechanism to study evolution 6


16 Hardy Weinberg Equilibrium (HWE) Rule: If you know allele frequency, use HWE to calculate genotype probabilities. Johnuniq wiki/file:hardy-weinberg.svg 6
17 Inter-generational genotype transmission Parental population in HWE Assume random mating p = 0.5 AA Aa aa p 2 2pq q What are the genotype frequencies in the next generation? p 2 2pq q Unchanged: In HWE
18 Inter-generational genotype transmission Parental population not in HWE Assume random mating p = 0.5 AA Aa aa What are the genotype frequencies in the next generation? p pq 0.5 q In HWE
19 Implications of HWE Suppose population is in HWE, then it will remain in HWE after a round of random mating. Suppose population is not in HWE, then it will get in HWE after one round of random mating. The allele frequency does not change from one generation to the next. 9
20 When is HWE is useful? The failure of HWE can reveal a lot about sample features: - Selection of subjects related to genotype - Population Substructure - Genotyping errors
21 How to Detect Failure of HWE: Testing for HWE in a Sample Estimate allele frequencies from genotypes Compute expected genotype frequencies assuming HWE holds Use Pearson Chi-Square test 10
22 Hardy-Weinberg Equilibrium (HWE) Test for HWE based on Pearson chi-square test: Genotype AA Aa aa Observed n AA n Aa n aa n Expected np 2 2np(1-p) n(1-p) 2 n Estimate p as (2nAA + naa) / 2n The Chi Square Test has 1 degree of freedom. (Why?) 11
23 Population Substructure: Stratification / Admixture / Inbreeding Population stratification: distinct subgroups within a population. Population admixture: mating among individuals of different genetic origin over multiple generations. Usually occult. Inbreeding: mating between close relatives 17
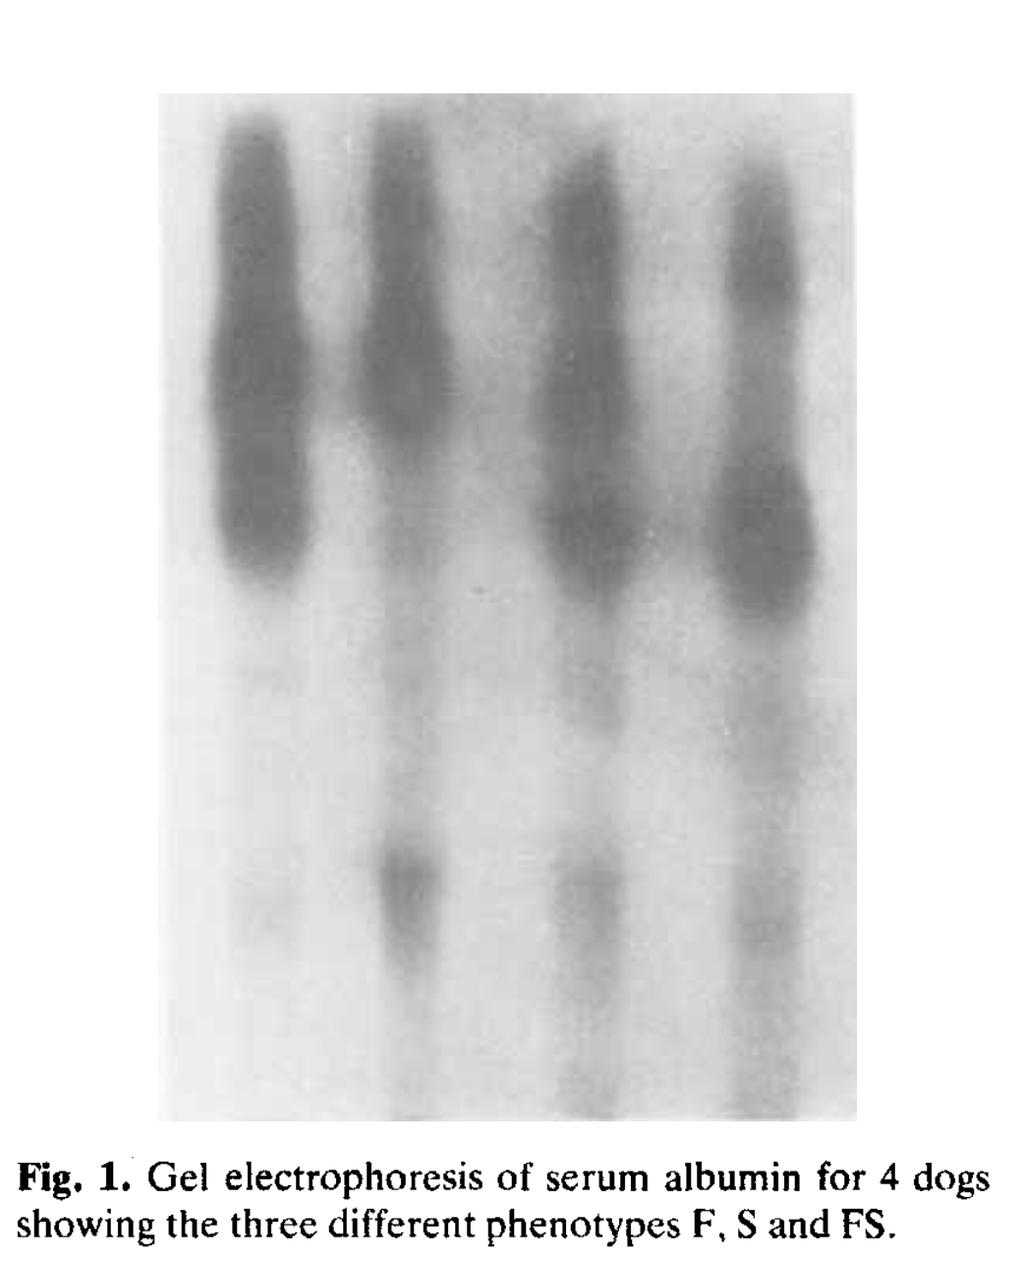
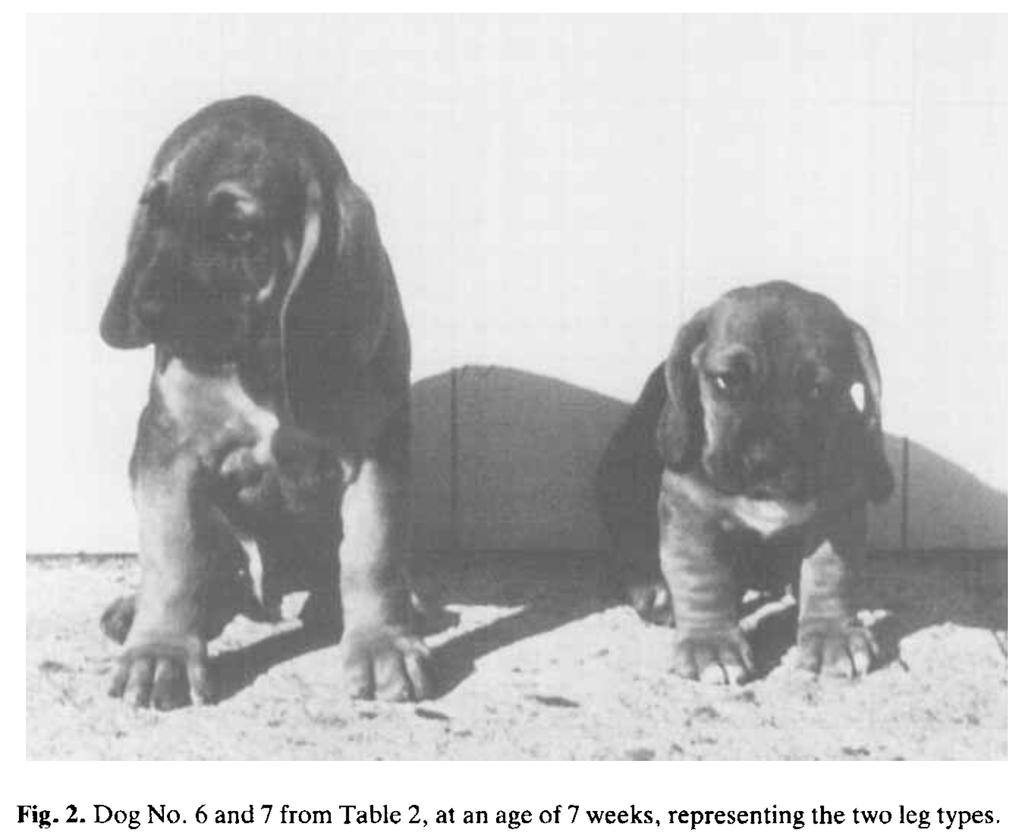
24 Stratification Leg length Albumin genotypes FS SS FS FF
25 Stratification 18
26 <latexit sha1_base64="usww9wnujun8xruqfveg65g1zda=">aaacxnicbzfbs8mwgibtqnnuzlw9ebwjdmeijnyieimmxekdk7kd7esapvtyeibjhvh6j70tb/wpzic2nz8iphzfe5k8cujghttnl03f2d1l7acpmtnd3fheod5picdimnrxwalecpagjpqklqlkpbvygjyhkayzfpromx+ecxr473iskq6hhj51kuzstfpg1mej2ivdb9hxocjx8buf12ojvihpm7jqlzn4jgm8xpfspwsvjhtdspesvziujn2jyjbmwcftsbzqaiuq9o3pzidakud8irksom2zoezgieukgukynuiqeoexgpk2qh95rhtjwtwjvfsdaxqdrpyv4ay7vingnhatz1gmh+ribm6mzf9m7ui6992y+mekiy/nb7krgzka06zhghkcjzsoqjhtdveir0ifi9wpzfqi1uatt6frlllmyxq7lvqef3gkwtm4aevggttqas+gcuoag29n0zjavvvru3poz89vxvvsoqv/sj/7bbxosvq=</latexit> <latexit sha1_base64="usww9wnujun8xruqfveg65g1zda=">aaacxnicbzfbs8mwgibtqnnuzlw9ebwjdmeijnyieimmxekdk7kd7esapvtyeibjhvh6j70tb/wpzic2nz8iphzfe5k8cujghttnl03f2d1l7acpmtnd3fheod5picdimnrxwalecpagjpqklqlkpbvygjyhkayzfpromx+ecxr473iskq6hhj51kuzstfpg1mej2ivdb9hxocjx8buf12ojvihpm7jqlzn4jgm8xpfspwsvjhtdspesvziujn2jyjbmwcftsbzqaiuq9o3pzidakud8irksom2zoezgieukgukynuiqeoexgpk2qh95rhtjwtwjvfsdaxqdrpyv4ay7vingnhatz1gmh+ribm6mzf9m7ui6992y+mekiy/nb7krgzka06zhghkcjzsoqjhtdveir0ifi9wpzfqi1uatt6frlllmyxq7lvqef3gkwtm4aevggttqas+gcuoag29n0zjavvvru3poz89vxvvsoqv/sj/7bbxosvq=</latexit> <latexit sha1_base64="usww9wnujun8xruqfveg65g1zda=">aaacxnicbzfbs8mwgibtqnnuzlw9ebwjdmeijnyieimmxekdk7kd7esapvtyeibjhvh6j70tb/wpzic2nz8iphzfe5k8cujghttnl03f2d1l7acpmtnd3fheod5picdimnrxwalecpagjpqklqlkpbvygjyhkayzfpromx+ecxr473iskq6hhj51kuzstfpg1mej2ivdb9hxocjx8buf12ojvihpm7jqlzn4jgm8xpfspwsvjhtdspesvziujn2jyjbmwcftsbzqaiuq9o3pzidakud8irksom2zoezgieukgukynuiqeoexgpk2qh95rhtjwtwjvfsdaxqdrpyv4ay7vingnhatz1gmh+ribm6mzf9m7ui6992y+mekiy/nb7krgzka06zhghkcjzsoqjhtdveir0ifi9wpzfqi1uatt6frlllmyxq7lvqef3gkwtm4aevggttqas+gcuoag29n0zjavvvru3poz89vxvvsoqv/sj/7bbxosvq=</latexit> <latexit sha1_base64="usww9wnujun8xruqfveg65g1zda=">aaacxnicbzfbs8mwgibtqnnuzlw9ebwjdmeijnyieimmxekdk7kd7esapvtyeibjhvh6j70tb/wpzic2nz8iphzfe5k8cujghttnl03f2d1l7acpmtnd3fheod5picdimnrxwalecpagjpqklqlkpbvygjyhkayzfpromx+ecxr473iskq6hhj51kuzstfpg1mej2ivdb9hxocjx8buf12ojvihpm7jqlzn4jgm8xpfspwsvjhtdspesvziujn2jyjbmwcftsbzqaiuq9o3pzidakud8irksom2zoezgieukgukynuiqeoexgpk2qh95rhtjwtwjvfsdaxqdrpyv4ay7vingnhatz1gmh+ribm6mzf9m7ui6992y+mekiy/nb7krgzka06zhghkcjzsoqjhtdveir0ifi9wpzfqi1uatt6frlllmyxq7lvqef3gkwtm4aevggttqas+gcuoag29n0zjavvvru3poz89vxvvsoqv/sj/7bbxosvq=</latexit> Dog Breeds and the Albumin Alleles Test for HWE within breed: Genotype SS SF FF Observed Expected = (O SS E SS ) 2 E SS + (O SF E SF ) 2 E SF + (O FF E FF ) 2 E FF (1 df) p-value = In HWE
27 Dog Breeds and the Albumin Alleles Test for HWE using entire population: Genotype SS SF FF Observed Expected Highly significant: p-value < 1e-10 19
28 New Topic: How do we measure extent to which a trait is genetic? Two primary measures: Recurrence Risk Ratios (dichotomous traits) Heritability (quantitative traits) 26
29 Recurrence Risk Ratio Definitions: Proband: Subject selected into sample because of disease status. P(disease) = K Relative of type R (parent, sib, etc) Recurrence risk ratio defined for dichotomous disease trait as λ R = P(relative of type R diseased proband diseased) P(disease) If the disease has a genetic basis, what should λ R be? How should λ R vary with R? If disease is NOT genetic, what should λ R be?

30 Bio 227 lecture 3 28
31 How do we use λ R? Justifies doing a genetic study of the disease λ R was the basis for power calculations for many types of linkage analysis Compare estimated λ R to different genetic models We will look at how λ R is calculated in simple Mendelian models 29
32 Notation Disease Phenotype: Y (Y=1 is affected; Y=0 is unaffected) Genotype at Disease Locus: X=0,1,2 (dd,dd,dd) f x = P (Y =1 X = x) Penetrance functions: R: Denotes a relative of the proband p: Frequency of D allele p(x) frequency of genotypes, p(dd, Dd or dd genotype) Hardy Weinberg Equilibrium (HWE): p(dd) = (1-p) 2 p(dd) = 2p(1-p) p(dd) = p 2
33 Reminder: λ R = P(relative of type R diseased proband diseased) P(disease) For Simple Mendelian Models: P(disease) depends only on genotype at a single locus, no other factors influence disease Denominator: K = P (disease) = f 0 (1 p) 2 + f 1 2p(1 p)+f 2 p 2 Assumes penetrance functions, allele frequency, HWE
34 What does λ R depend on? What about the numerator? P(relative of type R diseased proband diseased) = P(both diseased)/k λ R = P(both diseased)/k 2 What does P(both diseased) depend on?
35 Calculating λ R Depends on degree of relationship R, penetrance functions and Mendel s Laws Example: Consider the sibling recurrence risk ratio and a recessive Mendelian model: Show that λ S = [(1+p)/2p] 2 Step 1: Calculate K Step 2: Calculate p(both sibs have disease) Step 3: Calculate λ S
36 Denominator: K 2 =? Numerator: Calculating λ S Values in table represent probability of an affected child 33
37 Recurrence Risk Ratio Recurrence risk to relatives of type R: How to calculate? 1) Assume a specific genetic model (e.g. single gene, dominant) 2) Assume a frequency for the disease allele p 3) Assume 3 penetrance functions: f 0,f 1,f 2 4) Simple to compute K=P(disease in population) 5) Assume random mating and HWE to get all possible genotypes for common ancestors 6) Use Mendel s Laws to get offspring genotypes phenotypes and to compute P(both relatives affected) 7) Easiest when use Parent-Offspring or Sibling for R, and deterministic Mendelian models
38 Heritability Originally defined for continuous traits; can be adapted to dichotomous disease traits Heritability is defined as percent of total trait variance explained by genes Requires a very specific genetic model explaining how genes affect outcome Can be estimated using relative data or case/control GWAS data 36