Inferring Gene-Gene Interactions and Functional Modules Beyond Standard Models
|
|
|
- Primrose Leonard
- 5 years ago
- Views:
Transcription
1 Inferring Gene-Gene Interactions and Functional Modules Beyond Standard Models Haiyan Huang Department of Statistics, UC Berkeley Feb 7, 2018
2 Background

3 Background High dimensionality (p >> n) often results in a high rate of false positives, severely limiting a genomic scale network exploration. Measures based on pairwise marginal relationships are often inappropriate for detecting higher level interactions. A gene may interact with a group of genes despite having weak marginal correlations with the individual genes. Partial correlation takes the influence of other genes into account, e.g., Gaussian Graphical Models (GGM). Inclusion of non-pathway genes in the conditional set can lead to spurious dependencies. Seed genes (Kim et. al. (2012)), i.e. known pathway genes are useful to define an appropriate conditional set, but they are not always available. Under GGM, the elements in the precision matrix are proportional to partial correlations, i.e., correlation between two genes conditioned on the rest genes.
4 Problem Formulation Our formulation was motivated by considering GGM in a linear regression setting: The partial correlation between gene i and gene j conditioned on a set of genes Z is simply the correlation cor(ε1,ε2) of the residuals ε1 and ε2 resulting from linearly regressing gene i and gene j against the genes in Z, respectively. For instance, assume that genes A, B and C are interacting as a group, and that G A = β A G C + ε1 and G B = β B G C + ε2, where G A, G B, G C denote the expression profile for genes A, B and C, respectively. If cor(ε1,ε2) 1, then G A + Γ B G B + Γ C G C + Γ 0
5 Problem Formulation Our formulation was motivated by considering GGM in a linear regression setting: The partial correlation between gene i and gene j conditioned on a set of genes Z is simply the correlation cor(ε1,ε2) of the residuals ε1 and ε2 resulting from linearly regressing gene i and gene j against the genes in Z, respectively. Therefore, under a GGM, it is reasonable to assume that functionally related genes form strong linear relationships, with one linear equation for one gene module (a set of functionally related genes), suggesting a new formulation for finding gene modules: Finding strong linear models that involve a very small set of genes among the thousands of candidate genes.
6 An attempted solution To find strong linear models that involve a very small set of genes among the thousands of candidate genes, we introduce a procedure based on a novel application of sparse canonical correlation analysis (SCCA) to the gene expression data matrix.
7 Sparse Canonical Correlation Analysis (SCCA)


8 SCCA with random partition and subsampling
9 Summary of Procedure 1. SCCA implemented by a modified NIPALS algorithm involving iterative penalized regression with L1 penalty. 2. If some genes are known to operate in the same pathway, the penalty parameter corresponding to those genes could be lowered.
10 Subsampling helps the identification of weaker functional group We simulated the expressions of 20 genes. 6 of them form two disjoint functional gene groups. One group has 3 genes that are perfectly linearly related (see (a)). The other group has 3 genes that have relatively weaker linear relationships (see (b). The left 14 genes are independent from each other.
11 Subsampling helps the identification of overlapping functional groups We simulated the expressions of 150 genes. There are two overlapping functional gene groups, with each functional group having 15 genes and 5 genes in common.
12 Choose the amount of regularization
13 The entropy of an edge weight matrix Ā is defined as
14 Identify community structures in Ā
15 Performance comparison for simulated data
16 Table: Classification performance of different methods using datasets with p = 500, two functional groups, subsampling level 70%, and various levels (0%, 33% and 67%) of experiment dependency.
17 Arabidopsis data
18


19 Results using module.dynamic and module.hybrid 13 groups in total with sizes from 60 to groups in total with sizes from 5 to 81
20 Conclusion on the SCCA method High precision More conceptually appealing. Under a regression setting, it captures group interactions by providing an aggregated measure of gene partial correlations when the correct conditional set is unknown Flexible enough to incorporate prior knowledge when available
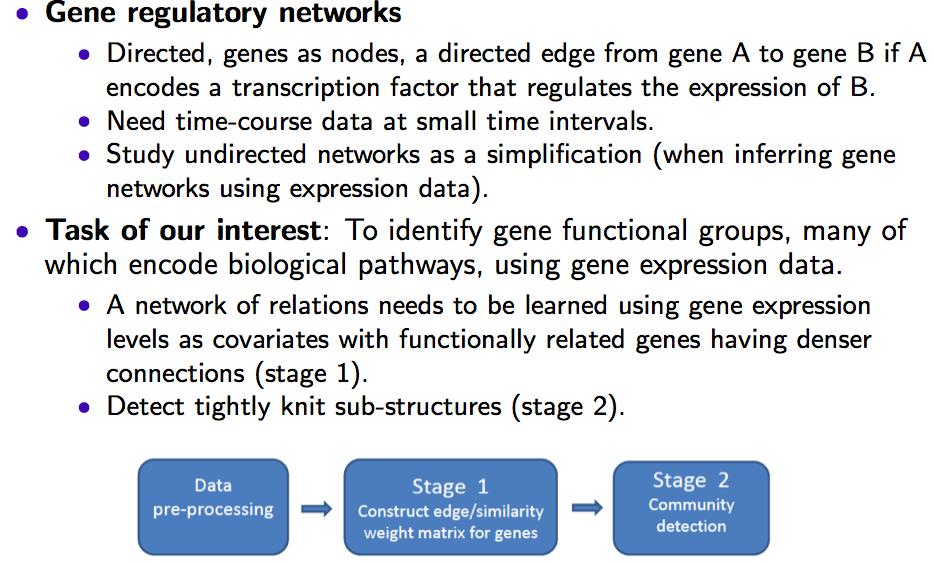
21 Gene-Fishing: A semi-supervised, non-parametric clustering procedure with bagging
22 Background Biomedical questions of interest 1. Identifying novel cholesterol-metabolism regulators that may contribute (or be related) to cardiovascular disease risk. 2. Characterizing the diversity of cholesterol metabolism across different tissues. 3. Understanding mechanisms underlying adverse effects of statin treatment. Datasets: 1. CAP LCLs Dataset (n=426): RNA-seq and expression array of subject-derived lymphoblastoid cell lines (LCLs) were established from CAP subjects; demographic information and plasma LDLC are also available. 2. GEUVADIS Dataset (n=465; publicly available): the transcriptome of 465 LCL samples (from the 1000 Genome Project) were deeply sequenced on Illumina HiSeq GTex Dataset (publicly available): 7051 samples for 43 different tissues were collected for RNA-Seq analysis.
 cholesterol metabolism associated genes Visualization of genegene correlation")
23 Our Initial Analysis: 21 genes Spectral analysis of all genes (Cap LCL expression dataset) Spectral analysis of 80 (GO-annotated) cholesterol metabolism associated genes Visualization of genegene correlation matrix

24 Interesting patterns become hidden as noise increases N=1000 N=80 N=3000 N=5000 N=8000 N=10000 The 21 cholesterol synthetic pathway genes Random genes


25 Workflow of gene fishing Reducing search space Making search better focused Aggregating clustering results from different rounds to make the discovery robust A ranked gene list Repeat for 1000 times Gene name Capture Frequency Rate G 1 CFR 1 G 2 CFR 2 G n CFR n
26 Comparison of Reproducibility between the CAP LCL dataset and the GEUVADIS dataset Gene Fishing Guilt-By-Association (median) Guilt-By-Association (mean) Guilt-By-Association (max) WGCNA

27 Application to GTex dataset
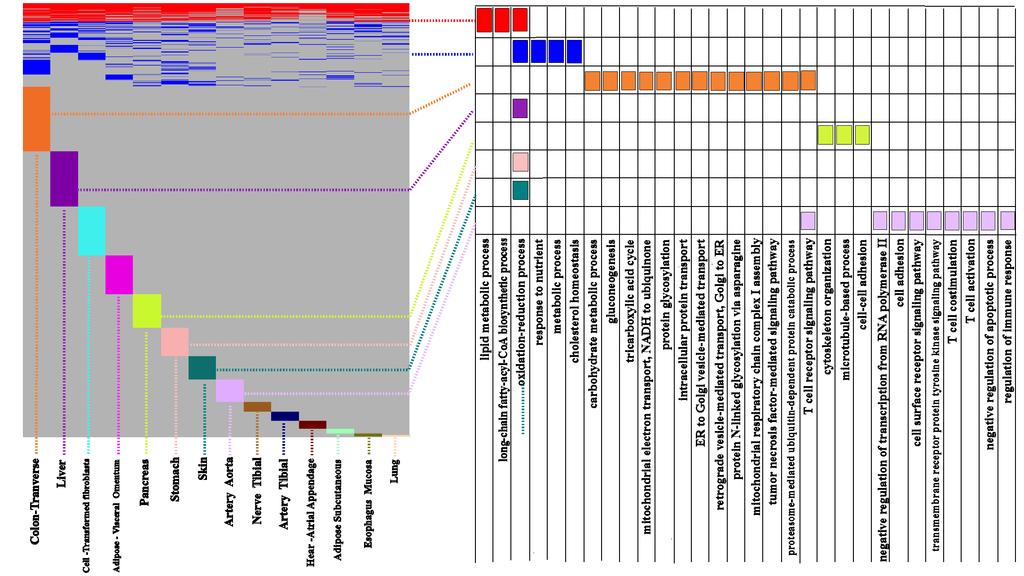
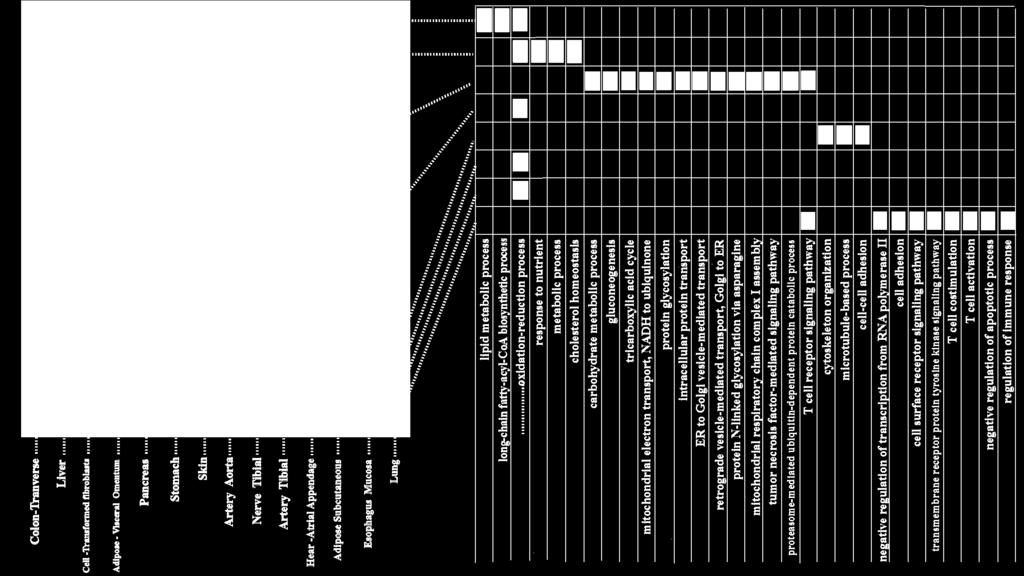
28 Application to GTex dataset

29 Acknowledgements