EPIB 668 Introduction to linkage analysis. Aurélie LABBE - Winter 2011
|
|
|
- Nickolas Lawson
- 5 years ago
- Views:
Transcription
1 EPIB 668 Introduction to linkage analysis Aurélie LABBE - Winter / 49
2 OUTLINE Meiosis and recombination Linkage: basic idea Linkage between 2 locis Model based linkage analysis (parametric) Example of a model based analysis: schizophrenia and bipolar disorder Model free linkage analysis (non parametric) Example of a model free linkage analysis: leprosy 2 / 49
3 MEIOSIS AND RECOMBINATION 3 / 49
4 Transmission of genetic information Meiosis: a special type of cell division that happens in reproductive tissue yielding haploid cells (which have one of each chromosome) called gametes. In females, the gametes are the egg cells and in males the gametes are the sperm cells. The combination of 2 gametes (egg+sperm cells) produce a diploid cell (23 pairs of chromosomes) 4 / 49

5 Meiosis 5 / 49
6 Meiosis 6 / 49
7 Genetic diversity Independent assortment of homologous chromosomes: 2 23 possibilities Cross-over: frequency and localization is random Fecondation: 4 types of egg cells and 4 types of sperm cells: 16 possibilities Probability of two individuals to be identical: < 1/64 billions! 7 / 49
8 PRINCIPLES OF LINKAGE ANALYSIS 8 / 49
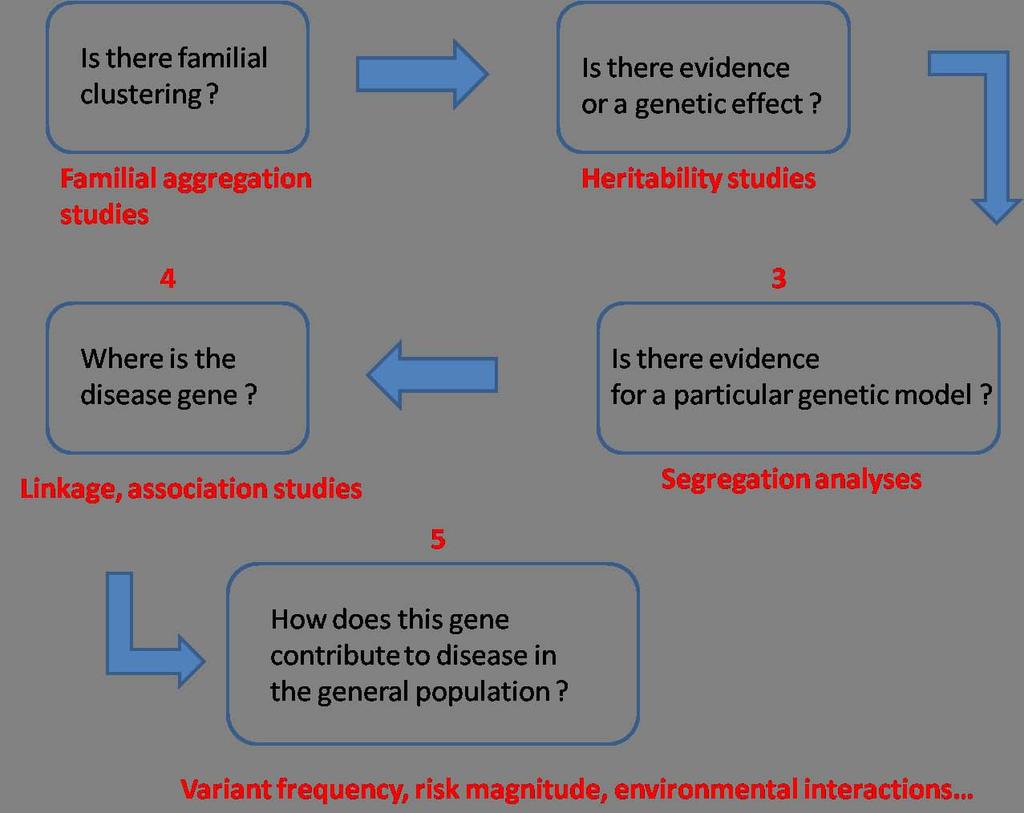
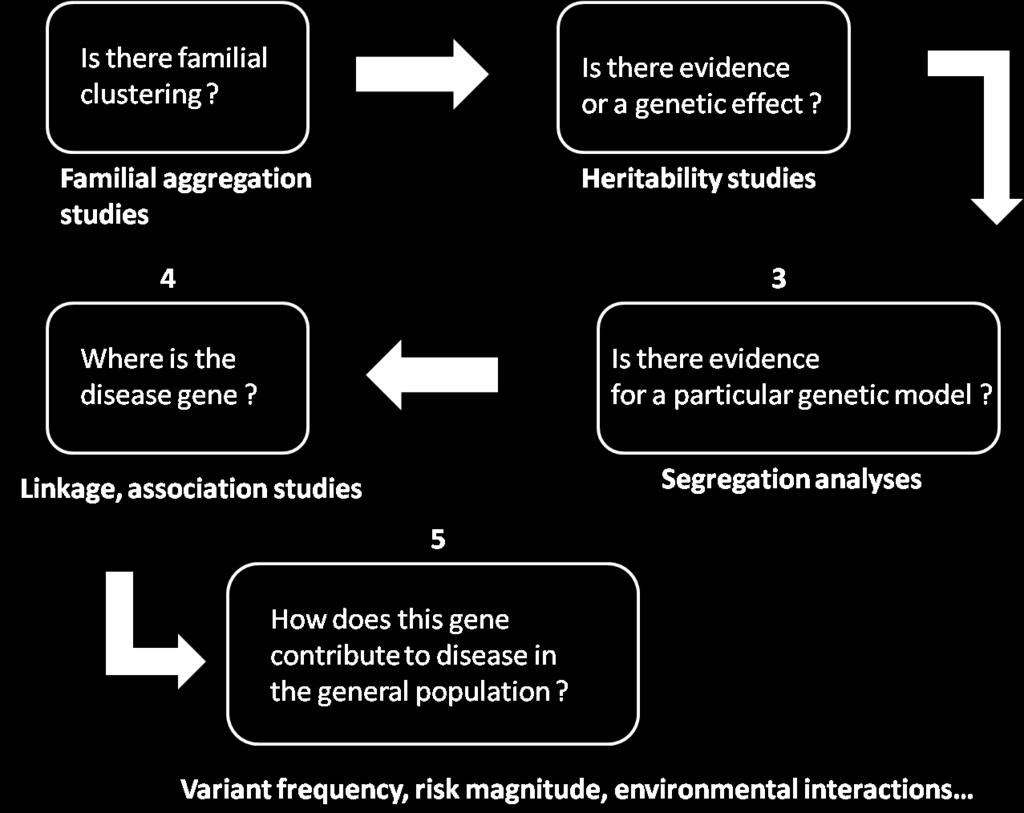
9 Genetic epidemiology questions 9 / 49

 10")
10 Linkage analysis: objective Localise the disease gene with respect to genetic markers Note Coarse mapping (> 1cM) 10 / 49
11 Ingredients Families (pedigrees) ascertained using an affected proband For each subject in family: Affection status (yes/no) Genotypes at a set of markers (usually microsatellites) 11 / 49

12 Recall: recombination 12 / 49


 and markers whose locations")
13 Linkage: basic idea If the disease gene is close to the marker M, recombination will occur with a small probability. Linkage analysis If the disease gene is far from marker M, recombination will occur with high probability. Linkage analysis searches for non random segregation between the disease locus (to be located) and markers whose locations are already known. 13 / 49
14 LINKAGE BETWEEN TWO LOCI 14 / 49
15 Morgan s fruit flies experiment (1913) Two recessive traits studied: eye color and wing length Eye color: red or purple Normal allele is R (red), mutant allele is r (purple) Red eyes have genotypes RR or rr Purple eyes have genotypes rr Wing length: normal or vestigial Normal allele is V (normal), mutant allele is v (vestigial) Normal wings have genotypes VV or vv Vestigial wings have genotypes vv 15 / 49
16 Morgan s fruit flies experiment (1913) Generation F 1 : R r r r V v v v (Color) Red Purple (Wings) Normal Vestigial Parental Recomb. Recomb. Parental Generation F 2 R r R r r r r r V v v v V v v v Number of flies F 2 obtained (Color) Red Red Purple Purple (Wings) Normal vestigial Normal Vestigial 16 / 49
17 Morgan s fruit flies experiment (1913) If segregation at the eye color gene was independent of the wing size gene, we should obtain the four possible phenotypes with probabilities 1/4. Clearly the results obtained show an important deviation from these 1/4 ratios Recombinant phenotypes seem to be really under-represented We deduce that a recombination event between the two genes is rare We conclude that the two genes are linked 17 / 49
18 MODEL BASED LINKAGE ANALYSIS (PARAMETRIC LINKAGE) 18 / 49
19 Set up A set of families, usually ascertained for the disease Genotypes are available for the family members for a set of genetic markers (sparse) Phenotype = disease status of the family members (affected or not) 19 / 49
20 Model based linkage Model based linkage estimates the recombination rate θ between the causal locus (to be located) and the marker locus (known location) Definition: Recombination rate Frequency of recombination between two loci, in a given meiosis. θ varies from 0 (complete linkage) to 1/2 (independence) Genetic linkage tests if θ = 1/2 Compute the LOD score If LOD = z, this means that genetic linkage is 10 z times more likely than independence Usually, LOD > 3 corresponds to significant linkage 20 / 49
21 Model based linkage: ingredients To estimate the recombination rate, one needs to specify: Allelic frequency of the predisposing allele (usually, assume a single gene with 2 alleles) Penetrances (probability of being affected given the genotype): genotype-phenotype relation These items can be estimated at the segregation analysis step. 21 / 49

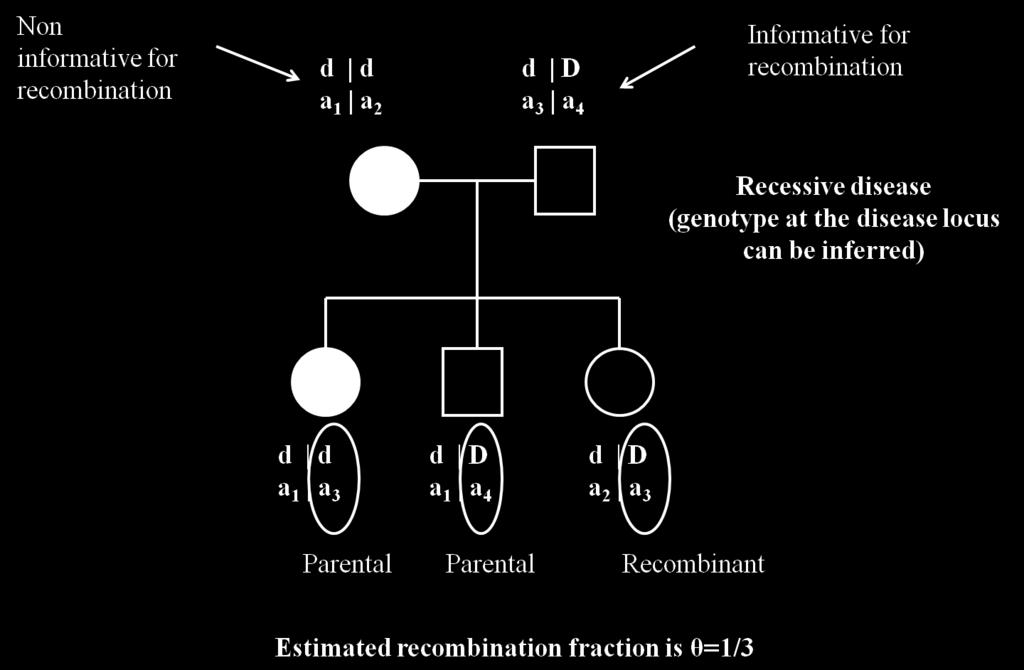
22 A simple example 22 / 49
23 Model based linkage: issues If penetrance at the disease gene is not complete (recessive or dominant), the genotype at the disease locus is not known The phase of the genotypes is unknown for individuals who are homozygous at the marker or disease locus. The underlying statistical model and algorithm for LOD score computation is very complex. 23 / 49
24 Model based linkage: recap Uses phenotypic and genotypic information of all individuals Provides an estimate of the recombination fraction Is the more powerful approach for gene mapping... IF THE MODEL IS CORRECT!!! (allele frequency at the disease locus and penetrance values) 24 / 49
25 EXAMPLE OF A MODEL BASED LINKAGE ANALYSIS: SCHIZOPHRENIA AND BIPOLAR DISORDER 25 / 49

26 Example 26 / 49
27 SZ and BP Schizophrenia (SZ) and Bipolar disorder (BP) are complex and highly heritable disorders SZ is characterized by a disintegration of the process of thinking and of emotional responsiveness SZ: prevalence is about 1% BP (or manic depression) is characterized by the presence of one or more episodes of abnormally elevated energy levels, cognition, and mood with or without one or more depressive episodes. BP: prevalence is about 3-5% 27 / 49
28 Study design Dense genome scan in a sample of 21 multigenerational families of Eastern Quebec affected by SZ, BP or both (480 family members). 350 microsatellite markers spaced by 10cM 257 others were follow-up markers in positive regions at the 10cM scan. 28 / 49
29 Example of a family / 49
30 Results 30 / 49
31 Results by family 31 / 49
32 MODEL FREE LINKAGE ANALYSIS (NON PARAMETRIC LINKAGE) 32 / 49


33 Model free linkage analysis 33 / 49
34 Principle If two family members display phenotypic similarity (e.g: both affected)... Do they also display similarity at the marker locus? If so, the marker and disease loci may be linked... Note: similarity at the marker locus is a function of the familial relatedness 34 / 49
35 Similarity at the marker locus - IBD IBD = Identical By Descent IBD is the tool we use to measure the similarity at the marker locus between two family members. Definition IBD refers to the number of marker alleles inherited from a common ancestor IBD refers to the number of alleles shared identical by descent 35 / 49

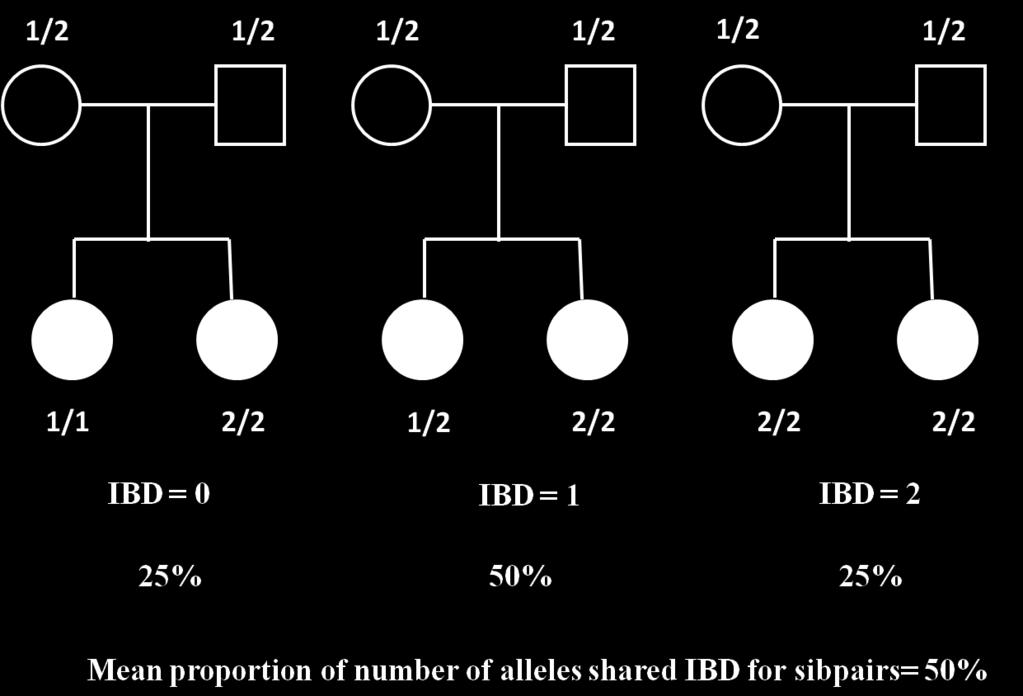
36 IBD 36 / 49
37 Model free linkage: setup Sample of N affected sets of relatives (usually sib pairs) Compute IBD at the marker of interest Compare observed versus expected IBD distribution Compute a p-value or LOD score 37 / 49

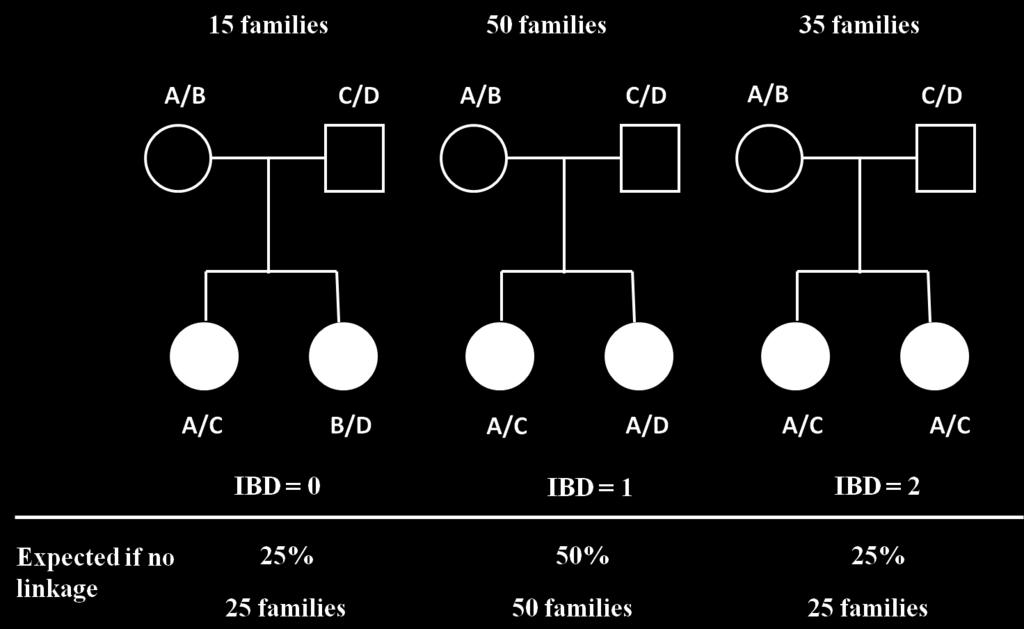
38 A simple example 38 / 49


39 But life is not always as simple... In practice, we have missing or ambiguous data Statistical models for model free linkage are also very complex. 39 / 49
40 EXAMPLE OF A MODEL FREE LINKAGE ANALYSIS 40 / 49
41 Leprosy letter Chromosome 6q25 is linked to susceptibility to leprosy in a Vietnamese population Marcelo T. Mira 1 *, Alexandre Alcaïs 2 *, Nguyen Van Thuc 3, Vu Hong Thai 3, Nguyen Thu Huong 3, Nguyen Ngoc Ba 3, Andrei Verner 4, Thomas J. Hudson 1,4, Laurent Abel 2 & Erwin Schurr 1 *These authors contributed equally to this work. Published online 10 February 2003; doi: /ng / 49
42 Leprosy Affects an estimated 700,000 persons each year Affected subjects develop major skin lesions Effective chemotherapeutic treatment is available World-wide incidence of leprosy has shown little decrease over the last 15 years 42 / 49

43 Leprosy 43 / 49
44 The study Panel of 86 families including 205 siblings affected with leprosy from Southern Vietnam # of affected sibs # families / 49
45 Genome scan design Primary map: 388 microsatellites Average inter-marker distance 10 cm Linkage analysis: Model free Sibship oriented LOD scores and p-value computation Results 8 regions with p-values < 0.01 (LOD score > 1.17) 45 / 49

46 Results 46 / 49
47 Genome scan: fine mapping 89 additional microsatellites 2 regions remained interesting: 6p21 and 6q25-q27 47 / 49
48 Fine mapping: region 6q25 48 / 49

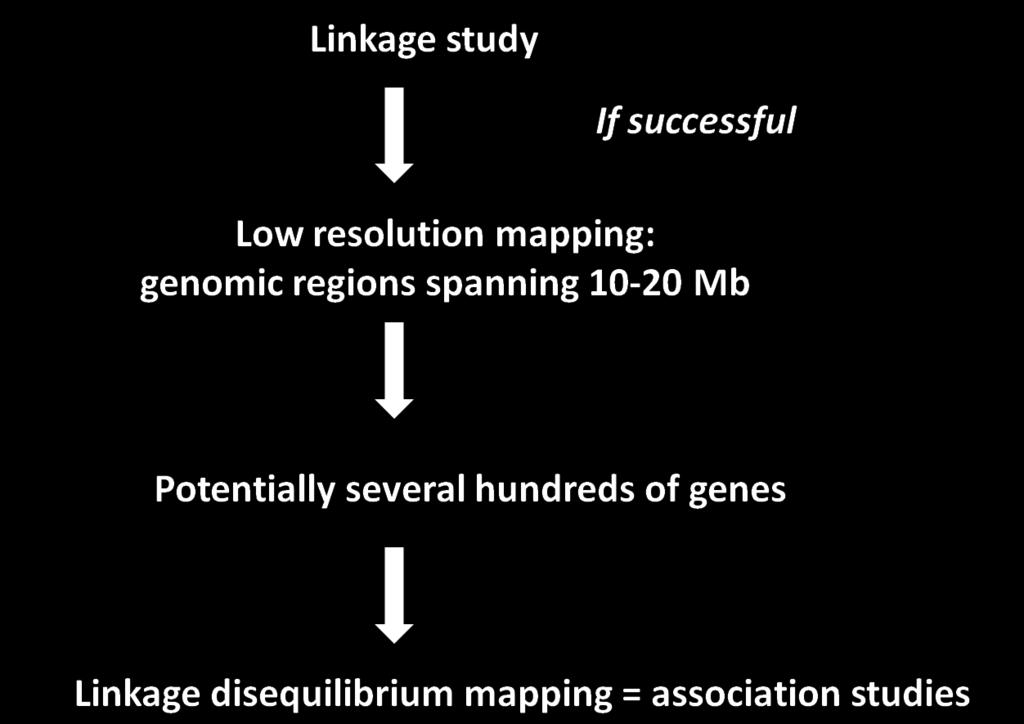
49 Research flow 49 / 49