Microarray Analysis of Gene Expression in Huntington's Disease Peripheral Blood - a Platform Comparison. CodeLink compatible
|
|
|
- Priscilla Lindsey
- 6 years ago
- Views:
Transcription
1 Microarray Analysis of Gene Expression in Huntington's Disease Peripheral Blood - a Platform Comparison CodeLink compatible
2 Microarray Analysis of Gene Expression in Huntington's Disease Peripheral Blood - a Platform Comparison General microarry data analysis workflow From raw data to biological significance Comparison statistics and correction for multiple testing GeneSifter overview Gene Expression in Huntington's Disease Peripheral Blood Identification of biological themes Platform comparison
3 Analysis Workflow Raw data Normalized, scaled data Differentially expressed genes Identify and partition expression patterns Gene Summaries Biological themes (Pathways, molecular function, etc.)
4 Analysis Workflow Raw data Normalized, scaled data Differentially expressed genes Identify and partition expression patterns Gene Summaries Data upload Comparison statistics, correction for multiple testing Up and down regulated, magnitude, clustering Annotation (UniGene, Entrez Gene, Gene Ontologies, etc.) Biological themes (Pathways, molecular function, etc.) Ontology report, pathway report, z-score
5 microarraysuccess.com Experiment Design Experimental design determines what can be inferred from the data as well as determining the confidence that can be assigned to those inferences. Careful experimental design and the presence of biological replicates are essential to the successful use of microarrays. Type of experiment Two groups Three or more groups Time series Dose response Multiple treatment The type of experiment and number of groups will affect the statistical methods used to detect differential expression Replicates The more the better, but at least 3 Biological better than technical Rigorous statistical inferences cannot be made with a sample size of one. The more replicates, the stronger the inference. Supporting material - Experimental Design and Other Issues in Microarray Studies - Kathleen Kerr -
6 microarraysuccess.com Differential Expression The fundamental goal of microarray experiments is to identify genes that are differentially expressed in the conditions being studied. Comparison statistics can be used to help identify differentially expressed genes and cluster analysis can be used to identify patterns of gene expression and to segregate a subset of genes based on these patterns. Statistical Significance Fold change Fold change does not address the reproducibility of the observed difference and cannot be used to determine the statistical significance. Comparison statistics 2 group t-test, Welch s t-test, Wilcoxon Rank Sum, 3 or more groups ANOVA, Kruskal-Wallis Comparison tests require replicates and use the variability within the replicates to assign a confidence level as to whether the gene is differentially expressed. Supporting material - Draghici S. (2002) Statistical intelligence: effective analysis of high-density microarray data. Drug Discov Today, 7(11 Suppl).: S55-63.
7 microarraysuccess.com Differential Expression Correction for multiple testing- Methods for adjusting the p-value from a comparison test based on the number of tests performed. These adjustments help to reduce the number of false positives in an experiment. FWER : Family Wise Error Rate (FWER) corrections adjust the p-value so that it reflects the chance of at least 1 false positive being found in the list. Bonferonni, Holm, W & Y MaxT FDR : False Discovery Rate corrections (FDR) adjust the p-value so that it reflects the frequency of false positives in the list. Benjamini and Hochberg, SAM The FWER is more conservative, but the FDR is usually acceptable for discovery experiments, i.e. where a small number of false positives is acceptable Dudoit, S., et al. (2003) Multiple hypothesis testing in microarray experiments. Statistical Science 18(1): Reiner, A., et al. (2003) Identifying differentially expressed genes using false discovery rate controlling procedures. Bioinformatics 19(3):
 Multiple upload tools CodeLink Affymetrix Illumina Agilent GEO CodeLink")


8 GeneSifter Microarray Data Analysis Accessibility Web-based Secure Data management Data Annotation (MIAME) Multiple upload tools CodeLink Affymetrix Illumina Agilent GEO CodeLink compatible Differential Expression - Powerful, accessible tools for determining Statistical Significance R based statistics Bioconductor Comparison Tests t-test, Welch s t-test, Wilcoxon Rank sum test, ANOVA, Correction for Multiple Testing Bonferroni, Holm, Westfall and Young maxt, Benjamini and Hochberg Unsupervised Clustering PAM, CLARA, Hierarchical clustering Silhouettes


9 GeneSifter Microarray Data Analysis Integrated tools for determining Biological Significance One Click Gene Summary Ontology Report Pathway Report Search by ontology terms Search by KEGG terms or Chromosome

10 The GeneSifter Data Center Free resource Training Research Publishing 5 areas Cardiovascular Cancer Neuroscience Immunology Oral Biology Access to : Data Analysis summary Tutorials WebEx
11 The GeneSifter Data Center


 Differential expression Fold")


12 GeneSifter - Analysis Examples 2 groups (Huntingtons Blood vs Healthy Blood) Data Upload CodeLink 3 + groups (Time series, dose response, etc.) Differential expression Fold change Quality t-test False discovery rate Differential expression Fold change Quality ANOVA False discovery rate Visualization Hierarchical clustering PCA Partitioning PAM Silhouettes Biological significance Gene Annotation Ontology report Pathway report
13 Microarray Analysis of Gene Expression in Huntington's Disease Peripheral Blood - a Platform Comparison General microarry data analysis workflow From raw data to biological significance Comparison statistics and correction for multiple testing GeneSifter overview Gene Expression in Huntington's Disease Peripheral Blood Identification of biological themes Platform comparison
14 Background - Huntington s Disease Huntington s Disease (HD) Autosomal dominant neurodegenerative disease Motor impairment Cognitive decline Various psychiatric symptoms Onset years Mutant Huntingtin protein (polyglutamine) Effects transcriptional regulation Transcription effects may occur outside of CNS
15 Background - Data Genome-wide expression profiling of human blood reveals biomarkers for Huntington's disease Borovecki F, Lovrecic L, Zhou J, Jeong H, Then F, Rosas HD, Hersch SM, Hogarth P, Bouzou B, Jensen RV, Krainc D. Proc Natl Acad Sci U S A Aug 2;102(31): Collected peripheral blood samples - 14 Controls 12 Symptomatic HD patients 5 Presymptomatic HD patients Identified 322 most differentially expressed genes (Con. Vs Symptomatic HD) using U133A array. Used CodeLink 20K to confirm genes identifed using Affymetrix platform Focused on 12 genes that showed most significant difference between Control and HD Data available from GEO

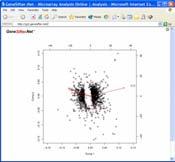
16 Pairwise Analysis Human blood expression for Huntington s disease versus control, CodeLink CodeLink Human 20K Bioarray Borovecki F, Lovrecic L, Zhou J, Jeong H, Then F, Rosas HD, Hersch SM, Hogarth P, Bouzou B, Jensen RV, Krainc D. Genome-wide expression profiling of human blood reveals biomarkers for Huntington's disease. Proc Natl Acad Sci U S A Aug 2;102(31):

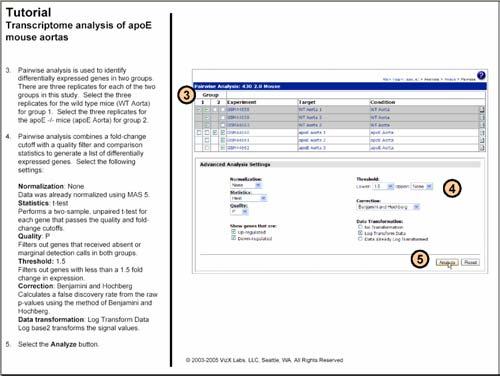
17 Pairwise Analysis Select group 1 14 normal Select group 2 12 Huntingtons

18 Pairwise Analysis Already normalized (median) t-test Quality filter 0.75 (filters out genes with signal less than 0.75) Benjamini and Hochberg (FDR) Log transform data
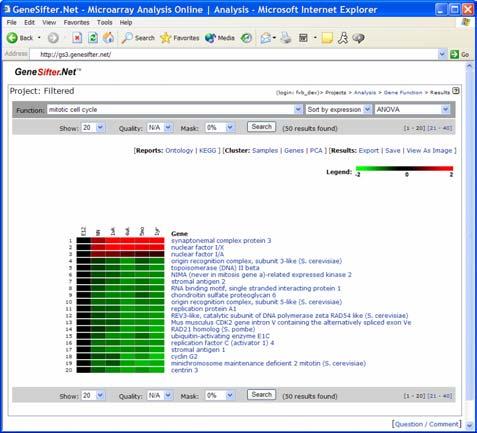
19 Pairwise Analysis Gene List
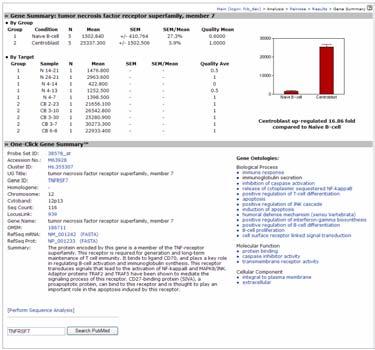
20 One-Click Gene Summary
21 Biological Significance Gene Annotation Sources UniGene - organizes GenBank sequences into a non-redundant set of gene-oriented clusters. Gene titles are assigned to the clusters and these titles are commonly used by researchers to refer to that particular gene. LocusLink (Entrez Gene) - provides a single query interface to curated sequence and descriptive information, including function, about genes. Gene Ontologies The Gene Ontology Consortium provides controlled vocabularies for the description of the molecular function, biological process and cellular component of gene products. KEGG - Kyoto Encyclopedia of Genes and Genomes provides information about both regulatory and metabolic pathways for genes. Reference Sequences- The NCBI Reference Sequence project (RefSeq) provides reference sequences for both the mrna and protein products of included genes. GeneSifter maintains its own copies of these databases and updates them automatically.

22 Pairwise Analysis Gene List

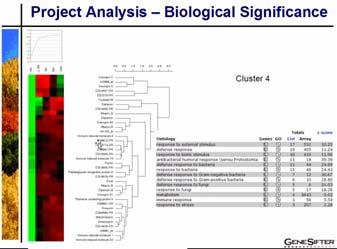
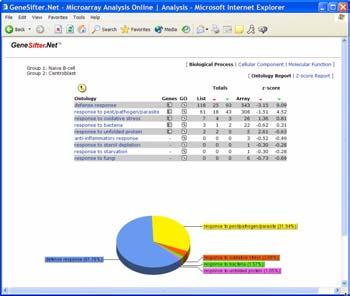
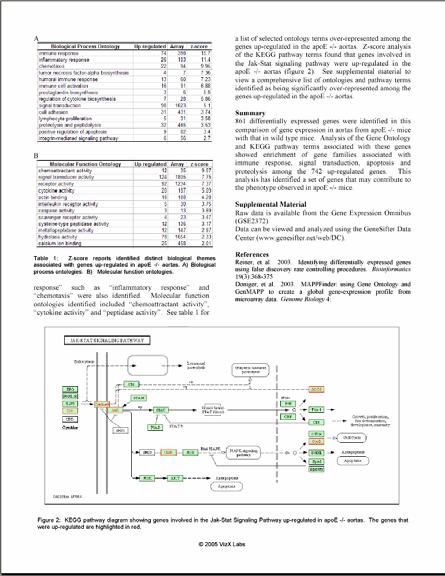
23 Ontology Report
24 Ontology Report : z-score R = total number of genes meeting selection criteria N = total number of genes measured r = number of genes meeting selection criteria with the specified GO term n = total number of genes measured with the specific GO term Reference: Scott W Doniger, Nathan Salomonis, Kam D Dahlquist, Karen Vranizan, Steven C Lawlor and Bruce R Conklin; MAPPFinder: usig Gene Ontology and GenMAPP to create a global gene-expression profile from microarray data, Genome Biology 2003, 4:R7
25 Z-score Report

26 Z-score Report

27 KEGG Report
28 Pairwise Analysis - Summary Human blood expression for Huntington s disease versus control 12 HD 14 Control t-test, Benjamini and Hochberg (FDR) Pattern selection 2606 increased In HD Z-scores Biological processes Protein biosynthesis (104) Ubiquitin cycle (123) RNA splicing (53) KEGG Oxidataive phosphorylation (35) Apoptosis (22) ~20,000 genes 5684 genes 3078 decreased In HD Biological processes Neurogenesis (90) Cell adhesion (120) Sodium ion transport (29) G-protein coupled receptor signaling (114) KEGG Neuroactive ligand-receptor interaction (56)
29 Microarray Analysis of Gene Expression in Huntington's Disease Peripheral Blood - a Platform Comparison General microarry data analysis workflow From raw data to biological significance Comparison statistics and correction for multiple testing GeneSifter overview Gene Expression in Huntington's Disease Peripheral Blood Identification of biological themes Platform comparison
:11023-8.")
30 Pairwise Analysis Human blood expression for Huntington s disease versus control, Affymetrix U133A Human Genome Array Borovecki F, Lovrecic L, Zhou J, Jeong H, Then F, Rosas HD, Hersch SM, Hogarth P, Bouzou B, Jensen RV, Krainc D. Genome-wide expression profiling of human blood reveals biomarkers for Huntington's disease. Proc Natl Acad Sci U S A Aug 2;102(31):
 Benjamini and Hochberg (FDR) Log transform")
31 Pairwise Analysis - Affymetrix Already normalized (median) t-test Quality filter 50 (filters out genes with signal less than 50) Benjamini and Hochberg (FDR) Log transform data

32 Pairwise Analysis Gene List Human blood expression for Huntington s disease versus control, Affymetrix
33 Gene Lists Common and Unique Genes

34 Platform comparison Biological themes Affymetrix

35 Platform comparison Biological themes CodeLink
36 GeneSifter - Analysis Examples 2 groups (Huntingtons Blood vs Healthy Blood) Data Upload CodeLink 3 + groups (Time series, dose response, etc.) Differential expression Fold change Quality t-test False discovery rate Differential expression Fold change Quality ANOVA False discovery rate Visualization Hierarchical clustering PCA Partitioning PAM Silhouettes Biological significance Gene Annotation Ontology report Pathway report
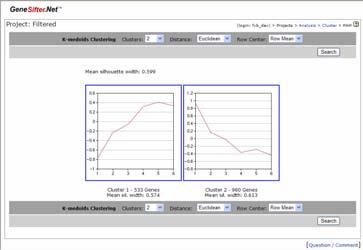
37 Project Analysis - Clustering
38 Cluster by Samples All Genes CodeLink Affymetrix
39 Cluster by Samples? CodeLink Affymetrix
40 Cluster by Samples Y Chrom. Genes CodeLink Affymetrix


41 Platform Comparison - Summary CodeLink Affymetrix Transcripts Total Increased in HD Overlap (LL genes) 41% 65% Top BP Ontologies Ubiquitin cycle RNA splicing Regulation of translation Apoptosis Clustering of samples

42 Platform Comparison - Summary CodeLink Affymetrix Increased in HD Decreased in HD Unique ontology Oxidative Phos. IL-6 Biosynthesis


43 The GeneSifter Data Center
44 MicroarraySuccess.com Seven Keys to Successful Microarray Data Analysis Experiment Design Platform Selection Data Management System Access Differential Expression Biological Significance Data Publication Type of experiment Two groups Time series Dose Response Multiple treatments Replicates The more the better Technical vs. biological Platforms cdna Oligo One color Two color Feature Extraction Software File formats Databases Raw Data Storing Retrieving Experiment Annotation Samples Protocols Usability Intuitive Special training System Access Single user desktop Single user server Web-based Sharing data In the lab Collaboration Normalization Differential Expression Fold change Comparison statistics FWER/FDR Pattern Identification Clustering Visualization Partitioning Gene Annotation UniGene LocusLink Gene Ontology KEGG OMIM Single Genes Gene Summaries Gene Lists Ontology Report Pathway Report MIAME What is it? Publication Public databases GEO ArrayExpress SMD Using public data Meta analysis Academic partner University of Washington

45 Thank You CodeLink compatible Trial account, tutorials, sample data and Data Center Eric Olson
Microarray Analysis of Gene Expression in Huntington's Disease Peripheral Blood - a Platform Comparison
 Microarray Analysis of Gene Expression in Huntington's Disease Peripheral Blood - a Platform Comparison Thank you for waiting. The presentation will be starting in a few minutes at 9AM Pacific Daylight
Seven Keys to Successful Microarray Data Analysis
 Seven Keys to Successful Microarray Data Analysis Experiment Design Platform Selection Data Management System Access Differential Expression Biological Significance Data Publication Type of experiment
Using 2-way ANOVA to dissect the immune response to hookworm infection in mouse lung
 Using 2-way ANOVA to dissect the immune response to hookworm infection in mouse lung Using 2-way ANOVA to dissect the immune response to hookworm infection in mouse lung General microarry data analysis
Microarray analysis of gene expression in male germ cell tumors
 Microarray analysis of gene expression in male germ cell tumors Microarray analysis of gene expression in male germ cell tumors General microarry data analysis workflow From raw data to biological significance
Using 2-way ANOVA to dissect gene expression following myocardial infarction in mice
 Using 2-way ANOVA to dissect gene expression following myocardial infarction in mice Thank you for waiting. The presentation will be starting in a few minutes at 9AM Pacific Daylight Time. During this
The microarray data analysis process - from raw data to biological significance
 The microarray data analysis process - from raw data to biological significance Thank you for waiting. The presentation will be starting in a few minutes at 6AM Pacific Daylight Time. During this webinar
The microarray data analysis process - from raw data to biological significance. N. Eric Olson
 The microarray data analysis process - from raw data to biological significance N. Eric Olson eric@genesifter.net Microarrays 60,000 56,000 Data Points per Experiment 50,000 40,000 30,000 20,000 10,000
Identification of biological themes in microarray data from a mouse heart development time series using GeneSifter
 Identification of biological themes in microarray data from a mouse heart development time series using GeneSifter VizX Labs, LLC Seattle, WA 98119 Abstract Oligonucleotide microarrays were used to study
Introduction to microarray technology and data analysis
 Introduction to microarray technology and data analysis Aron C. Eklund eklund@cbs.dtu.dk Cancer Systems Biology group Center for Biological Sequence Analysis Technical University of Denmark Introduction
Introduction to microarray technology and data analysis
 Introduction to microarray technology and data analysis Aron C. Eklund eklund@cbs.dtu.dk Cancer Systems Biology group Center for Biological Sequence Analysis Technical University of Denmark Introduction
Analysis of Microarray Data
 Analysis of Microarray Data Lecture 3: Visualization and Functional Analysis George Bell, Ph.D. Bioinformatics Scientist Bioinformatics and Research Computing Whitehead Institute Outline Review Visualizing
Analysis of Microarray Data
 Analysis of Microarray Data Lecture 3: Visualization and Functional Analysis George Bell, Ph.D. Senior Bioinformatics Scientist Bioinformatics and Research Computing Whitehead Institute Outline Review
Introduction to Microarray Technique, Data Analysis, Databases Maryam Abedi PhD student of Medical Genetics
 Introduction to Microarray Technique, Data Analysis, Databases Maryam Abedi PhD student of Medical Genetics abedi777@ymail.com Outlines Technology Basic concepts Data analysis Printed Microarrays In Situ-Synthesized
Gene Expression Data Analysis
 Gene Expression Data Analysis Bing Zhang Department of Biomedical Informatics Vanderbilt University bing.zhang@vanderbilt.edu BMIF 310, Fall 2009 Gene expression technologies (summary) Hybridization-based
CodeLink Human Whole Genome Bioarray
 CodeLink Human Whole Genome Bioarray 55,000 human gene targets on a single bioarray The CodeLink Human Whole Genome Bioarray comprises one of the most comprehensive coverages of the human genome, as it
The Microarray Data Analysis Process: From Raw Data to Biological Significance
 NeuroRx : The Journal of the American Society for Experimental NeuroTherapeutics The Microarray Data Analysis Process: From Raw Data to Biological Significance N. Eric Olson VizX Labs, Seattle, Washington
Microarray Informatics
 Microarray Informatics Donald Dunbar MSc Seminar 4 th February 2009 Aims To give a biologistʼs view of microarray experiments To explain the technologies involved To describe typical microarray experiments
PATHWAY ANALYSIS. Susan LM Coort, PhD Department of Bioinformatics, Maastricht University. PET course: Toxicogenomics
 PATHWAY ANALYSIS Susan LM Coort, PhD Department of Bioinformatics, Maastricht University 1 Data analysis overview Microarray scans Slide based on a slide from J. Pennings, RIVM, NL Image analysis Preprocessing
Microarray Informatics
 Microarray Informatics Donald Dunbar MSc Seminar 31 st January 2007 Aims To give a biologist s view of microarray experiments To explain the technologies involved To describe typical microarray experiments
Annotation. (Chapter 8)
") Annotation (Chapter 8) Genome annotation Genome annotation is the process of attaching biological information to sequences: identify elements on the genome attach biological information to elements store
Annotation (Chapter 8) Genome annotation Genome annotation is the process of attaching biological information to sequences: identify elements on the genome attach biological information to elements store
Bioconductor. Course in Practical Microarray Analysis Berlin Slides 2002 Sandrine Dudoit, Robert Gentleman. Adapted by Wolfgang Huber.
 Bioconductor Course in Practical Microarray Analysis Berlin 27.-30.1.2003 Slides 2002 Sandrine Dudoit, Robert Gentleman. Adapted by Wolfgang Huber. Statistical computing Applications statistical design
AGILENT S BIOINFORMATICS ANALYSIS SOFTWARE
 ACCELERATING PROGRESS IS IN OUR GENES AGILENT S BIOINFORMATICS ANALYSIS SOFTWARE GENESPRING GENE EXPRESSION (GX) MASS PROFILER PROFESSIONAL (MPP) PATHWAY ARCHITECT (PA) See Deeper. Reach Further. BIOINFORMATICS
Gene expression analysis: Introduction to microarrays
 Gene expression analysis: Introduction to microarrays Adam Ameur The Linnaeus Centre for Bioinformatics, Uppsala University February 15, 2006 Overview Introduction Part I: How a microarray experiment is
Standard Data Analysis Report Agilent Gene Expression Service
 Standard Data Analysis Report Agilent Gene Expression Service Experiment: S534662 Date: 2011-01-01 Prepared for: Dr. Researcher Genomic Sciences Lab Prepared by S534662 Standard Data Analysis Report 2011-01-01
Understanding protein lists from proteomics studies. Bing Zhang Department of Biomedical Informatics Vanderbilt University
 Understanding protein lists from proteomics studies Bing Zhang Department of Biomedical Informatics Vanderbilt University bing.zhang@vanderbilt.edu A typical comparative shotgun proteomics study IPI00375843
Measuring and Understanding Gene Expression
 Measuring and Understanding Gene Expression Dr. Lars Eijssen Dept. Of Bioinformatics BiGCaT Sciences programme 2014 Why are genes interesting? TRANSCRIPTION Genome Genomics Transcriptome Transcriptomics
A WEB-BASED TOOL FOR GENOMIC FUNCTIONAL ANNOTATION, STATISTICAL ANALYSIS AND DATA MINING
 A WEB-BASED TOOL FOR GENOMIC FUNCTIONAL ANNOTATION, STATISTICAL ANALYSIS AND DATA MINING D. Martucci a, F. Pinciroli a,b, M. Masseroli a a Dipartimento di Bioingegneria, Politecnico di Milano, Milano,
Bioconductor. Course in Practical Microarray Analysis Heidelberg
 Bioconductor Course in Practical Microarray Analysis Heidelberg 23.-27.9.2002 Slides 2002 Sandrine Dudoit, Robert Gentleman. Adapted by Wolfgang Huber. Statistical computing Everywhere for statistical
How to deal with the microarray results.
 How to deal with the microarray results. Britt Gabrielsson PhD RCEM, Div of metabolism and cardiovascular research Department of Medicine The Sahlgrenska Academy at Göteborg University and then we will
Deakin Research Online
 Deakin Research Online This is the published version: Church, Philip, Goscinski, Andrzej, Wong, Adam and Lefevre, Christophe 2011, Simplifying gene expression microarray comparative analysis., in BIOCOM
Gene expression analysis. Biosciences 741: Genomics Fall, 2013 Week 5. Gene expression analysis
 Gene expression analysis Biosciences 741: Genomics Fall, 2013 Week 5 Gene expression analysis From EST clusters to spotted cdna microarrays Long vs. short oligonucleotide microarrays vs. RT-PCR Methods
Agilent GeneSpring GX 10: Beyond. Pam Tangvoranuntakul Product Manager, GeneSpring October 1, 2008
 Agilent GeneSpring GX 10: Gene Expression and Beyond Pam Tangvoranuntakul Product Manager, GeneSpring October 1, 2008 GeneSpring GX 10 in the News Our Goals for GeneSpring GX 10 Goal 1: Bring back GeneSpring
Gene-centered resources at NCBI
 COURSE OF BIOINFORMATICS a.a. 2014-2015 Gene-centered resources at NCBI We searched Accession Number: M60495 AT NCBI Nucleotide Gene has been implemented at NCBI to organize information about genes, serving
Next-Generation Sequencing Gene Expression Analysis Using Agilent GeneSpring GX
 Next-Generation Sequencing Gene Expression Analysis Using Agilent GeneSpring GX Technical Overview Introduction RNA Sequencing (RNA-Seq) is one of the most commonly used next-generation sequencing (NGS)
GS Analysis of Microarray Data
 GS01 0163 Analysis of Microarray Data Keith Baggerly and Brad Broom Department of Bioinformatics and Computational Biology UT M. D. Anderson Cancer Center kabagg@mdanderson.org bmbroom@mdanderson.org 7
Lecture #1. Introduction to microarray technology
 Lecture #1 Introduction to microarray technology Outline General purpose Microarray assay concept Basic microarray experimental process cdna/two channel arrays Oligonucleotide arrays Exon arrays Comparing
Exploration and Analysis of DNA Microarray Data
 Exploration and Analysis of DNA Microarray Data Dhammika Amaratunga Senior Research Fellow in Nonclinical Biostatistics Johnson & Johnson Pharmaceutical Research & Development Javier Cabrera Associate
Integrative Genomics 1a. Introduction
 2016 Course Outline Integrative Genomics 1a. Introduction ggibson.gt@gmail.com http://www.cig.gatech.edu 1a. Experimental Design and Hypothesis Testing (GG) 1b. Normalization (GG) 2a. RNASeq (MI) 2b. Clustering
Ingenuity Pathway Analysis (IPA )
") Ingenuity Pathway Analysis (IPA ) For the analysis and interpretation of omics data IPA is a web-based software application for the analysis, integration, and interpretation of data derived from omics
Ingenuity Pathway Analysis (IPA ) For the analysis and interpretation of omics data IPA is a web-based software application for the analysis, integration, and interpretation of data derived from omics
GS Analysis of Microarray Data
 GS01 0163 Analysis of Microarray Data Keith Baggerly and Brad Broom Department of Bioinformatics and Computational Biology UT M. D. Anderson Cancer Center kabagg@mdanderson.org bmbroom@mdanderson.org 8
Web-based tools for Bioinformatics; A (free) introduction to (freely available) NCBI, MUSC and World-wide.
 introduction to (freely available) NCBI, MUSC and World-wide.") Page 1 of 24 Web-based tools for Bioinformatics; A (free) introduction to (freely available) NCBI, MUSC and World-wide. When and Where---Wednesdays at 1pm-2pmRoom 438 Library Admin Building Beginning September
Page 1 of 24 Web-based tools for Bioinformatics; A (free) introduction to (freely available) NCBI, MUSC and World-wide. When and Where---Wednesdays at 1pm-2pmRoom 438 Library Admin Building Beginning September
Gene Expression Data Analysis (I)
") Gene Expression Data Analysis (I) Bing Zhang Department of Biomedical Informatics Vanderbilt University bing.zhang@vanderbilt.edu Bioinformatics tasks Biological question Experiment design Microarray experiment
Gene Expression Data Analysis (I) Bing Zhang Department of Biomedical Informatics Vanderbilt University bing.zhang@vanderbilt.edu Bioinformatics tasks Biological question Experiment design Microarray experiment
Microarray Data Analysis in GeneSpring GX 11. Month ##, 200X
 Microarray Data Analysis in GeneSpring GX 11 Month ##, 200X Agenda Genome Browser GO GSEA Pathway Analysis Network building Find significant pathways Extract relations via NLP Data Visualization Options
From Variants to Pathways: Agilent GeneSpring GX s Variant Analysis Workflow
 From Variants to Pathways: Agilent GeneSpring GX s Variant Analysis Workflow Technical Overview Import VCF Introduction Next-generation sequencing (NGS) studies have created unanticipated challenges with
Research Powered by Agilent s GeneSpring
 Research Powered by Agilent s GeneSpring Agilent Technologies, Inc. Carolina Livi, Bioinformatics Segment Manager Research Powered by GeneSpring Topics GeneSpring (GS) platform New features in GS 13 What
Outline. Analysis of Microarray Data. Most important design question. General experimental issues
 Outline Analysis of Microarray Data Lecture 1: Experimental Design and Data Normalization Introduction to microarrays Experimental design Data normalization Other data transformation Exercises George Bell,
9/19/13. cdna libraries, EST clusters, gene prediction and functional annotation. Biosciences 741: Genomics Fall, 2013 Week 3
 cdna libraries, EST clusters, gene prediction and functional annotation Biosciences 741: Genomics Fall, 2013 Week 3 1 2 3 4 5 6 Figure 2.14 Relationship between gene structure, cdna, and EST sequences
Microarray Experiment Design
 Microarray Experiment Design Samples used, extract preparation and labelling: AML blasts were isolated from bone marrow by centrifugation on a Ficoll- Hypaque gradient. Total RNA was extracted using TRIzol
BIOINF/BENG/BIMM/CHEM/CSE 184: Computational Molecular Biology. Lecture 2: Microarray analysis
 BIOINF/BENG/BIMM/CHEM/CSE 184: Computational Molecular Biology Lecture 2: Microarray analysis Genome wide measurement of gene transcription using DNA microarray Bruce Alberts, et al., Molecular Biology
ChIP-seq data analysis with Chipster. Eija Korpelainen CSC IT Center for Science, Finland
 ChIP-seq data analysis with Chipster Eija Korpelainen CSC IT Center for Science, Finland chipster@csc.fi What will I learn? Short introduction to ChIP-seq Analyzing ChIP-seq data Central concepts Analysis
Introduction to Bioinformatics and Gene Expression Technology
 Vocabulary Introduction to Bioinformatics and Gene Expression Technology Utah State University Spring 2014 STAT 5570: Statistical Bioinformatics Notes 1.1 Gene: Genetics: Genome: Genomics: hereditary DNA
GS Analysis of Microarray Data
 GS01 0163 Analysis of Microarray Data Keith Baggerly and Kevin Coombes Department of Bioinformatics and Computational Biology UT M. D. Anderson Cancer Center kabagg@mdanderson.org kcoombes@mdanderson.org
EECS730: Introduction to Bioinformatics
 EECS730: Introduction to Bioinformatics Lecture 14: Microarray Some slides were adapted from Dr. Luke Huan (University of Kansas), Dr. Shaojie Zhang (University of Central Florida), and Dr. Dong Xu and
Biology 644: Bioinformatics
 Processes Activation Repression Initiation Elongation.... Processes Splicing Editing Degradation Translation.... Transcription Translation DNA Regulators DNA-Binding Transcription Factors Chromatin Remodelers....
Analyzing Gene Set Enrichment
 Analyzing Gene Set Enrichment BaRC Hot Topics June 20, 2016 Yanmei Huang Bioinformatics and Research Computing Whitehead Institute http://barc.wi.mit.edu/hot_topics/ Purpose of Gene Set Enrichment Analysis
Types of Databases - By Scope
 Biological Databases Bioinformatics Workshop 2009 Chi-Cheng Lin, Ph.D. Department of Computer Science Winona State University clin@winona.edu Biological Databases Data Domains - By Scope - By Level of
advanced analysis of gene expression microarray data aidong zhang World Scientific State University of New York at Buffalo, USA
 advanced analysis of gene expression microarray data aidong zhang State University of New York at Buffalo, USA World Scientific NEW JERSEY LONDON SINGAPORE BEIJING SHANGHAI HONG KONG TAIPEI CHENNAI Contents
Bioinformatics for Proteomics. Ann Loraine
 Bioinformatics for Proteomics Ann Loraine aloraine@uab.edu What is bioinformatics? The science of collecting, processing, organizing, storing, analyzing, and mining biological information, especially data
Pathway Analysis. Min Kim Bioinformatics Core Facility 2/28/2018
 Pathway Analysis Min Kim Bioinformatics Core Facility 2/28/2018 Outline 1. Background 2. Databases: KEGG, Reactome, Biocarta, Gene Ontology, MSigDB, MetaCyc, SMPDB, IPA. 3. Statistical Methods: Overlap
Introduction to Bioinformatics and Gene Expression Technologies
 Introduction to Bioinformatics and Gene Expression Technologies Utah State University Fall 2017 Statistical Bioinformatics (Biomedical Big Data) Notes 1 1 Vocabulary Gene: hereditary DNA sequence at a
Introduction to Bioinformatics and Gene Expression Technologies
 Vocabulary Introduction to Bioinformatics and Gene Expression Technologies Utah State University Fall 2017 Statistical Bioinformatics (Biomedical Big Data) Notes 1 Gene: Genetics: Genome: Genomics: hereditary
Basic aspects of Microarray Data Analysis
 Hospital Universitari Vall d Hebron Institut de Recerca - VHIR Institut d Investigació Sanitària de l Instituto de Salud Carlos III (ISCIII) Basic aspects of Microarray Data Analysis Expression Data Analysis
Array-Ready Oligo Set for the Rat Genome Version 3.0
 Array-Ready Oligo Set for the Rat Genome Version 3.0 We are pleased to announce Version 3.0 of the Rat Genome Oligo Set containing 26,962 longmer probes representing 22,012 genes and 27,044 gene transcripts.
ELE4120 Bioinformatics. Tutorial 5
 ELE4120 Bioinformatics Tutorial 5 1 1. Database Content GenBank RefSeq TPA UniProt 2. Database Searches 2 Databases A common situation for alignment is to search through a database to retrieve the similar
Product Applications for the Sequence Analysis Collection
 Product Applications for the Sequence Analysis Collection Pipeline Pilot Contents Introduction... 1 Pipeline Pilot and Bioinformatics... 2 Sequence Searching with Profile HMM...2 Integrating Data in a
Microarrays & Gene Expression Analysis
 Microarrays & Gene Expression Analysis Contents DNA microarray technique Why measure gene expression Clustering algorithms Relation to Cancer SAGE SBH Sequencing By Hybridization DNA Microarrays 1. Developed
April transmart v1.2 Case Study for PredicTox
 April 2015 transmart v1.2 Case Study for PredicTox Agenda Agenda! What is PredicTox?! Brief transmart overview! Answering scientific questions with transmart s help: A case study maximizing data value!
Final exam: Introduction to Bioinformatics and Genomics DUE: Friday June 29 th at 4:00 pm
 Final exam: Introduction to Bioinformatics and Genomics DUE: Friday June 29 th at 4:00 pm Exam description: The purpose of this exam is for you to demonstrate your ability to use the different biomolecular
Bioinformatics Analysis of Nano-based Omics Data
 Bioinformatics Analysis of Nano-based Omics Data Penny Nymark, Pekka Kohonen, Vesa Hongisto and Roland Grafström Hands-on Workshop on Nano Safety Assessment, 29 th September, 2016, National Technical University
Gene Expression Profiling of Prokaryotic Samples using Low Input Quick Amp WT Kit
 Gene Expression Profiling of Prokaryotic Samples using Low Input Quick Amp WT Kit Application Note Authors Nilanjan Guha and Becky Mullinax Abstract Agilent s Low Input Quick Amp Labeling WT (LIQA WT)
Gene Regulation Solutions. Microarrays and Next-Generation Sequencing
 Gene Regulation Solutions Microarrays and Next-Generation Sequencing Gene Regulation Solutions The Microarrays Advantage Microarrays Lead the Industry in: Comprehensive Content SurePrint G3 Human Gene
Array Quality Metrics. Audrey Kauffmann
 Array Quality Metrics Audrey Kauffmann Introduction Microarrays are widely/routinely used Technology and protocol improvements trustworthy Variance and noise Technical causes: Platform Lab, experimentalist
Experience with Weka by Predictive Classification on Gene-Expre
 Experience with Weka by Predictive Classification on Gene-Expression Data Czech Technical University in Prague Faculty of Electrical Engineering Department of Cybernetics Intelligent Data Analysis lab
PCR Arrays. An Advanced Real-time PCR Technology to Empower Your Pathway Analysis
 PCR Arrays An Advanced Real-time PCR Technology to Empower Your Pathway Analysis 1 Table of Contents 1. Introduction to the PCR Arrays 2. How PCR Arrays Work 3. Performance Data from PCR Arrays 4. Research
Generating quality metrics reports for microarray data sets. Audrey Kauffmann
 Generating quality metrics reports for microarray data sets Audrey Kauffmann Introduction Microarrays are widely/routinely used Technology and protocol improvements trustworthy Variance and noise Technical
IPA Advanced Training Course
 IPA Advanced Training Course Academia Sinica 2015 Oct Gene( 陳冠文 ) Supervisor and IPA certified analyst 1 Review for Introductory Training course Searching Building a Pathway Editing a Pathway for Publication
Bioinformatics : Gene Expression Data Analysis
 05.12.03 Bioinformatics : Gene Expression Data Analysis Aidong Zhang Professor Computer Science and Engineering What is Bioinformatics Broad Definition The study of how information technologies are used
Transcriptome analysis
 Statistical Bioinformatics: Transcriptome analysis Stefan Seemann seemann@rth.dk University of Copenhagen April 11th 2018 Outline: a) How to assess the quality of sequencing reads? b) How to normalize
Kyoto Encyclopedia of Genes and Genomes (KEGG)
") NPTEL Biotechnology -Systems Biology Kyoto Encyclopedia of Genes and Genomes (KEGG) Dr. M. Vijayalakshmi School of Chemical and Biotechnology SASTRA University Joint Initiative of IITs and IISc Funded
NPTEL Biotechnology -Systems Biology Kyoto Encyclopedia of Genes and Genomes (KEGG) Dr. M. Vijayalakshmi School of Chemical and Biotechnology SASTRA University Joint Initiative of IITs and IISc Funded
Gene List Enrichment Analysis
 Outline Gene List Enrichment Analysis George Bell, Ph.D. BaRC Hot Topics March 16, 2010 Why do enrichment analysis? Main types Selecting or ranking genes Annotation sources Statistics Remaining issues
Introduction to RNA-Seq in GeneSpring NGS Software
 Introduction to RNA-Seq in GeneSpring NGS Software Dipa Roy Choudhury, Ph.D. Strand Scientific Intelligence and Agilent Technologies Learn more at www.genespring.com Introduction to RNA-Seq In a few years,
Gene Annotation and Gene Set Analysis
 Gene Annotation and Gene Set Analysis After you obtain a short list of genes/clusters/classifiers what next? For each gene, you may ask What it is What is does What processes is it involved in Which chromosome
Entrez Gene: gene-centered information at NCBI
 D54 D58 Nucleic Acids Research, 2005, Vol. 33, Database issue doi:10.1093/nar/gki031 Entrez Gene: gene-centered information at NCBI Donna Maglott*, Jim Ostell, Kim D. Pruitt and Tatiana Tatusova National
Gene expression: Microarray data analysis. Copyright notice. Outline: microarray data analysis. Schedule
 Gene expression: Microarray data analysis Copyright notice Many of the images in this powerpoint presentation are from Bioinformatics and Functional Genomics by Jonathan Pevsner (ISBN -47-4-8). Copyright
Microarray Data Analysis Workshop. Preprocessing and normalization A trailer show of the rest of the microarray world.
 Microarray Data Analysis Workshop MedVetNet Workshop, DTU 2008 Preprocessing and normalization A trailer show of the rest of the microarray world Carsten Friis Media glna tnra GlnA TnrA C2 glnr C3 C5 C6
Combining ANOVA and PCA in the analysis of microarray data
 Combining ANOVA and PCA in the analysis of microarray data Lutgarde Buydens IMM, Analytical chemistry Radboud University Nijmegen, the Netherlands Scientific Staff: PhD students: External PhD: Post doc:
BGGN 213: Foundations of Bioinformatics (Fall 2017)
") BGGN 213: Foundations of Bioinformatics (Fall 2017) Course Instructor: Dr. Barry J. Grant ( bjgrant@ucsd.edu ) Course Website: https://bioboot.github.io/bggn213_f17/ DRAFT: 2017-08-10 (15:02:30 PDT on
BGGN 213: Foundations of Bioinformatics (Fall 2017) Course Instructor: Dr. Barry J. Grant ( bjgrant@ucsd.edu ) Course Website: https://bioboot.github.io/bggn213_f17/ DRAFT: 2017-08-10 (15:02:30 PDT on
RNA-Seq Analysis. August Strand Genomics, Inc All rights reserved.
 RNA-Seq Analysis August 2014 Strand Genomics, Inc. 2014. All rights reserved. Contents Introduction... 3 Sample import... 3 Quantification... 4 Novel exon... 5 Differential expression... 12 Differential
EECS 730 Introduction to Bioinformatics Sequence Alignment. Luke Huan Electrical Engineering and Computer Science
 EECS 730 Introduction to Bioinformatics Sequence Alignment Luke Huan Electrical Engineering and Computer Science http://people.eecs.ku.edu/~jhuan/ Database What is database An organized set of data Can
Computational Biology I
 Computational Biology I Microarray data acquisition Gene clustering Practical Microarray Data Acquisition H. Yang From Sample to Target cdna Sample Centrifugation (Buffer) Cell pellets lyse cells (TRIzol)
Analysis of a Tiling Regulation Study in Partek Genomics Suite 6.6
 Analysis of a Tiling Regulation Study in Partek Genomics Suite 6.6 The example data set used in this tutorial consists of 6 technical replicates from the same human cell line, 3 are SP1 treated, and 3
BIMM 143: Introduction to Bioinformatics (Winter 2018)
") BIMM 143: Introduction to Bioinformatics (Winter 2018) Course Instructor: Dr. Barry J. Grant ( bjgrant@ucsd.edu ) Course Website: https://bioboot.github.io/bimm143_w18/ DRAFT: 2017-12-02 (20:48:10 PST
BIMM 143: Introduction to Bioinformatics (Winter 2018) Course Instructor: Dr. Barry J. Grant ( bjgrant@ucsd.edu ) Course Website: https://bioboot.github.io/bimm143_w18/ DRAFT: 2017-12-02 (20:48:10 PST
ROAD TO STATISTICAL BIOINFORMATICS CHALLENGE 1: MULTIPLE-COMPARISONS ISSUE
 CHAPTER1 ROAD TO STATISTICAL BIOINFORMATICS Jae K. Lee Department of Public Health Science, University of Virginia, Charlottesville, Virginia, USA There has been a great explosion of biological data and
Soil invertebrates as a genomic model to study pollutants in the field
 Soil invertebrates as a genomic model to study pollutants in the field Dick Roelofs, Martijn Timmermans, Muriel de Boer, Ben Nota, Tjalf de Boer, Janine Mariën, Nico van Straalen ecogenomics Folsomia candida
Course on Functional Analysis
 Course on Functional Analysis ::: An Introduction to Ingenuity Pathway Analysis. Madrid, June 31st, 2007. Gonzalo Gómez, PhD. ggomez@cnio.es Bioinformatics Unit Structural Biology and Biocomputing program
New Features in JMP Genomics 4.1 WHITE PAPER
 WHITE PAPER Table of Contents Platform Updates...2 Expanded Operating Systems Support...2 New Import Features...3 Affymetrix Import and Analysis... 3 New Expression Features...5 New Pattern Discovery Features...8
Non-conserved intronic motifs in human and mouse are associated with a conserved set of functions
 Non-conserved intronic motifs in human and mouse are associated with a conserved set of functions Aristotelis Tsirigos Bioinformatics & Pattern Discovery Group IBM Research Outline. Discovery of DNA motifs
Microarray Technique. Some background. M. Nath
 Microarray Technique Some background M. Nath Outline Introduction Spotting Array Technique GeneChip Technique Data analysis Applications Conclusion Now Blind Guess? Functional Pathway Microarray Technique
Basics of RNA-Seq. (With a Focus on Application to Single Cell RNA-Seq) Michael Kelly, PhD Team Lead, NCI Single Cell Analysis Facility
 Michael Kelly, PhD Team Lead, NCI Single Cell Analysis Facility") 2018 ABRF Meeting Satellite Workshop 4 Bridging the Gap: Isolation to Translation (Single Cell RNA-Seq) Sunday, April 22 Basics of RNA-Seq (With a Focus on Application to Single Cell RNA-Seq) Michael Kelly,
2018 ABRF Meeting Satellite Workshop 4 Bridging the Gap: Isolation to Translation (Single Cell RNA-Seq) Sunday, April 22 Basics of RNA-Seq (With a Focus on Application to Single Cell RNA-Seq) Michael Kelly,
Analysis of Microarray Data
 Analysis of Microarray Data Lecture 1: Experimental Design and Data Normalization George Bell, Ph.D. Senior Bioinformatics Scientist Bioinformatics and Research Computing Whitehead Institute Outline Introduction