CS 5984: Application of Basic Clustering Algorithms to Find Expression Modules in Cancer
|
|
|
- Estella Turner
- 6 years ago
- Views:
Transcription
1 CS 5984: Application of Basic Clustering Algorithms to Find Expression Modules in Cancer T. M. Murali January 31, 2006
2 Innovative Application of Hierarchical Clustering A module map showing conditional activity of expression modules in cancer, Eran Segal, Nir Friedman, Daphne Koller and Aviv Regev, Nature Genetics 36, , 2004 Analyse gene expression data to find groups of genes expressed in concert between different cancers. Use hierarchical clustering innovatively.
3 Key Ideas Group genes into predefined gene sets, e.g., groups of genes with the same functional annotation. Convert gene-by-array matrix into gene-set-by-array matrix. Hierarchically cluster gene sets in this matrix. Identify interesting gene set clusters (nodes) in the tree. In each gene set cluster, remove genes not expressed consistently with the cluster.

4 Gene Expression Data Sets
5 Data Normalisation
6 Data Normalisation Needed because some arrays measure absolute value of gene expression and others measure relative values. Affymetrix microarrays: take logarithm to the base-2 and zero transform within data set. cdna microarrays:
7 Data Normalisation Needed because some arrays measure absolute value of gene expression and others measure relative values. Affymetrix microarrays: take logarithm to the base-2 and zero transform within data set. cdna microarrays: zero transform within data set.
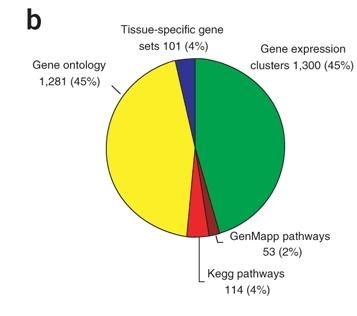
8 Pre-defined Genes Sets
9 Computing Gene-Set-By-Array Matrix Goal is to construct a gene-set-by-array matrix. For each gene set-array pair, find an average expression value of that gene set in that array.
10 Computing Gene-Set-By-Array Matrix Goal is to construct a gene-set-by-array matrix. For each gene set-array pair, find an average expression value of that gene set in that array. A gene is induced (respectively, repressed in an array if its change in expression is 2 (respectively, 2). For each gene set-array pair, compute the fraction of genes induced or repressed. Use these values in the gene-set-by-array matrix.
11 Computing Significant Entries in the Gene-Set-By-Array Matrix Many entries in the gene-set-by-array matrix may not be statistically significant.
12 Computing Significant Entries in the Gene-Set-By-Array Matrix Many entries in the gene-set-by-array matrix may not be statistically significant. For a given array, fraction of induced genes in a gene set may be close to the fraction of induced genes in the array.
13 Computing Significant Entries in the Gene-Set-By-Array Matrix Many entries in the gene-set-by-array matrix may not be statistically significant. For a given array, fraction of induced genes in a gene set may be close to the fraction of induced genes in the array. Statistical test: for a given array, is the fraction of induced genes in a gene set much larger than the fraction of induced genes in the entire array?
14 Computing Significant Entries in the Gene-Set-By-Array Matrix Many entries in the gene-set-by-array matrix may not be statistically significant. For a given array, fraction of induced genes in a gene set may be close to the fraction of induced genes in the array. Statistical test: for a given array, is the fraction of induced genes in a gene set much larger than the fraction of induced genes in the entire array? Compute the p-value of the fraction using the hypergeometric test. Do so for every gene-set-array pair. Use false discovery rate correction to account for multiple hypotheses testing. Replace insignificant entries by 0.
15 Computing the Significance of an Entry in the Gene-Set-By-Array Matrix Let m be the number of genes in the data set. let m G be the number of genes in a gene set G. Let u a be the number of induced genes in an array a. let u G,a be the number of genes in G induced in a.
16 Computing the Significance of an Entry in the Gene-Set-By-Array Matrix Let m be the number of genes in the data set. let m G be the number of genes in a gene set G. Let u a be the number of induced genes in an array a. let u G,a be the number of genes in G induced in a. Informally, u G,a /m G u a /m is not statistically significant.
17 Computing the Significance of an Entry in the Gene-Set-By-Array Matrix Let m be the number of genes in the data set. let m G be the number of genes in a gene set G. Let u a be the number of induced genes in an array a. let u G,a be the number of genes in G induced in a. Informally, u G,a /m G u a /m is not statistically significant. Formally, what is the probability that if we pick m G genes at random from m genes, we will select u G,a or more that are induced in a?
18 Computing the Significance of an Entry in the Gene-Set-By-Array Matrix Let m be the number of genes in the data set. let m G be the number of genes in a gene set G. Let u a be the number of induced genes in an array a. let u G,a be the number of genes in G induced in a. Informally, u G,a /m G u a /m is not statistically significant. Formally, what is the probability that if we pick m G genes at random from m genes, we will select u G,a or more that are induced in a? i u G,a
19 Computing the Significance of an Entry in the Gene-Set-By-Array Matrix Let m be the number of genes in the data set. let m G be the number of genes in a gene set G. Let u a be the number of induced genes in an array a. let u G,a be the number of genes in G induced in a. Informally, u G,a /m G u a /m is not statistically significant. Formally, what is the probability that if we pick m G genes at random from m genes, we will select u G,a or more that are induced in a? i u G,a ( ua )( m ua i m G i ( m m G ) )
20 If this probability is at most a user-specified threshold, we deem that entry to be statistically significant. Computing the Significance of an Entry in the Gene-Set-By-Array Matrix Let m be the number of genes in the data set. let m G be the number of genes in a gene set G. Let u a be the number of induced genes in an array a. let u G,a be the number of genes in G induced in a. Informally, u G,a /m G u a /m is not statistically significant. Formally, what is the probability that if we pick m G genes at random from m genes, we will select u G,a or more that are induced in a? i u G,a ( ua )( m ua i m G i ( m m G ) )
21 Hierarchical Clustering Start from a gene-set-by-array matrix containing fraction of induced/repressed genes. Fraction is negative if repressed. Apply bottom-up hierarchical clustering. Vector at internal node is
22 Hierarchical Clustering Start from a gene-set-by-array matrix containing fraction of induced/repressed genes. Fraction is negative if repressed. Apply bottom-up hierarchical clustering. Vector at internal node is average of vectors at descendant leaves.
23 Hierarchical Clustering Start from a gene-set-by-array matrix containing fraction of induced/repressed genes. Fraction is negative if repressed. Apply bottom-up hierarchical clustering. Vector at internal node is average of vectors at descendant leaves. Which nodes do we select as clusters in the tree?
24 Hierarchical Clustering Start from a gene-set-by-array matrix containing fraction of induced/repressed genes. Fraction is negative if repressed. Apply bottom-up hierarchical clustering. Vector at internal node is average of vectors at descendant leaves. Which nodes do we select as clusters in the tree? Associate each interior node with Pearson correlation between the two children. Cluster node whose Pearson correlation differs by more than 0.05 from the Pearson correlation of its parent.
25 Turning Clusters into Modules Each cluster is the union of descendant gene sets (leaves). Module Cluster minus genes whose expression is not consistent with the rest of the cluster.
26 Testing Consistency of a Gene with a Gene Set Let g be the gene and G be the gene set G.
27 Testing Consistency of a Gene with a Gene Set Let g be the gene and G be the gene set G. Let I (respectively, R) be the set of arrays in which G is significantly induced (respectively, repressed). For an array a in I (or R), let p a be the fraction of genes that are induced (or repressed) by two-fold or more in a.
28 Testing Consistency of a Gene with a Gene Set Let g be the gene and G be the gene set G. Let I (respectively, R) be the set of arrays in which G is significantly induced (respectively, repressed). For an array a in I (or R), let p a be the fraction of genes that are induced (or repressed) by two-fold or more in a. Measure extent to which g s expression changed by more (or less) than two-fold in the arrays in I (or R):
29 Testing Consistency of a Gene with a Gene Set Let g be the gene and G be the gene set G. Let I (respectively, R) be the set of arrays in which G is significantly induced (respectively, repressed). For an array a in I (or R), let p a be the fraction of genes that are induced (or repressed) by two-fold or more in a. Measure extent to which g s expression changed by more (or less) than two-fold in the arrays in I (or R): Score(g) = log(p a )+ log(p a ) a I g is induced in a a R g is repressed in a
30 Testing Consistency of a Gene with a Gene Set Let g be the gene and G be the gene set G. Let I (respectively, R) be the set of arrays in which G is significantly induced (respectively, repressed). For an array a in I (or R), let p a be the fraction of genes that are induced (or repressed) by two-fold or more in a. Measure extent to which g s expression changed by more (or less) than two-fold in the arrays in I (or R): Score(g) = log(p a )+ log(p a ) a I g is induced in a a R g is repressed in a No contribution from an array in I (or R) is g is not induced (or not repressed) in a. Larger contribution from arrays with fewer induced genes. Compute statistical significance of this score.
31 Computing Statistical Significance of Score(g) Score(g) = log(p a ) + log(p a ) a I g is induced in a a R g is repressed in a
32 Computing Statistical Significance of Score(g) Score(g) = a I g is induced in a log(p a ) + a R g is repressed in a log(p a ) Null hypotheses: genes in each array are randomly permuted, i.e., the p a induced genes in an array a I are chosen randomly.
33 Computing Statistical Significance of Score(g) Score(g) = a I g is induced in a log(p a ) + a R g is repressed in a log(p a ) Null hypotheses: genes in each array are randomly permuted, i.e., the p a induced genes in an array a I are chosen randomly. Each element in Score(g) is an independent binary random variable. Random variable takes the value log(p a ) with probability p a and the value 0 with the probability 1 p a.
34 Computing Statistical Significance of Score(g) Score(g) = a I g is induced in a log(p a ) + a R g is repressed in a log(p a ) Null hypotheses: genes in each array are randomly permuted, i.e., the p a induced genes in an array a I are chosen randomly. Each element in Score(g) is an independent binary random variable. Random variable takes the value log(p a ) with probability p a and the value 0 with the probability 1 p a. Mean of Score(g) is a I R p a log p a and variance is a I R p a(1 p a ) log 2 p a.
35 Computing Statistical Significance of Score(g) Score(g) = a I g is induced in a log(p a ) + a R g is repressed in a log(p a ) Null hypotheses: genes in each array are randomly permuted, i.e., the p a induced genes in an array a I are chosen randomly. Each element in Score(g) is an independent binary random variable. Random variable takes the value log(p a ) with probability p a and the value 0 with the probability 1 p a. Mean of Score(g) is a I R p a log p a and variance is a I R p a(1 p a ) log 2 p a. Central limit theorem that the distribution of Score(g) is well-approximated by a Gaussian distribution with this mean and variance. Assess statistical significance by computing the tail of this Gaussian.
36 Further Analysis Statistical significance of computed modules using leave-one-out cross validation (read supplement). Compute enrichment of clinical annotations of the arrays in a module. Visualisation of modules. Literature-based analysis of modules
37 Conclusions Used pre-defined gene sets to drive hierarchical clustering algorithm. Remove genes from a cluster of gene sets if the gene s expression profile deviates from the cluster. Automatically decide which arrays are part of a module. Natural segue into lectures on biclustering where we will automatically decide which arrays and which genes to include in a bicluster.
Gene Expression Data Analysis
 Gene Expression Data Analysis Bing Zhang Department of Biomedical Informatics Vanderbilt University bing.zhang@vanderbilt.edu BMIF 310, Fall 2009 Gene expression technologies (summary) Hybridization-based
Statistical Methods for Network Analysis of Biological Data
 The Protein Interaction Workshop, 8 12 June 2015, IMS Statistical Methods for Network Analysis of Biological Data Minghua Deng, dengmh@pku.edu.cn School of Mathematical Sciences Center for Quantitative
BIOINF/BENG/BIMM/CHEM/CSE 184: Computational Molecular Biology. Lecture 2: Microarray analysis
 BIOINF/BENG/BIMM/CHEM/CSE 184: Computational Molecular Biology Lecture 2: Microarray analysis Genome wide measurement of gene transcription using DNA microarray Bruce Alberts, et al., Molecular Biology
Exam 1 from a Past Semester
 Exam from a Past Semester. Provide a brief answer to each of the following questions. a) What do perfect match and mismatch mean in the context of Affymetrix GeneChip technology? Be as specific as possible
Aliving cell is a complex system that needs to perform various functions and adapt to changing
 JOURNAL OF COMPUTATIONAL BIOLOGY Volume 12, Number 7, 2005 Mary Ann Liebert, Inc. Pp. 909 927 Probabilistic Discovery of Overlapping Cellular Processes and Their Regulation ALEXIS BATTLE, 1 ERAN SEGAL,
Microarray Data Analysis in GeneSpring GX 11. Month ##, 200X
 Microarray Data Analysis in GeneSpring GX 11 Month ##, 200X Agenda Genome Browser GO GSEA Pathway Analysis Network building Find significant pathways Extract relations via NLP Data Visualization Options
Bioinformatics for Biologists
 Bioinformatics for Biologists Functional Genomics: Microarray Data Analysis Fran Lewitter, Ph.D. Head, Biocomputing Whitehead Institute Outline Introduction Working with microarray data Normalization Analysis
Supporting Online Material for
 www.sciencemag.org/cgi/content/full/313/5795/1929/dc1 Supporting Online Material for The Connectivity Map: Using Gene-Expression Signatures to Connect Small Molecules, Genes, and Disease Justin Lamb, *
Microarrays & Gene Expression Analysis
 Microarrays & Gene Expression Analysis Contents DNA microarray technique Why measure gene expression Clustering algorithms Relation to Cancer SAGE SBH Sequencing By Hybridization DNA Microarrays 1. Developed
Survival Outcome Prediction for Cancer Patients based on Gene Interaction Network Analysis and Expression Profile Classification
 Survival Outcome Prediction for Cancer Patients based on Gene Interaction Network Analysis and Expression Profile Classification Final Project Report Alexander Herrmann Advised by Dr. Andrew Gentles December
10.1 The Central Dogma of Biology and gene expression
 126 Grundlagen der Bioinformatik, SS 09, D. Huson (this part by K. Nieselt) July 6, 2009 10 Microarrays (script by K. Nieselt) There are many articles and books on this topic. These lectures are based
Agilent GeneSpring GX 10: Beyond. Pam Tangvoranuntakul Product Manager, GeneSpring October 1, 2008
 Agilent GeneSpring GX 10: Gene Expression and Beyond Pam Tangvoranuntakul Product Manager, GeneSpring October 1, 2008 GeneSpring GX 10 in the News Our Goals for GeneSpring GX 10 Goal 1: Bring back GeneSpring
Lecture 11 Microarrays and Expression Data
 Introduction to Bioinformatics for Medical Research Gideon Greenspan gdg@cs.technion.ac.il Lecture 11 Microarrays and Expression Data Genetic Expression Data Microarray experiments Applications Expression
Gene Expression Data Analysis (I)
") Gene Expression Data Analysis (I) Bing Zhang Department of Biomedical Informatics Vanderbilt University bing.zhang@vanderbilt.edu Bioinformatics tasks Biological question Experiment design Microarray experiment
Gene Expression Data Analysis (I) Bing Zhang Department of Biomedical Informatics Vanderbilt University bing.zhang@vanderbilt.edu Bioinformatics tasks Biological question Experiment design Microarray experiment
EECS730: Introduction to Bioinformatics
 EECS730: Introduction to Bioinformatics Lecture 14: Microarray Some slides were adapted from Dr. Luke Huan (University of Kansas), Dr. Shaojie Zhang (University of Central Florida), and Dr. Dong Xu and
Analysis of a Tiling Regulation Study in Partek Genomics Suite 6.6
 Analysis of a Tiling Regulation Study in Partek Genomics Suite 6.6 The example data set used in this tutorial consists of 6 technical replicates from the same human cell line, 3 are SP1 treated, and 3
Scoring pathway activity from gene expression data
 Scoring pathway activity from gene expression data Jörg Rahnenführer Computational Biology and Applied Algorithmics Max Planck Institute for Informatics D-66123 Saarbrücken Germany NGFN - Courses in Practical
Analysis of Microarray Data
 Analysis of Microarray Data Lecture 3: Visualization and Functional Analysis George Bell, Ph.D. Senior Bioinformatics Scientist Bioinformatics and Research Computing Whitehead Institute Outline Review
Bioinformatics. Microarrays: designing chips, clustering methods. Fran Lewitter, Ph.D. Head, Biocomputing Whitehead Institute
 Bioinformatics Microarrays: designing chips, clustering methods Fran Lewitter, Ph.D. Head, Biocomputing Whitehead Institute Course Syllabus Jan 7 Jan 14 Jan 21 Jan 28 Feb 4 Feb 11 Feb 18 Feb 25 Sequence
Package GOGANPA. February 19, 2015
 Package GOGANPA February 19, 2015 Type Package Title GO-Functional-Network-based Gene-Set-Analysis Version 1.0 Date 2011-12-30 Author Maintainer Accounting for genes' functional-non-equivalence
Enhanced Biclustering on Expression Data
 Enhanced Biclustering on Expression Data Jiong Yang Haixun Wang Wei Wang Philip Yu UIUC IBM T. J. Watson UNC Chapel Hill IBM T. J. Watson jioyang@cs.uiuc.edu haixun@us.ibm.com weiwang@cs.unc.edu psyu@us.ibm.com
Introduction to Bioinformatics. Fabian Hoti 6.10.
 Introduction to Bioinformatics Fabian Hoti 6.10. Analysis of Microarray Data Introduction Different types of microarrays Experiment Design Data Normalization Feature selection/extraction Clustering Introduction
Package TIN. March 19, 2019
 Type Package Title Transcriptome instability analysis Version 1.14.0 Date 2014-07-14 Package TIN March 19, 2019 Author Bjarne Johannessen, Anita Sveen and Rolf I. Skotheim Maintainer Bjarne Johannessen
Microarray Experiment Design
 Microarray Experiment Design Samples used, extract preparation and labelling: AML blasts were isolated from bone marrow by centrifugation on a Ficoll- Hypaque gradient. Total RNA was extracted using TRIzol
Identification of biological themes in microarray data from a mouse heart development time series using GeneSifter
 Identification of biological themes in microarray data from a mouse heart development time series using GeneSifter VizX Labs, LLC Seattle, WA 98119 Abstract Oligonucleotide microarrays were used to study
advanced analysis of gene expression microarray data aidong zhang World Scientific State University of New York at Buffalo, USA
 advanced analysis of gene expression microarray data aidong zhang State University of New York at Buffalo, USA World Scientific NEW JERSEY LONDON SINGAPORE BEIJING SHANGHAI HONG KONG TAIPEI CHENNAI Contents
Supplementary Figures Supplementary Figure 1
 Supplementary Figures Supplementary Figure 1 Supplementary Figure 1 COMSOL simulation demonstrating flow characteristics in hydrodynamic trap structures. (a) Flow field within the hydrodynamic traps before
CSC 2427: Algorithms in Molecular Biology Lecture #14
 CSC 2427: Algorithms in Molecular Biology Lecture #14 Lecturer: Michael Brudno Scribe Note: Hyonho Lee Department of Computer Science University of Toronto 03 March 2006 Microarrays Revisited In the last
Gene expression: Microarray data analysis. Copyright notice. Outline: microarray data analysis. Schedule
 Gene expression: Microarray data analysis Copyright notice Many of the images in this powerpoint presentation are from Bioinformatics and Functional Genomics by Jonathan Pevsner (ISBN -47-4-8). Copyright
Gene expression analysis. Biosciences 741: Genomics Fall, 2013 Week 5. Gene expression analysis
 Gene expression analysis Biosciences 741: Genomics Fall, 2013 Week 5 Gene expression analysis From EST clusters to spotted cdna microarrays Long vs. short oligonucleotide microarrays vs. RT-PCR Methods
QLUCORE: Novel platform for protein microarray
 QLUCORE: Novel platform for protein microarray data analysis Manuel Fuentes Centro de Investigación del Cáncer Madrid, Spain mfuentes@usal.es QLUCORE: Novel Platform for protein microarray data analysis
Outline. Analysis of Microarray Data. Most important design question. General experimental issues
 Outline Analysis of Microarray Data Lecture 1: Experimental Design and Data Normalization Introduction to microarrays Experimental design Data normalization Other data transformation Exercises George Bell,
First steps in signal-processing level models of genetic networks: identifying response pathways and clusters of coexpressed genes
 First steps in signal-processing level models of genetic networks: identifying response pathways and clusters of coexpressed genes Olga Troyanskaya lecture for cheme537/cs554 some slides borrowed from
Introduction to Microarray Technique, Data Analysis, Databases Maryam Abedi PhD student of Medical Genetics
 Introduction to Microarray Technique, Data Analysis, Databases Maryam Abedi PhD student of Medical Genetics abedi777@ymail.com Outlines Technology Basic concepts Data analysis Printed Microarrays In Situ-Synthesized
Introduction to Bioinformatics: Chapter 11: Measuring Expression of Genome Information
 HELSINKI UNIVERSITY OF TECHNOLOGY LABORATORY OF COMPUTER AND INFORMATION SCIENCE Introduction to Bioinformatics: Chapter 11: Measuring Expression of Genome Information Jarkko Salojärvi Lecture slides by
Inferring Cellular Networks Using Probabilis6c Graphical Models. Jianlin Cheng, PhD University of Missouri 2010
 Inferring Cellular Networks Using Probabilis6c Graphical Models Jianlin Cheng, PhD University of Missouri 2010 Bayesian Network So@ware hap://www.cs.ubc.ca/~murphyk/so@ware/ BNT/bnso@.html Demo References
less sensitive than RNA-seq but more robust analysis pipelines expensive but quantitiatve standard but typically not high throughput
 Chapter 11: Gene Expression The availability of an annotated genome sequence enables massively parallel analysis of gene expression. The expression of all genes in an organism can be measured in one experiment.
MFMS: Maximal Frequent Module Set mining from multiple human gene expression datasets
 MFMS: Maximal Frequent Module Set mining from multiple human gene expression datasets Saeed Salem North Dakota State University Cagri Ozcaglar Amazon 8/11/2013 Introduction Gene expression analysis Use
Introduction Reference System Requirements GIST (Gibbs sampler Infers Signal Transduction)... 4
... 4") IMPACT user manual Introduction... 3 Reference... 3 System Requirements... 3 GIST (Gibbs sampler Infers Signal Transduction)... 4 Framework... 4 Input Files... 5 Key Functions and Usage... 6 Output files...
IMPACT user manual Introduction... 3 Reference... 3 System Requirements... 3 GIST (Gibbs sampler Infers Signal Transduction)... 4 Framework... 4 Input Files... 5 Key Functions and Usage... 6 Output files...
Finding Large Average Submatrices in High Dimensional Data
 Finding Large Average Submatrices in High Dimensional Data Shabalin, A. 1, Weigman V.J. 2, Perou C.M. 3,4,5, Nobel A.B. 1,3 September 17, 2008 1 Department of Statistics and Operations Research, University
Compendium of Immune Signatures Identifies Conserved and Species-Specific Biology in Response to Inflammation
 Immunity Supplemental Information Compendium of Immune Signatures Identifies Conserved and Species-Specific Biology in Response to Inflammation Jernej Godec, Yan Tan, Arthur Liberzon, Pablo Tamayo, Sanchita
Bioinformatics for Biologists
 Bioinformatics for Biologists Microarray Data Analysis: Lecture 2. Fran Lewitter, Ph.D. Director Bioinformatics and Research Computing Whitehead Institute Outline Introduction Working with microarray data
Cell Stem Cell, volume 9 Supplemental Information
 Cell Stem Cell, volume 9 Supplemental Information Large-Scale Analysis Reveals Acquisition of Lineage-Specific Chromosomal Aberrations in Human Adult Stem Cells Uri Ben-David, Yoav Mayshar, and Nissim
1 Najafabadi, H. S. et al. C2H2 zinc finger proteins greatly expand the human regulatory lexicon. Nat Biotechnol doi: /nbt.3128 (2015).
.") F op-scoring motif Optimized motifs E Input sequences entral 1 bp region Dinucleotideshuffled seqs B D ll B1H-R predicted motifs Enriched B1H- R predicted motifs L!=!7! L!=!6! L!=5! L!=!4! L!=!3! L!=!2!
F op-scoring motif Optimized motifs E Input sequences entral 1 bp region Dinucleotideshuffled seqs B D ll B1H-R predicted motifs Enriched B1H- R predicted motifs L!=!7! L!=!6! L!=5! L!=!4! L!=!3! L!=!2!
Bioinformatics for Biologists
 Bioinformatics for Biologists Microarray Data Analysis. Lecture 1. Fran Lewitter, Ph.D. Director Bioinformatics and Research Computing Whitehead Institute Outline Introduction Working with microarray data
Analysis of Microarray Data
 Analysis of Microarray Data Lecture 1: Experimental Design and Data Normalization George Bell, Ph.D. Senior Bioinformatics Scientist Bioinformatics and Research Computing Whitehead Institute Outline Introduction
Homework : Data Mining. Due at the start of class Friday, 25 September 2009
 Homework 4 36-350: Data Mining Due at the start of class Friday, 25 September 2009 This homework set applies methods we have developed so far to a medical problem, gene expression in cancer. In some questions
Some Principles for the Design and Analysis of Experiments using Gene Expression Arrays and Other High-Throughput Assay Methods
 Some Principles for the Design and Analysis of Experiments using Gene Expression Arrays and Other High-Throughput Assay Methods SPH 247 Statistical Analysis of Laboratory Data April 21, 2015 1 The -Omics
Comp/Phys/Mtsc 715. Example Videos. Administrative 4/12/2012. Bioinformatics Visualization. Vis 2005, Bertram. Vis 2005, Cantarel(tighten.
 Comp/Phys/Mtsc 715 Bioinformatics Visualization Example Videos Vis 2005, Bertram Visualizing sound wavefront propagation Vis 2005, Cantarel(tighten.mov) Visualizing self contact in tightening knots Administrative
Inferring Gene Networks from Microarray Data using a Hybrid GA p.1
 Inferring Gene Networks from Microarray Data using a Hybrid GA Mark Cumiskey, John Levine and Douglas Armstrong johnl@inf.ed.ac.uk http://www.aiai.ed.ac.uk/ johnl Institute for Adaptive and Neural Computation
An Evaluation of a System that Recommends Microarray Experiments to Perform to Discover Gene-Regulation Pathways
 An Evaluation of a System that Recommends Microarray Experiments to Perform to Discover Gene-Regulation Pathways Changwon Yoo cwyoo@vbi.vt.edu / Tel: 540-231-2100 Virginia Bioinformatics Institute, Virginia
Analyzing Gene Expression Time Series CS 229 Fall 2011 Final Project
 Analyzing Gene Expression Time Series CS 229 Fall 2011 Final Project Marco Cusumano-Towner Advised by Sofia Kyriazopoulou-Panagiotopoulou December 16, 2011 1 Introduction There are approximately twenty-thousand
HISTORICAL LINGUISTICS AND MOLECULAR ANTHROPOLOGY
 Third Pavia International Summer School for Indo-European Linguistics, 7-12 September 2015 HISTORICAL LINGUISTICS AND MOLECULAR ANTHROPOLOGY Brigitte Pakendorf, Dynamique du Langage, CNRS & Université
Gene List Enrichment Analysis
 Outline Gene List Enrichment Analysis George Bell, Ph.D. BaRC Hot Topics March 16, 2010 Why do enrichment analysis? Main types Selecting or ranking genes Annotation sources Statistics Remaining issues
Combining ANOVA and PCA in the analysis of microarray data
 Combining ANOVA and PCA in the analysis of microarray data Lutgarde Buydens IMM, Analytical chemistry Radboud University Nijmegen, the Netherlands Scientific Staff: PhD students: External PhD: Post doc:
Preprocessing Methods for Two-Color Microarray Data
 Preprocessing Methods for Two-Color Microarray Data 1/15/2011 Copyright 2011 Dan Nettleton Preprocessing Steps Background correction Transformation Normalization Summarization 1 2 What is background correction?
Some Principles for the Design and Analysis of Experiments using Gene Expression Arrays and Other High-Throughput Assay Methods
 Some Principles for the Design and Analysis of Experiments using Gene Expression Arrays and Other High-Throughput Assay Methods EPP 245/298 Statistical Analysis of Laboratory Data October 11, 2005 1 The
BIOINFORMATICS. Continuous Hidden Process Model for Time Series Expression Experiments
 BIOINFORMATICS Vol. no. 25 Pages 8 Continuous Hidden Process Model for Time Series Expression Experiments Yanxin Shi a, Michael Klustein b, Itamar Simon b, Tom Mitchell a, Ziv Bar-Joseph a a School of
From Promoter Sequence to Expression: A Probabilistic Framework
 From Promoter Sequence to Expression: A Probabilistic Framework Eran Segal omputer Science Department Stanford University Stanford, A 94305-9010 eran@cs.stanford.edu Nir Friedman School of omputer Science
SUPPLEMENTARY INFORMATION
 18Pura Brain Liver 2 kb 9Mtmr Heart Brain 1.4 kb 15Ppara 1.5 kb IPTpcc 1.3 kb GAPDH 1.5 kb IPGpr1 2 kb GAPDH 1.5 kb 17Tcte 13Elov12 Lung Thymus 6 kb 5 kb 17Tbcc Kidney Embryo 4.5 kb 3.7 kb GAPDH 1.5 kb
Analysis of Microarray Data
 Analysis of Microarray Data Lecture 3: Visualization and Functional Analysis George Bell, Ph.D. Bioinformatics Scientist Bioinformatics and Research Computing Whitehead Institute Outline Review Visualizing
Some Principles for the Design and Analysis of Experiments using Gene Expression Arrays and Other High-Throughput Assay Methods
 Some Principles for the Design and Analysis of Experiments using Gene Expression Arrays and Other High-Throughput Assay Methods BST 226 Statistical Methods for Bioinformatics January 8, 2014 1 The -Omics
Seven Keys to Successful Microarray Data Analysis
 Seven Keys to Successful Microarray Data Analysis Experiment Design Platform Selection Data Management System Access Differential Expression Biological Significance Data Publication Type of experiment
V3 differential gene expression analysis
 differential gene expression analysis - What is measured by microarrays? - Microarray normalization - Differential gene expression (DE) analysis based on microarray data - Detection of outliers - RNAseq
New Statistical Algorithms for Monitoring Gene Expression on GeneChip Probe Arrays
 GENE EXPRESSION MONITORING TECHNICAL NOTE New Statistical Algorithms for Monitoring Gene Expression on GeneChip Probe Arrays Introduction Affymetrix has designed new algorithms for monitoring GeneChip
Microarray Technique. Some background. M. Nath
 Microarray Technique Some background M. Nath Outline Introduction Spotting Array Technique GeneChip Technique Data analysis Applications Conclusion Now Blind Guess? Functional Pathway Microarray Technique
Consensus and Meta-analysis Regulatory Networks for Combining Multiple Microarray Gene Expression Datasets
 Consensus and Meta-analysis Regulatory Networks for Combining Multiple Microarray Gene Expression Datasets Emma Steele and Allan Tucker Centre for Intelligent Data Analysis Brunel University Corresponding
Humboldt Universität zu Berlin. Grundlagen der Bioinformatik SS Microarrays. Lecture
 Humboldt Universität zu Berlin Microarrays Grundlagen der Bioinformatik SS 2017 Lecture 6 09.06.2017 Agenda 1.mRNA: Genomic background 2.Overview: Microarray 3.Data-analysis: Quality control & normalization
Measuring gene expression
 Measuring gene expression Grundlagen der Bioinformatik SS2018 https://www.youtube.com/watch?v=v8gh404a3gg Agenda Organization Gene expression Background Technologies FISH Nanostring Microarrays RNA-seq
dmgwas: dense module searching for genome wide association studies in protein protein interaction network
 dmgwas: dense module searching for genome wide association studies in protein protein interaction network Peilin Jia 1,2, Siyuan Zheng 1 and Zhongming Zhao 1,2,3 1 Department of Biomedical Informatics,
Gene Expression Microarrays. For microarrays, purity of the RNA was further assessed by
 Supplemental Methods Gene Expression Microarrays. For microarrays, purity of the RNA was further assessed by an Agilent 2100 Bioanalyzer. 500 ng of RNA was reverse transcribed into crna and biotin-utp
Accurate Campaign Targeting Using Classification Algorithms
 Accurate Campaign Targeting Using Classification Algorithms Jieming Wei Sharon Zhang Introduction Many organizations prospect for loyal supporters and donors by sending direct mail appeals. This is an
Lecture 2: March 8, 2007
 Analysis of DNA Chips and Gene Networks Spring Semester, 2007 Lecture 2: March 8, 2007 Lecturer: Rani Elkon Scribe: Yuri Solodkin and Andrey Stolyarenko 1 2.1 Low Level Analysis of Microarrays 2.1.1 Introduction
DETERMINING SIGNIFICANT FOLD DIFFERENCES IN GENE EXPRESSION ANALYSIS
 DETERMINING SIGNIFICANT FOLD DIFFERENCES IN GENE EXPRESSION ANALYSIS A. J. BUTTE 1, J. YE, G. NIEDERFELLNER 3, K. RETT 3, H. U. HÄRING 3, M. F. WHITE, I. S. KOHANE 1 1 Children s Hospital Informatics Program,
Lees J.A., Vehkala M. et al., 2016 In Review
 Sequence element enrichment analysis to determine the genetic basis of bacterial phenotypes Lees J.A., Vehkala M. et al., 2016 In Review Journal Club Triinu Kõressaar 16.03.2016 Introduction Bacterial
A Propagation-based Algorithm for Inferring Gene-Disease Associations
 A Propagation-based Algorithm for Inferring Gene-Disease Associations Oron Vanunu Roded Sharan Abstract: A fundamental challenge in human health is the identification of diseasecausing genes. Recently,
CSE182-L16. LW statistics/assembly
 CSE182-L16 LW statistics/assembly Silly Quiz Who are these people, and what is the occasion? Genome Sequencing and Assembly Sequencing A break at T is shown here. Measuring the lengths using electrophoresis
Accelerating Gene Set Enrichment Analysis on CUDA-Enabled GPUs. Bertil Schmidt Christian Hundt
 Accelerating Gene Set Enrichment Analysis on CUDA-Enabled GPUs Bertil Schmidt Christian Hundt Contents Gene Set Enrichment Analysis (GSEA) Background Algorithmic details cudagsea Performance evaluation
An Association Analysis Approach to Biclustering
 An Association Analysis Approach to Biclustering Gaurav Pandey, Gowtham Atluri, Michael Steinbach, Chad L. Myers and Vipin Kumar Department of Computer Science & Engineering, University of Minnesota, Minneapolis,
MulCom: a Multiple Comparison statistical test for microarray data in Bioconductor.
 MulCom: a Multiple Comparison statistical test for microarray data in Bioconductor. Claudio Isella, Tommaso Renzulli, Davide Corà and Enzo Medico May 3, 2016 Abstract Many microarray experiments compare
QTL mapping in mice. Karl W Broman. Department of Biostatistics Johns Hopkins University Baltimore, Maryland, USA.
 QTL mapping in mice Karl W Broman Department of Biostatistics Johns Hopkins University Baltimore, Maryland, USA www.biostat.jhsph.edu/ kbroman Outline Experiments, data, and goals Models ANOVA at marker
Computational Approaches to Analysis of DNA Microarray Data
 2006 IMI and Schattauer GmbH 91 Computational pproaches to nalysis of DN Microarray Data J. Quackenbush Department of Biostatistics and Computational Biology, Dana-Farber Cancer Institute and Department
Basic aspects of Microarray Data Analysis
 Hospital Universitari Vall d Hebron Institut de Recerca - VHIR Institut d Investigació Sanitària de l Instituto de Salud Carlos III (ISCIII) Basic aspects of Microarray Data Analysis Expression Data Analysis
Effects of Different Normalization Methods on Gene Set Enrichment Analysis (GSEA)
") Effects of Different Normalization Methods on Gene Set Enrichment Analysis (GSEA) Ming Zhao Tutor: Dr. Mengjin Zhu 12th, Nov, 2011 Key Laboratory of Agricultural Animal Genetics, Breeding and Reproduction
Effects of Different Normalization Methods on Gene Set Enrichment Analysis (GSEA) Ming Zhao Tutor: Dr. Mengjin Zhu 12th, Nov, 2011 Key Laboratory of Agricultural Animal Genetics, Breeding and Reproduction
Suberoylanilide Hydroxamic Acid Treatment Reveals. Crosstalks among Proteome, Ubiquitylome and Acetylome
 Suberoylanilide Hydroxamic Acid Treatment Reveals Crosstalks among Proteome, Ubiquitylome and Acetylome in Non-Small Cell Lung Cancer A549 Cell Line Quan Wu 1, Zhongyi Cheng 2, Jun Zhu 3, Weiqing Xu 1,
CS 5984: Topics and Schedule
 CS 5984: and Schedule T. M. Murali January 19, 2006 T. M. Murali January 19, 2006 CS 5984: and Schedule Continuum of Models in Systems Biology From Building with a scaffold: emerging strategies for high-
Methods for comparing multiple microbial communities. james robert white, October 1 st, 2007
 Methods for comparing multiple microbial communities. james robert white, whitej@umd.edu Advisor: Mihai Pop, mpop@umiacs.umd.edu October 1 st, 2007 Abstract We propose the development of new software to
Computational Biology I
 Computational Biology I Microarray data acquisition Gene clustering Practical Microarray Data Acquisition H. Yang From Sample to Target cdna Sample Centrifugation (Buffer) Cell pellets lyse cells (TRIzol)
Workshop on Data Science in Biomedicine
 Workshop on Data Science in Biomedicine July 6 Room 1217, Department of Mathematics, Hong Kong Baptist University 09:30-09:40 Welcoming Remarks 9:40-10:20 Pak Chung Sham, Centre for Genomic Sciences, The
Lecture 8: Predicting and analyzing metagenomic composition from 16S survey data
 Lecture 8: Predicting and analyzing metagenomic composition from 16S survey data What can we tell about the taxonomic and functional stability of microbiota? Why? Nature. 2012; 486(7402): 207 214. doi:10.1038/nature11234
Robust Prediction of Expression Differences among Human Individuals Using Only Genotype Information
 Robust Prediction of Expression Differences among Human Individuals Using Only Genotype Information Ohad Manor 1,2, Eran Segal 1,2 * 1 Department of Computer Science and Applied Mathematics, Weizmann Institute
Analysis of Microarray Data
 Analysis of Microarray Data Lecture 1: Experimental Design and Data Normalization George Bell, Ph.D. Senior Bioinformatics Scientist Bioinformatics and Research Computing Whitehead Institute Outline Introduction
Lab 1: A review of linear models
 Lab 1: A review of linear models The purpose of this lab is to help you review basic statistical methods in linear models and understanding the implementation of these methods in R. In general, we need
CS302 - Data Structures using C++
 CS302 - Data Structures using C++ Topic: Balanced Search Trees Kostas Alexis Balanced Search Trees Height of binary search tree Sensitive to order of additions and removals Various search trees can retain
Lecture 7: April 7, 2005
 Analysis of Gene Expression Data Spring Semester, 2005 Lecture 7: April 7, 2005 Lecturer: R.Shamir and C.Linhart Scribe: A.Mosseri, E.Hirsh and Z.Bronstein 1 7.1 Promoter Analysis 7.1.1 Introduction to
Downstream analysis of transcriptomic data
 Downstream analysis of transcriptomic data Shamith Samarajiwa CRUK Bioinforma3cs Summer School July 2015 General Methods Dimensionality reduc3on methods (clustering, PCA, MDS) Visualizing PaKerns (heatmaps,
10. Lecture Stochastic Optimization
 Soft Control (AT 3, RMA) 10. Lecture Stochastic Optimization Genetic Algorithms 10. Structure of the lecture 1. Soft control: the definition and limitations, basics of epert" systems 2. Knowledge representation
Methods and tools for exploring functional genomics data
 Methods and tools for exploring functional genomics data William Stafford Noble Department of Genome Sciences Department of Computer Science and Engineering University of Washington Outline Searching for
STATISTICAL CHALLENGES IN GENE DISCOVERY
 STATISTICAL CHALLENGES IN GENE DISCOVERY THROUGH MICROARRAY DATA ANALYSIS 1 Central Tuber Crops Research Institute,Kerala, India 2 Dept. of Statistics, St. Thomas College, Pala, Kerala, India email:sreejyothi
Introduction to microarrays
 Bayesian modelling of gene expression data Alex Lewin Sylvia Richardson (IC Epidemiology) Tim Aitman (IC Microarray Centre) Philippe Broët (INSERM, Paris) In collaboration with Anne-Mette Hein, Natalia