Cationic Vector Intercalation into the Lipid Membrane Enables Intact Polyplex DNA Escape from Endosomes for Gene Delivery
|
|
|
- Loren Gilmore
- 6 years ago
- Views:
Transcription
1 Cationic Vector Intercalation into the Lipid Membrane Enables Intact Polyplex DNA Escape from Endosomes for Gene Delivery Sriram Vaidyanathan, 1 Junjie Chen, 2 Bradford G. Orr, 3 Mark M. Banaszak Holl 1,2 Departments of Biomedical Engineering 1, Chemistry 2 and Applied Physics 3 University of Michigan, Ann Arbor, MI Figure S1. Summary of oligonucleotide molecular beacon (OMB) probe response as a function of structural state and excitation wavelength. (a) Intact beacon shows both FRET red emission ( nm) and green emission ( nm) when excited by 488 nm laser.(b) Excitation of intact beacon by 594 nm laser allows quantification of cleaved beacon by providing a non-fret level of emission from the AF594 dye. (c) Cleaved beacon exhibits green emission ( nm) upon 488 nm laser excitation. (d) Cleaved beacon exhibits red emission ( nm) upon 594 nm laser excitation. Quantifying FRET: Several indices to quantify FRET (Intactness, I) using intensities of the FRET donor and acceptor have been described in the past. 9 These include equations A and 1: I = I D ex,aem I Dex,Aem +I Dex,Dem 100 (A) I = I D ex,aem I noise I A ex,aem 100 (1) In the subscripts A denotes FRET acceptor (AF594), D denotes FRET donor (AF488), ex denotes excitation and em denotes emission. For example, I D ex, A em means donor (AF488) is excited and emission from acceptor (AF594) is measured. Preliminary studies indicated that the Intactness measured using the equation A was dependent on the polymer used to make polyplexes. This difference is due to the fact that AF594 but not AF 488 was quenched significantly by jetpei (Figure S2a, S2b). However, the Intactness measured using equation 1 was insensitive to quenching by the
2 polymers (Figure S2b) since equation 1 uses only the intensities of the acceptor emission. Hence, all subsequent work uses equation 1 to quantify FRET. Figure S2: OMB FRET in the presence of polymers. (a) A decrease in fluorescence emission in the nm range is observed for beacons containing only AF488 in the presence of jet PEI or G5 PAMAM (485 nm excitation).(b) An increase in fluorescence emission in the nm range is observed for beacons containing only AF 594 in the presence of G5 PAMAM (590 nm excitation). (c) FRET from free OMB as well as OMB in mixed polyplexes containing a 1:1 mixture of pdna and OMB were measured. Equation 1 was used to quantify FRET because it is unchanged by the changes in emission of AF594 induced by the vectors. As shown in panel C, this method showed similar FRET in the presence of both jetpei and G5 PAMAM vectors. OMB in polyplexes presented a 35% reduction in FRET. (d) The FRET from the OMB was also tested in the presence and absence of pdna. The presence of the pdna resulted in a 20% reduction in FRET, which may partially account for the reduction in FRET seen in polyplexes.
. Lane a shows 1 kb DNA ladder.")

3 Figure S3: Gel electrophoresis of pdna, OMB and polyplexes in 0.9% agarose gel. The gel was run at 60 V for 2 h and 15 minutes in TAE buffer. Polyplexes contained 0.5 µg of pdna and 0.5 µg of OMB. The aliquot added to well contained 0.2 µg of DNA (pdna + OMB). Lane a shows 1 kb DNA ladder. pdna in lane b shows two bands. It is likely that one of the bands represents supercoiled pdna. OMB in lane c migrated the furthest. Results from lanes d-i show that both jetpei and G5 PAMAM completely complex pdna and OMB at N:P = 2 as they do not migrate far in the lanes. Moreover, the results also show that the OMB and pdna travel together in the polyplexes.
 The excitation of the solution using a 488nm laser resulted in emission in the 525-580 nm channel.")
4 Figure S4: OMB was dissolved in 1X - S1 nuclease buffer and the fluorescence assessed using a microscope. Color bar on the left indicates intensity of emission. (a) The excitation of the solution using a 488nm laser resulted in emission in the nm channel. (b) When excited using the 488 nm laser, OMB emission was also observed in the nm channel as expected. (c) The emission of AF 594 excited using a 594 nm laser was also measured. (d) When S1 nuclease was added to the same droplet, AF488 emission increased since energy was no longer being transferred by FRET. (e) FRET emission by AF594 also reduced to ~ 0 after the addition of S1 nuclease. (f) AF594 emission due to excitation by 594 nm laser did not change. FRET from Cleaved Beacons A factor that could confound the experiments is the possibility that cleaved beacons are held together by the polymer resulting in a FRET signal. To test for this possibility, cells were incubated with polyplexes containing both single labeled AF488 and AF594. Figures S6 and S6 show that polyplexes made using a mixture of singly labeled beacons containing AF488 and AF594 can exhibit some FRET signal. However, the Intactness for these samples was 3 compared with 7-10 for jetpei and G5 PAMAM beacons at 4h. Thus our controls confirm that the results obtained from the flow cytometry experiments and confocal experiments were representative of beacon cleavage within the cell.

5 Figure S5: FRET from mixed jetpei polyplexes containing AF488 and AF594. FRET may occur between AF 488 and AF 594 from neighboring beacon molecules when present in the polyplex and can result in an elevated measure of intactness of the beacon. To test for this possibility, controls experiments were performed in which cells were treated with polyplexes made with a mixture of singly labeled beacons containing only AF 488 dyes and AF 594 dyes (1 ug each) for 3 h. (a) AF488 emission from polyplexes. (b) AF594 emission by excitation with 488 nm. These polyplexes with a mixture of singly labeled beacons still show some FRET signal inside cells. (c) AF594 emission by excitation with 594 nm. (d) Intactness map of mixed polyplexes shows an average value of 3. (e-g) As a comparison, fluorescence from the same channels are shown for a regular OMB. (f) Average intactness for a regular OMB is 8.

 for 3 h. (a) AF488 emission from polyplexes. (b)af594 emission by excitation with 488 nm.")
6 Figure S6: FRET from mixed G5 PAMAM polyplexes containing AF488 and AF594. FRET may occur between AF 488 and AF 594 from neighboring beacon molecules when present in the polyplex and can result in an elevated measure of intactness of the beacon. To test for this possibility, controls experiments were performed in which cells were treated with polyplexes made with a mixture of singly labeled beacons containing only AF 488 dyes and AF 594 dyes ( 1 ug each) for 3 h. (a) AF488 emission from polyplexes. (b)af594 emission by excitation with 488 nm. These polyplexes with a mixture of singly labeled beacons still show some FRET signal inside cells. (c) AF594 emission by excitation with 594 nm. (d) Intactness map of mixed polyplexes shows an average value of 3. (e-g) As a comparison, fluorescence from the same channels are shown for a regular OMB. (f) Average intactness for a regular OMB is 10.


 OMB delivered using jetpei polyplexes exhibited a punctate distribution at 1 h.")
7 Figure S7. Fluorescence images from Figure 1a and 1b overlaid with transmitted light images to show cell boundaries. For both cases, majority of the fluorescence was confined within cells. Figure S8. Release and degradation of OMB over time in multiple cells. (a-f) HEK 293A cells exposed for 4 h to either G5 PAMAM polyplexes (N:P 10:1) formed using 0.5 µg OMB and 0.5 g blank pdna. OMB fluorescence was imaged using a confocal microscope. OMBs delivered using G5 PAMAM were mostly confined to vesicles and were intact in the punctate regions for 24 h. (g-l) OMB delivered using jetpei polyplexes exhibited a punctate distribution at 1 h. At 2h, 4h and 8 h, a diffuse distribution of intact OMB in the cytosol was observed which dissipated by 12 h.the OMB left in punctate spots at 12 and 24 h had a substantial fraction of intact OMBs. Scale bar represents 20 µm for all images.
8 A quantitative analysis of cytosolic DNA cleavage in a cell population Degradation of the OMB in a cell population was quantifed using flow cytometry. HEK 293A cells were incubated with G5 PAMAM and jetpei polyplexes (N:P 10:1) formed using a 1:1 mixture (0.5 g each) of OMB and blank pdna for 3 h and analyzed using flow cytometry (Figure S9) at 4 h. In order to quantify the difference in FRET intensity as function of polymer vector, the experiment was performed using a flow cytometer that contained both 488 nm and 594 nm lasers. In this experiment, cells were first exposed to the 488 nm laser and emission from nm was collected. The same cells were then exposed to a 594 nm laser and emission from nm was then collected. This allowed us to quantify FRET emission using equation 1. Results in Figure S9 show that the FRET signal from cells treated using G5 PAMAM beacons was higher than the FRET signal from cells treated using jetpei polyplexes. The Intactness (eq 1) for the OMBs formed using G5 PAMAM and jetpet at 4 h were 20% and 7%, respectively (Figure S9). Figure S10 also shows results from cells at 30 min, 4 h and 16 h after incubation with polyplexes using a different flow cytometer with only a 488 nm laser. In cells exposed to polyplexes for 16 h, the level of FRET decreased. Nevertheless, G5 PAMAM polyplexes exhibited higher FRET that jetpei polyplexes. Figure S9. OMB degradation in a population of cells. (a) HEK 293A cells treated for 4 hours with G5 PAMAM polyplexes (N:P = 10:1) formed using a 1:1 ratio of OMB and blank pdna (0.5 µg each). The x-axis shows fluorescence emission ( nm) upon 594 nm excitation. The y-axis shows the FRET fluorescence emission ( nm) signal upon 488 nm excitation. (b) HEK 293A cells treated for 4 hours with jetpei polyplexes (N:P = 10:1) formed using a 1:1 ratio of OMB and blank pdna (0.5 µg each). jetpei polyplexes (N:P 10:1) Polyplexes formed using G5 PAMAM exhibit 10x greater FRET signal than those formed with jet PEI as judged by the relative y-shift of the blue and red cell distributions.
 upon 488 nm excitation.")
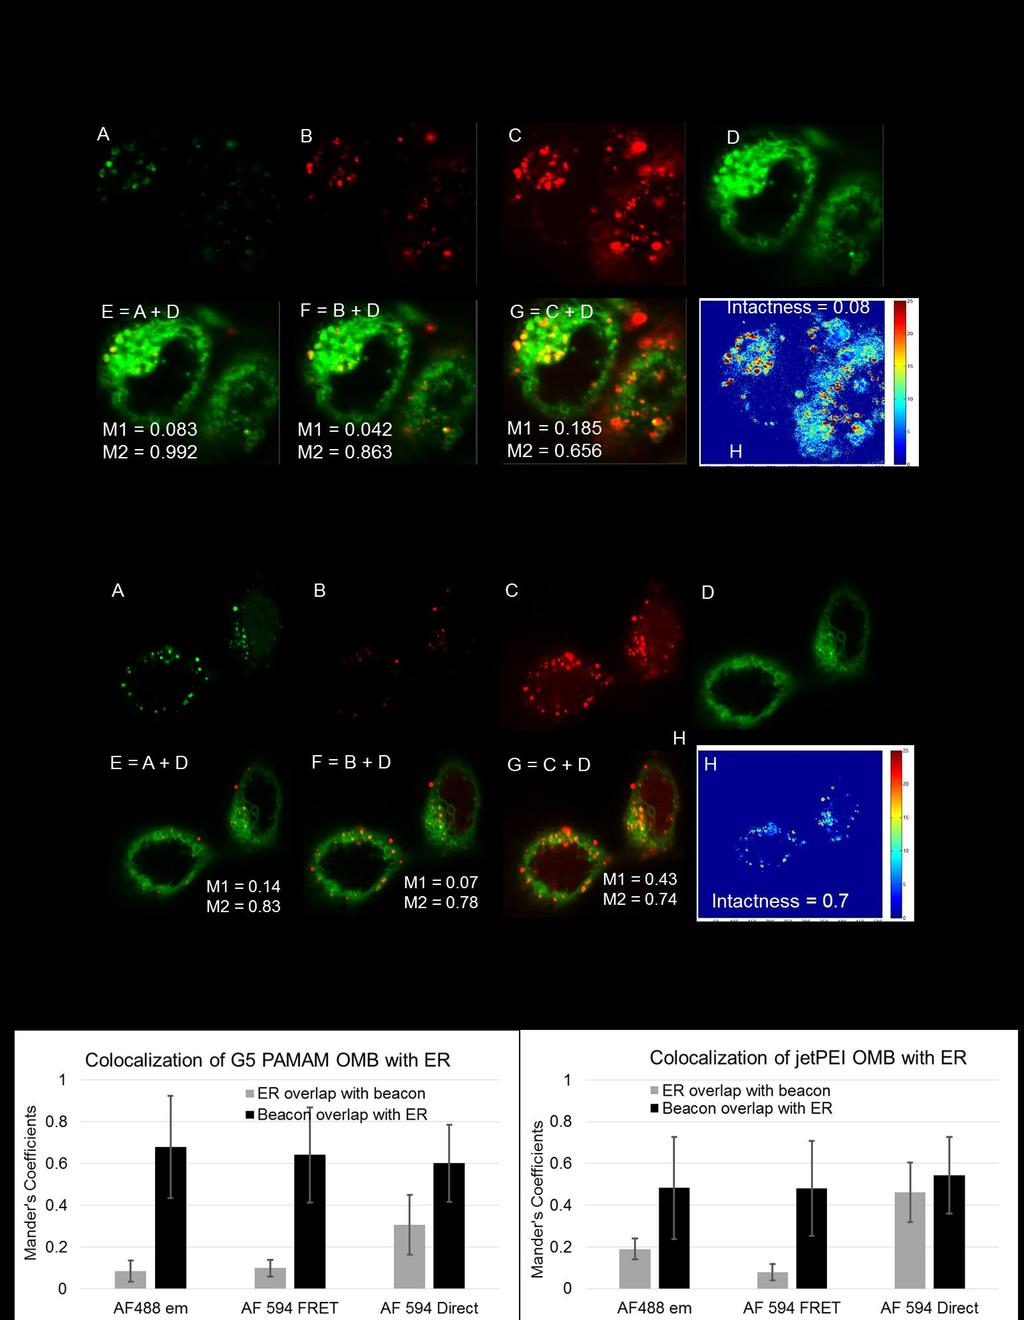
9 Figure S10. OMB Degradation Over Time Studied Using Flow Cytometry. (a) HEK 293A cells exposed for 30 minutes to either G5 PAMAM or jet PEI polyplexes (N:P 10:1) formed using 0.5 g of oligonucleotide molecular beacon and 0.5 g blank pdna. The x-axis shows fluorescence emission ( nm) upon 488 nm excitation. The y-axis shows the FRET fluorescence emission ( nm) signal upon 488 nm excitation. OMBs delivered using jetpei show less AF594 FRET emission than beacons delivered using G5 PAMAM. (b) HEK293A cells exposed to G5 PAMAM or jetpei polyplexes for 3 h in serum free media followed by 1 h incubation in complete media. OMBs delivered using jetpei show less AF594 FRET emission than beacons delivered using G5 PAMAM. (c) HEK293A cells exposed to G5 PAMAM or jetpei polyplexes for 3 h in serum free media followed by 13 h incubation in complete media. OMBs delivered using jetpei show less AF594 FRET emission than beacons delivered using G5 PAMAM. Colocalization of OMB with Organelle Markers In order to test if there were differences in the amount of intact OMB present in the endoplasmic reticulum (ER) and Golgi apparatus, we stained cells using organelle markers for ER (ER tracker blue) and Golgi apparatus (wheat germ agglutinin-af 350, WGA). Figures S11 and S12 illustrate the colocalization of beacons with ER tracker blue and WGA. Colocalization was quantified using Mander s coefficients combined with manual thresholds to ensure that background noise did not confound colocalization coefficients. 10 M1 (fraction of organelle markers that overlap with OMB) and M2 (fraction of OMB that overlap with the organelle marker) have been calculated for both FRET signal (intact beacons) and AF488 or AF594 signal by direct excitation (the sum of intact and cleaved beacons). Since the organelle markers are widespread, a higher fraction of beacon signal was colocalized with the organelle markers. Hence, M2 was greater than M1 for all cases. We observed that the colocalization of OMB with ER was higher than the colocalization with the Golgi for both L- PEI and G5 PAMAM polyplexes. Two sample t-test was used to test if the colocalization of the OMB delivered using jetpei and G5 PAMAM with organelle markers were significantly different. The results are presented in tables I and II. The experiments are designed such that a 2 fold difference in colocalization can be detected with a power greater than 0.8. In cases where the t-test showed a significant difference in colocalization of OMB, the power was 0.8. For cases where the means were not significantly different, the power was lower.
10
11 Figure S11: Colocalization of OMB with ER tracker blue (a) Images A-D show the signal from beacons and ER tracker respectively for beacons delivered using G5 PAMAM. Images E-G show the overlay of A, B and C with D. (b) Images show the signal from the beacons and ER for beacons delivered using jetpei. For beacons delivered using both jetpei and G5 PAMAM, a large fraction of intact (B) and cleaved beacons (A) are distributed close to the ER (D) as indicated by the Mander s coefficients (M2). JetPEI beacons also show a diffuse distribution throughout the cell. (c) Since the diffuse beacons do not colocalize with ER, the average Mander s coefficients presented in B for jetpei beacons are less than the average Mander s coefficients presented for G5 PAMAM beacons in A. Table I: Colocalization of OMB with ER tracker AF 488 AF594 FRET AF594 direct M p value power M pvalue power

12
 Images show the signal from the beacons and ER for beacons delivered using jetpei.")
 For both G5 PAMAM polyplexes and jetpei polyplexes, the fraction of beacons overlapping with golgi signal were less than the average fraction of beacons overlapping with ER tracker.")
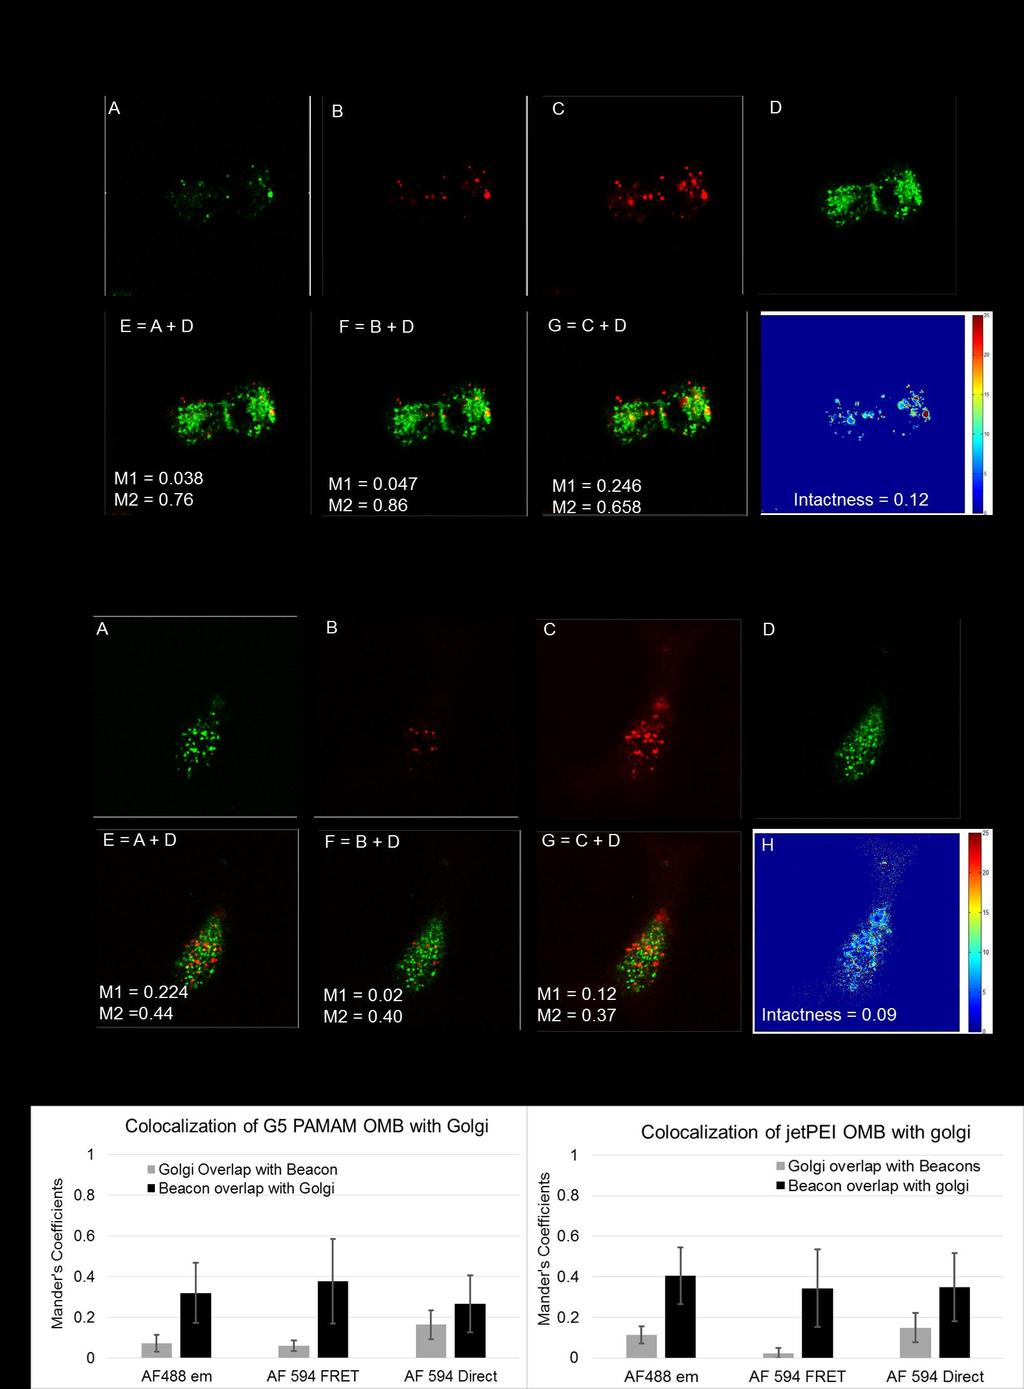
13 Figure S12: Colocalization of OMB with golgi stain (WGA-AF350)(a) Images A-D show the signal from beacons and wheat germ agglutinin (golgi marker) respectively for beacons delivered using G5 PAMAM. Images E-G show the overlay of A, B and C with D. (b) Images show the signal from the beacons and ER for beacons delivered using jetpei. More overlap is seen between the beacon and and wheat germ agglutinin (golgi marker) for jetpei polyplexes. (c) For both G5 PAMAM polyplexes and jetpei polyplexes, the fraction of beacons overlapping with golgi signal were less than the average fraction of beacons overlapping with ER tracker. Interestingly, the fraction of beacons overlapping with golgi was less for jetpei polyplexes than G5 PAMAM polyplexes. Table II: Colocalization of OMB with WGA AF 488 AF594 FRET AF594 direct M < p value power M pvalue power Figure S13. Fluorescence images from Figure 3a-d overlaid with transmitted light images to show cell boundaries. For all cases, majority of the fluorescence was confined within cells.


14 Figure S14: Fluorescence images from Figure 4a-f overlaid with transmitted light images to show cell boundaries. For both cases, majority of the fluorescence was confined within cells.
 showed gene expression.(b) Adding L-PEI to cells treated with G5 PAMAM polyplexes resulted in increased genen expression.")
15 Figure S15: Summary of experiments that tested GFP expression in cells. (a) 60-80% of HEK 293A cells treated with L-PEI polyplexes (N:P = 10) showed GFP expression. Under 5% of cells treated with G5 PAMAM polyplexes (N:P = 10) showed gene expression.(b) Adding L-PEI to cells treated with G5 PAMAM polyplexes resulted in increased genen expression. (c) Lipofectamine only increased expression dramatically if co-incubated with G5 PAMAM polyplexes. (d) Adding extra G5 PAMAM does not increase gene expression. References: 1. Rattan, R. et al. Polyplex-Induced Cytosolic Nuclease Activation Leads to Differential Transgene Expression. Mol. Pharm. 10, (2013). 2. Ribeiro, S. C., Monteiro, G. A. & Prazeres, D. M. F. The role of polyadenylation signal secondary structures on the resistance of plasmid vectors to nucleases. J. Gene Med. 6, (2004). 3. Azzoni, A. R., Ribeiro, S. C., Monteiro, G. A. & Prazeres, D. M. F. The impact of polyadenylation signals on plasmid nuclease-resistance and transgene expression. J. Gene Med. 9, (2007).
16 4. ur Rehman, Z. et al. On the Mechanism of Polyplex-and Lipoplex-Mediated Delivery of Nucleic Acids: Real-Time Visualization of Transient Membrane Destabilization Without Endosomal Lysis. ACS Nano 7, (2013). 5. Itaka, K. et al. In situ single cell observation by fluorescence resonance energy transfer reveals fast intracytoplasmic delivery and easy release of plasmid DNA complexed with linear polyethylenimine. J. Gene Med. 6, (2004). 6. Matovina, M., Seah, N., Hamilton, T., Warren, D. & Landy, A. Stoichiometric incorporation of base substitutions at specific sites in supercoiled DNA and supercoiled recombination intermediates. Nucleic Acids Res. 38, e175 (2010). 7. Luzzietti, N., Knappe, S., Richter, I. & Seidel, R. Nicking enzyme-based internal labeling of DNA at multiple loci. Nat. Protoc. 7, (2012). 8. Lee, W., von Hippel, P. H. & Marcus, A. H. Internally labeled Cy3/Cy5 DNA constructs show greatly enhanced photo-stability in single-molecule FRET experiments. Nucleic Acids Res. 42, (2014). 9. Zal, T. & Gascoigne, N. R. J. Photobleaching-Corrected FRET Efficiency Imaging of Live Cells. Biophys. J. 86, (2004). 10. Bolte, S. & Cordelieres, F. P. A guided tour into subcellular colocalization analysis in light microscopy. J. Microsc. 224, (2006).
Supplementary Information
 Supplementary Information Self-assembled Messenger RNA Nanoparticles (mrna-nps) for Efficient Gene Expression Hyejin Kim 1, Yongkuk Park 1 and Jong Bum Lee 1, * 1 Department of Chemical Engineering, University
Agarose Gel Electrophoresis of DNA. By: Sahar alsubaie
 Agarose Gel Electrophoresis of DNA By: Sahar alsubaie principle : Agarose Gel Electrophoresis uses electrical field to separate macromolecules (DNA and Protein) that differ in size, charge and configuration.
Lecture Four. Molecular Approaches I: Nucleic Acids
 Lecture Four. Molecular Approaches I: Nucleic Acids I. Recombinant DNA and Gene Cloning Recombinant DNA is DNA that has been created artificially. DNA from two or more sources is incorporated into a single
ALP (alkaline phosphatase) calibrators were analyzed manually in microtiter plates to find the linearity range by following this protocol:
 calibrators were analyzed manually in microtiter plates to find the linearity range by following this protocol:") Exam Mol 3008 May 2009 Subject 1 (15p) ALP (alkaline phosphatase) calibrators were analyzed manually in microtiter plates to find the linearity range by following this protocol: Reaction solutions: 50
Exam Mol 3008 May 2009 Subject 1 (15p) ALP (alkaline phosphatase) calibrators were analyzed manually in microtiter plates to find the linearity range by following this protocol: Reaction solutions: 50
Nature Biotechnology: doi: /nbt Supplementary Figure 1
 Supplementary Figure 1 High dynamic range (HDR) imaging of live cells with spinning disk confocal microscopy. During image acquisition, z-sections, encompassing most of the cellular volume, are captured
Manipulation of Purified DNA
 Manipulation of Purified DNA To produce the recombinant DNA molecule, the vector, as well as the DNA to be cloned, must be cut at specific points and then joined together in a controlled manner by DNA
Duplex-specific nuclease
 Innovative Biotechnology Company www.evrogen.com Duplex-specific nuclease Product Cat.# Size Duplex-specific nuclease, lyophilized EA1 5 units* Duplex-specific nuclease, lyophilized EA2 units* Duplex-specific
XactEdit Cas9 Nuclease with NLS User Manual
 XactEdit Cas9 Nuclease with NLS User Manual An RNA-guided recombinant endonuclease for efficient targeted DNA cleavage Catalog Numbers CE1000-50K, CE1000-50, CE1000-250, CE1001-250, CE1001-1000 Table of
Plasmids. BIL 333 Lecture I. Plasmids. Useful Plasmids. Useful Plasmids. Useful Plasmids. ( Transfection ) v Small, circular, double-stranded DNA
 v Small, circular, double-stranded DNA") BIL 333 Lecture I Plasmids v Small, circular, double-stranded DNA v Exogenous to genome! v Origin of Replication v Marker Gene v ( Reporter Gene ) Plasmids v Marker Gene Changes Phenotype Of Host v (Antibiotic
BIL 333 Lecture I Plasmids v Small, circular, double-stranded DNA v Exogenous to genome! v Origin of Replication v Marker Gene v ( Reporter Gene ) Plasmids v Marker Gene Changes Phenotype Of Host v (Antibiotic
D e c N o. 2 8
 D e c. 2 0 0 7 N o. 2 8 CONFOCAL APPLICATION LETTER resolution FRET Acceptor Photobleaching LAS AF Application Wizard FRET with Leica TCS SP5 LAS AF Version 1.7.0 Introduction Fluorescence Resonance Energy
User Manual. Topoisomerase I Assay Kit (plasmid based). Lot Number:
. Lot Number:") Copyright TopoGEN, Inc., 2012. All rights reserved. User Manual Topoisomerase I Assay Kit (plasmid based). Catalog Number Catalog Number TG1015-1 100 Reaction Set TG1015-2 250 Reaction Set Lot Number:
Copyright TopoGEN, Inc., 2012. All rights reserved. User Manual Topoisomerase I Assay Kit (plasmid based). Catalog Number Catalog Number TG1015-1 100 Reaction Set TG1015-2 250 Reaction Set Lot Number:
Gene therapy has gained significant attention over the past two decades as a potential method for treating genetic disorders such as severe combined
 Abstract Gene therapy has gained significant attention over the past two decades as a potential method for treating genetic disorders such as severe combined immunodeficiency, cystic fibrosis, and Parkinson
Module1TheBasicsofRealTimePCR Monday, March 19, 2007
 Objectives Slide notes: Page 1 of 41 Module 1: The Basics Of Real Time PCR Slide notes: Module 1: The Basics of real time PCR Page 2 of 41 Polymerase Chain Reaction Slide notes: Here is a review of PCR,
Quantitative Real time PCR. Only for teaching purposes - not for reproduction or sale
 Quantitative Real time PCR PCR reaction conventional versus real time PCR real time PCR principles threshold cycle C T efficiency relative quantification reference genes primers detection chemistry GLP
SURFACE ENHANCED RAMAN SCATTERING NANOPARTICLES AS AN ALTERNATIVE TO FLUORESCENT PROBES AN EVALUATION
 APPLICATION NOTE SURFACE ENHANCED RAMAN SCATTERING NANOPARTICLES AS AN ALTERNATIVE TO FLUORESCENT PROBES AN EVALUATION Summary: Interest in using nanoparticles specifically, Surface Enhanced Raman Scattering
Supplementary Figure 1. APP cleavage assay. HEK293 cells were transfected with various
 Supplementary Figure 1. APP cleavage assay. HEK293 cells were transfected with various GST-tagged N-terminal truncated APP fragments including GST-APP full-length (FL), APP (123-695), APP (189-695), or
SUPPLEMENTARY INFORMATION
 doi:10.1038/nature11988 Supplementary Figure 1. Digestion of model DNA substrates. a, Linearized plasmid DNA (pik31- PstI, lanes 1 and 2), supercoiled plasmid (pik31, lanes 3 and 4), singly nicked plasmid
Temporally Monitoring Autophagy
 Supporting Information An In Situ Intracellular Self-Assembly Strategy for Quantitatively and Temporally Monitoring Autophagy Yao-Xin Lin,, Sheng-Lin Qiao,, Yi Wang,, Ruo-Xin Zhang, Hong-Wei An,, Yang
sirna delivery systems: lipoplexes vs. polyplexes
 sirna delivery systems: lipoplexes vs. polyplexes Preeti Yadava College of Pharmacy, University of Florida, Gainesville, Florida GPEN 2006 What is RNA interference? RNAi is the natural process of sequencespecific,
SUPPLEMENTARY INFORMATION
 doi:10.1038/nature10016 Supplementary discussion on binding site density for protein complexes on the surface: The density of biotin sites on the chip is ~10 3 biotin-peg per µm 2. The biotin sites are
Supplementary Information
 4(R/S)-Guanidinylprolyl collagen peptides: On-resin synthesis, complexation with plasmid DNA and the role of peptides in enhancement of transfection Manaswini Nanda, Krishna N. Ganesh,* Chemical Biology
Confocal Microscopy Analyzes Cells
 Choosing Filters for Fluorescence A Laurin Publication Photonic Solutions for Biotechnology and Medicine November 2002 Confocal Microscopy Analyzes Cells Reprinted from the November 2002 issue of Biophotonics
HYPERSPECTRAL MICROSCOPE PLATFORM FOR HIGHLY MULTIPLEX BIOLOGICAL IMAGING. Marc Verhaegen
 HYPERSPECTRAL MICROSCOPE PLATFORM FOR HIGHLY MULTIPLEX BIOLOGICAL IMAGING Marc Verhaegen CMCS, MONTREAL, MAY 11 th, 2017 OVERVIEW Hyperspectral Imaging Multiplex Biological Imaging Multiplex Single Particle
Optimizing crna fragmentation for microarray experiments using the Agilent 2100 bioanalyzer. Application Deborah Vitale.
 Optimizing crna fragmentation for microarray experiments using the Agilent 2100 bioanalyzer Application Deborah Vitale Introduction Oligonucleotide arrays are a powerful tool for gene expression studies.
Supporting Information Defined Bilayer Interactions of DNA Nanopores Revealed with a Nuclease-Based Nanoprobe Strategy
 Supporting Information Defined Bilayer Interactions of DNA Nanopores Revealed with a Nuclease-Based Nanoprobe Strategy Jonathan R. Burns* & Stefan Howorka* 1 Contents 1. Design of DNA nanopores... 3 1.1.
Combining Techniques to Answer Molecular Questions
 Combining Techniques to Answer Molecular Questions UNIT FM02 How to cite this article: Curr. Protoc. Essential Lab. Tech. 9:FM02.1-FM02.5. doi: 10.1002/9780470089941.etfm02s9 INTRODUCTION This manual is
Special Techniques 1. Mark Scott FILM Facility
 Special Techniques 1 Mark Scott FILM Facility SPECIAL TECHNIQUES Multi-photon microscopy Second Harmonic Generation FRAP FRET FLIM In-vivo imaging TWO-PHOTON MICROSCOPY Alternative to confocal and deconvolution
Supporting Information
 Electronic Supplementary Material (ESI) for Materials Chemistry Frontiers. This journal is the Partner Organisations 2017 Supporting Information Supramolecular Conjugated Polymer Materials for Organelle
A Quick-responsive DNA Nano-Device for Bio-molecular Homeostasis Regulation
 Supplementary Information A Quick-responsive DNA Nano-Device for Bio-molecular Homeostasis Regulation Songlin Wu, Pei Wang, Chen Xiao, Zheng Li, Bing Yang, Jieyang Fu, Jing Chen, Neng Wan, Cong Ma, Maoteng
Agarose gel electrophoresis of DNA fragments
 Agarose gel electrophoresis of DNA fragments Page 1 of 5 (Maniatis, Sambrook, BioWhittaker catalogue) Method: DNA in solution has a net negative charge due to its phosphate backbone (at the ph used during
Chapter One. Construction of a Fluorescent α5 Subunit. Elucidation of the unique contribution of the α5 subunit is complicated by several factors
 4 Chapter One Construction of a Fluorescent α5 Subunit The significance of the α5 containing nachr receptor (α5* receptor) has been a challenging question for researchers since its characterization by
Real-Time PCR Principles and Applications
 Real-Time PCR Principles and Applications Dr Esam Ibraheem Azhar (BSc, MSc, Ph.D Molecular Medical Virology) Asst. Prof. Medical Laboratory Technology Department Objectives Real-Time PCR Principles and
Supporting Information for
 Supporting Information for Building Electromagnetic Hot Spots in Living Cells via Target-Triggered Nanoparticle Dimerization Wen Zhou, 1,2 Qiang Li, 1 Huiqiao Liu, 1 Jie Yang, 1 Dingbin Liu 1,2 * 1. College
Grb2-Mediated Alteration in the Trafficking of AβPP: Insights from Grb2-AICD Interaction
 Journal of Alzheimer s Disease 20 (2010) 1 9 1 IOS Press Supplementary Material Grb2-Mediated Alteration in the Trafficking of AβPP: Insights from Grb2-AICD Interaction Mithu Raychaudhuri and Debashis
Positive control kit for enzymatic mismatch cleavage and agarose gel visualization (version 2.4)
") 28 January, 2010 Positive control kit for enzymatic mismatch cleavage and agarose gel visualization (version 2.4) Plant Breeding Unit Brad Till and Owen Huynh January, 2010 Kit Contents: Genomic DNA from
28 January, 2010 Positive control kit for enzymatic mismatch cleavage and agarose gel visualization (version 2.4) Plant Breeding Unit Brad Till and Owen Huynh January, 2010 Kit Contents: Genomic DNA from
SUPPLEMENTARY INFORMATION
 doi: 10.1038/nature08627 Supplementary Figure 1. DNA sequences used to construct nucleosomes in this work. a, DNA sequences containing the 601 positioning sequence (blue)24 with a PstI restriction site
7.13 Experimental Microbial Genetics
 MIT OpenCourseWare http://ocw.mit.edu 7.13 Experimental Microbial Genetics Fall 2008 For information about citing these materials or our Terms of Use, visit: http://ocw.mit.edu/terms. 7.13 Fall 2008 Page
Bootcamp: Molecular Biology Techniques and Interpretation
 Bootcamp: Molecular Biology Techniques and Interpretation Bi8 Winter 2016 Today s outline Detecting and quantifying nucleic acids and proteins: Basic nucleic acid properties Hybridization PCR and Designing
FLUORESCENCE. Matyas Molnar and Dirk Pacholsky
 FLUORESCENCE Matyas Molnar and Dirk Pacholsky 1 Information This lecture contains images and information from the following internet homepages http://micro.magnet.fsu.edu/primer/index.html http://www.microscopyu.com/
Imaging Nucleic Acid Gels on the Odyssey Fc Imager
 Imaging Nucleic Acid Gels on the Odyssey Fc Imager Developed for: Odyssey Fc Imaging System Published September 2011. The most recent version of this protocol is posted at: http://biosupport.licor.com
Electronic Supplementary Information
 Electronic Supplementary Information FRET-based probing to gain direct information on sirna sustainability in live cells: Asymmetric degradation of sirna strands Seonmi Shin, a Hyun-Mi Kwon, b Kyung-Sik
BIOLOGY 163 LABORATORY. RESTRICTION MAPPING OF PLASMID DNA (Revised Fall 2017)
") BIOLOGY 163 LABORATORY RESTRICTION MAPPING OF PLASMID DNA (Revised Fall 2017) Physical mapping of genomes is an important part of modern molecular genetics. As it's name implies, physical mapping seeks
BIOLOGY 163 LABORATORY RESTRICTION MAPPING OF PLASMID DNA (Revised Fall 2017) Physical mapping of genomes is an important part of modern molecular genetics. As it's name implies, physical mapping seeks
SUPPLEMENTARY INFORMATION
 A biomimetic DNA-based channel for the ligand-controlled transport of charged molecular cargo across a biological membrane Jonathan R. Burns, Astrid Seifert, Niels Fertig, Stefan Howorka NATURE NANOTECHNOLOGY
Fluorescence Light Microscopy for Cell Biology
 Fluorescence Light Microscopy for Cell Biology Why use light microscopy? Traditional questions that light microscopy has addressed: Structure within a cell Locations of specific molecules within a cell
Super Resolution Imaging Solution Provider. Imaging Future
 Super Resolution Imaging Solution Provider Imaging Future Imaging Solution More Than Equipment NanoBioImaging(NBI) is the Industrial Partner of HKUST Super Resolution Imaging Center (SRIC). NBI aims to
SUPPORTING INFORMATION
 Electronic Supplementary Material (ESI) for Dalton Transactions. This journal is The Royal Society of Chemistry 2015 Terbium-Based Time-Gated Förster Resonance Energy Transfer Imaging for Evaluating Protein-Protein
Supplementary Figure 1. Thin layer chromatography of R18 salts with different counterions. The mobility of the R18 salts with TPB counterions is much
 Supplementary Figure 1. Thin layer chromatography of R18 salts with different counterions. The mobility of the R18 salts with TPB counterions is much higher with perchlorate, showing their much higher
Self-labelling enzymes as universal tags for fluorescence microscopy, superresolution microscopy and electron microscopy
 Supplementary Materials Self-labelling enzymes as universal tags for fluorescence microscopy, superresolution microscopy and electron microscopy Viktoria Liss, Britta Barlag, Monika Nietschke and Michael
DNA Restriction Digestion Analysis
 PR041 G-Biosciences 1-800-628-7730 1-314-991-6034 technical@gbiosciences.com A Geno Technology, Inc. (USA) brand name DNA Restriction Digestion Analysis Teacher s Guidebook (Cat. # BE-307) think proteins!
catalytic hairpin DNA assembly for dual-signal amplification toward homogenous analysis of protein and
 Electronic Supplementary Material (ESI) for ChemComm. This journal is The Royal Society of Chemistry 2015 Supporting Information Programmable Mg 2+ -dependent DNAzyme switch by the catalytic hairpin DNA
BIBC 103 Letter Grade Credit by Examination. Student Information Sheet
 BIBC 103 Letter Grade Credit by Examination Student Information Sheet This exam is a comprehensive test of the concepts, skills, competencies learned in the BIBC 103 (Biochemical Techniques) course. It
Real Time PCR. Advanced Biotechnology Lab I Florida Atlantic University April 2, 2008
 Real Time PCR Advanced Biotechnology Lab I Florida Atlantic University April 2, 2008 Introduction We wish to compare the expression levels of our gene under study (Drosophila MsrA) for two different treatment
Title: Understanding the impact of orientation on gene expression of lux operon in pkn800 transformation into Escherichia coli DH5α
 Seim - 1 Name: Darian Seim Title: Understanding the impact of orientation on gene expression of lux operon in pkn800 transformation into Escherichia coli DH5α Date: April 12 th, 2016 April 18 th, 2016
DNA Coated Gold Nanoshells for Laser Induced Antisense Drug Release in Cells
 DNA Coated Gold Nanoshells for Laser Induced Antisense Drug Release in Cells Marcus Rosario Mentor Gary Braun Dr. Norbert Reich National Institutes of Health Ventura College Molecular Biology The Big Picture
Viral RNAi suppressor reversibly binds sirna to. outcompete Dicer and RISC via multiple-turnover
 Supplementary Data Viral RNAi suppressor reversibly binds sirna to outcompete Dicer and RISC via multiple-turnover Renata A. Rawlings 1,2, Vishalakshi Krishnan 2 and Nils G. Walter 2 * 1 Biophysics and
Supplemental Materials and Methods
 Supplemental Materials and Methods Proteins and reagents Proteins were purified as described previously: RecA, RecQ, and SSB proteins (Harmon and Kowalczykowski 1998); RecF protein (Morimatsu and Kowalczykowski
Supplementary Figure 1 Telomerase RNA fragments used in single-molecule FRET experiments. A pseudoknot fragment (nts ) labeled at position U42
 labeled at position U42") Supplementary Figure 1 Telomerase RNA fragments used in single-molecule FRET experiments. A pseudoknot fragment (nts 32-195) labeled at position U42 with Cy3 (green circle) was constructed by a two piece
Supplementary Figure 1 Telomerase RNA fragments used in single-molecule FRET experiments. A pseudoknot fragment (nts 32-195) labeled at position U42 with Cy3 (green circle) was constructed by a two piece
Reviewer #1 (Remarks to the Author):
:") Reviewer #1 (Remarks to the Author): This manuscript describes a novel application of dye-labeled DNA-conjugated AuNPs in visualizing intracellular transport within living cells. The most important result
Reviewer #1 (Remarks to the Author): This manuscript describes a novel application of dye-labeled DNA-conjugated AuNPs in visualizing intracellular transport within living cells. The most important result
Contact Details. Dr Alexander Galkin. Office: MBC Room 186. Tel: (028) Frequency and wavelength.
 Frequency and wavelength.") Contact Details The electromagnetic spectrum Biological Spectroscopy Dr Alexander Galkin Email: a.galkin@qub.ac.uk Dr Alexander Galkin MSc Biomolecular Function - BBC8045 Office: MBC Room 186 Tel: (028)
Contact Details The electromagnetic spectrum Biological Spectroscopy Dr Alexander Galkin Email: a.galkin@qub.ac.uk Dr Alexander Galkin MSc Biomolecular Function - BBC8045 Office: MBC Room 186 Tel: (028)
Report on the Verification of Performance of a DNA Extraction Method for Maize Grains
 Report on the Verification of Performance of a DNA Extraction Method for Maize Grains 7 September 2007 Joint Research Centre Institute for Health and Consumer Protection Biotechnology & GMOs Unit Method
Molecular Cell Biology - Problem Drill 11: Recombinant DNA
 Molecular Cell Biology - Problem Drill 11: Recombinant DNA Question No. 1 of 10 1. Which of the following statements about the sources of DNA used for molecular cloning is correct? Question #1 (A) cdna
#FD µl (for 200 rxns) Expiry Date: Description. 1 ml of 10X FastDigest Green Buffer. Store at -20 C
 Expiry Date: Description. 1 ml of 10X FastDigest Green Buffer. Store at -20 C") PRODUCT INFORMATION Thermo Scientific FastDigest SalI #FD0644 Lot: 5'...G T C G A C...3' 3'...C A G C T G...5' Supplied with: Store at -20 C 200 µl (for 200 rxns) Expiry Date: BSA included www.thermoscientific.com/onebio
PRODUCT INFORMATION Thermo Scientific FastDigest SalI #FD0644 Lot: 5'...G T C G A C...3' 3'...C A G C T G...5' Supplied with: Store at -20 C 200 µl (for 200 rxns) Expiry Date: BSA included www.thermoscientific.com/onebio
Mission (Im)possible: Plasmid Mapping Student Materials
possible: Plasmid Mapping Student Materials") Mission (Im)possible: Plasmid Mapping Student Materials Introduction... 2 Pre-Lab Questions... 6 Lab Protocol... 7 Data Collection Worksheet... 11 Post-Lab Questions and Analysis... 12 Last updated: August
Mission (Im)possible: Plasmid Mapping Student Materials Introduction... 2 Pre-Lab Questions... 6 Lab Protocol... 7 Data Collection Worksheet... 11 Post-Lab Questions and Analysis... 12 Last updated: August
Masayoshi Honda, Jeehae Park, Robert A. Pugh, Taekjip Ha, and Maria Spies
 Molecular Cell, Volume 35 Supplemental Data Single-Molecule Analysis Reveals Differential Effect of ssdna-binding Proteins on DNA Translocation by XPD Helicase Masayoshi Honda, Jeehae Park, Robert A. Pugh,
Illumatool ΤΜ Tunable Light System: A Non-Destructive Light Source For Molecular And Cellular Biology Applications. John Fox, Lightools Research.
 Illumatool ΤΜ Tunable Light System: A Non-Destructive Light Source For Molecular And Cellular Biology Applications. John Fox, Lightools Research. Fluorescent dyes and proteins are basic analytical tools
Answer sheet. Student number:
 Page 1 of 9 MIDTERM EXAM OF BIO/BPS3151 2016 Answer sheet Name: Student number: Part II: Calculations 1 128g 2 58.5g 3 NaCl: 1L Water: 0.2L 4 2.5 g/l 5 0.4 6 1:4:2 7 900 ml 8 Plasmid A: 3.75 µl Plasmid
Technical Review. Real time PCR
 Technical Review Real time PCR Normal PCR: Analyze with agarose gel Normal PCR vs Real time PCR Real-time PCR, also known as quantitative PCR (qpcr) or kinetic PCR Key feature: Used to amplify and simultaneously
Supplementary Table 1. Oligonucleotide sequences used in the study
 Supplementary Table 1. Oligonucleotide sequences used in the study Oligonucleotides Sequences (5 3 ) Substrate strand Lock -4 Lock -5 Lock -6 Lock -7 Free control DNAzyme DNAzyme strand linked to AuNP
Chapter 4. the biological community to assay for protein-protein interactions. FRET describes the
 31 Chapter 4 Determination of nachr stoichiometry using Normalized Försters Resonance Energy Transfer (NFRET) Försters resonance energy transfer (FRET) has become a technique widely used in the biological
Deformation and poration of lipid bilayer membranes by cationic nanoparticles
 Deformation and poration of lipid bilayer membranes by cationic nanoparticles Su Li and Noah Malmstadt Mork Family Department of Chemical Engineering and Materials Science, University of Southern California,
Characterizing Phenotypes of Bacteria by Staining Method
 Experiment 3 Laboratory to Biology III Diversity of Microorganisms / Wintersemester / page 1 Experiment 3 Characterizing Phenotypes of Bacteria by Staining Method Advisor NN Reading Chapters in BBOM 9
Only for teaching purposes - not for reproduction or sale
 PCR reaction conventional versus real time PCR real time PCR principles threshold cycle C T efficiency relative quantification reference genes primers detection chemistry GLP in real time PCR Relative
Supporting Information
 Supporting Information Wiley-VCH 2014 69451 Weinheim, Germany Complex Reconfiguration of DNA Nanostructures** Bryan Wei,* Luvena L. Ong, Jeffrey Chen, Alexander S. Jaffe, and Peng Yin* ange_201402437_sm_miscellaneous_information.pdf
Supplementary Figure 1: Two modes of low concentration of BsSMC on a DNA (a) Protein staining (left) and fluorescent imaging of Cy3 (right) confirm
 Protein staining (left) and fluorescent imaging of Cy3 (right) confirm") Supplementary Figure 1: Two modes of low concentration of BsSMC on a DNA (a) Protein staining (left) and fluorescent imaging of Cy3 (right) confirm that BsSMC was labeled with Cy3 NHS-Ester. In each panel,
Supplementary Figure 1: Two modes of low concentration of BsSMC on a DNA (a) Protein staining (left) and fluorescent imaging of Cy3 (right) confirm that BsSMC was labeled with Cy3 NHS-Ester. In each panel,
Supplementary Figure 1
 Supplementary Figure 1 (A) Schematic of sequential hybridization and barcoding. (B) Schematic of the FISH images of the cell. In each round of hybridization, the same spots are detected, but the dye associated
Characterizing Phenotypes of Bacteria by Staining Method
 Experiment 3 Laboratory to Biology III Diversity of Microorganisms / Wintersemester / page 1 Experiment Characterizing Phenotypes of Bacteria by Staining Method Advisor Reading NN Chapters 3.1, 3.7, 3.8,
Microscopy from Carl Zeiss
 Microscopy from Carl Zeiss LSM 710 In Tune with Your Application Enjoy new freedom in selecting fluorescent dyes with In Tune, the new laser system for the LSM 710. Whatever the wavelength, you can match
Supplementary Figure 1, Wiel et al
 Supplementary Figure 1, Wiel et al Supplementary Figure 1 ITPR2 increases in benign tumors and decreases in aggressive ones (a-b) According to the Oncomine database, expression of ITPR2 increases in renal
DNA Restriction Digestion Analysis
 PR041 G-Biosciences 1-800-628-7730 1-314-991-6034 technical@gbiosciences.com A Geno Technology, Inc. (USA) brand name DNA Restriction Digestion Analysis Teacher s Guidebook (Cat. # BE 307) think proteins!
Isothermal amplification system based on template-dependent extension
 Electronic Supplementary Information (ESI) Isothermal amplification system based on template-dependent extension 1. Experimental Section The molecular beacon (Takara Biotechnology Co., Ltd. Dalian, China)
Supporting Information
 Supporting Information An Enzyme-Powered Three Dimensional DNA Nanomachine for DNA Walking, Payload Release, and Biosensing Xiaolong Yang, Yanan Tang, Sean D. Mason, Junbo Chen, Feng Li * Department of
Supplementary Figure 1. Botrocetin induces binding of human VWF to human
 Supplementary Figure 1: Supplementary Figure 1. Botrocetin induces binding of human VWF to human platelets in the absence of elevated shear and induces platelet agglutination as detected by flow cytometry.
How does electrophoresis work? The gel is made from agarose, DNA is a negative molecules, Molecules sort based on: Charge, Size, shape.
 Lab six:. Gel Electrophoresis: What is Gel Electrophoresis? Gel electrophoresis is a widely used technique for the analysis of nucleic acids and proteins. Agarose gel electrophoresis is routinely used
Importance of Molecular Genetics
 Molecular Genetic Importance of Molecular Genetics Genetics is playing an important role in the practice of clinical medicine. - Medical genetics involves any application of genetics to medical practice,
AP Biology: Unit 5: Development. Forensic DNA Fingerprinting: Using Restriction Enzymes Bio-Rad DNA Fingerprinting Kit
 Forensic DNA Fingerprinting: Using Restriction Enzymes Bio-Rad DNA Fingerprinting Kit Background: Scientists working in forensic labs are often asked to perform DNA profiling or fingerprinting to analyze
SUPPLEMENTARY INFORMATION
 Supplementary Figure 1 sirna and shrna mediated depletion of ATP7A results in loss of melanosomal ATP7A staining. a-h, sirna mediated ATP7A depletion. Immunofluorescence microscopy (IFM) analysis of ATP7A
Assessment of Polymer Wafer Aided Gene Transfection. Efficiency and Cell Viability
 Assessment of Polymer Aided Gene Transfection Efficiency and Cell Viability Noah Nathan, Samuel Hanson, Chun Wang Polymeric Materials Laboratory Department of Biomedical Engineering University of Minnesota
Live and Dead Cell Assay
 ab115347 Live and Dead Cell Assay Instructions for Use Differential fluorescent labeling of live and dead cells This product is for research use only and is not intended for diagnostic use. Last Updated
Chapter 10 Analytical Biotechnology and the Human Genome
 Chapter 10 Analytical Biotechnology and the Human Genome Chapter Outline Enzyme tests and biosensors DNA-based tests DNA analysis technologies Human genome and genome-based analytical methods 1 Enzyme-based
Nucleic acid-free silica-matrix: Regeneration of DNA binding columns
 MAXXBOND ready-to-use - Kit for the regeneration of DNA binding columns with pure silica matrices Product No. MB007 Nucleic acid-free silica-matrix: Regeneration of DNA binding columns efficient and easy
Quantitation of ssdna using OliGreen Fluorescent Stain
 Quantitation of ssdna using OliGreen Fluorescent Stain Several different techniques require the use of short synthetic oligonucleotide molecules, often referred to as primers. In each case, the use of
Transport of Potato Lipoxygenase into the Vacuole Larsen, Mia Kruse Guldstrand; Welinder, Karen Gjesing; Jørgensen, Malene
 Aalborg Universitet Transport of Potato Lipoxygenase into the Vacuole Larsen, Mia Kruse Guldstrand; Welinder, Karen Gjesing; Jørgensen, Malene Publication date: 2009 Document Version Publisher's PDF, also
THE JOURNAL OF CELL BIOLOGY
 Supplemental Material THE JOURNAL OF CELL BIOLOGY Yeung et al., http://www.jcb.org/cgi/content/full/jcb.200903020/dc1 Figure S1. Assessment of the surface charge of maturing phagosomes. (A C and F H) RAW
Lecture 5: 8/31. CHAPTER 5 Techniques in Protein Biochemistry
 Lecture 5: 8/31 CHAPTER 5 Techniques in Protein Biochemistry Chapter 5 Outline The proteome is the entire set of proteins expressed and modified by a cell under a particular set of biochemical conditions.
Background Figure 1: Dose response curves illustrating differences in the therapeutic index. A) A drug with a favorable therapeutic index does not
 A drug with a favorable therapeutic index does not") Background Figure 1: Dose response curves illustrating differences in the therapeutic index. A) A drug with a favorable therapeutic index does not induce toxicity at doses that achieve effective tumor
Background Figure 1: Dose response curves illustrating differences in the therapeutic index. A) A drug with a favorable therapeutic index does not induce toxicity at doses that achieve effective tumor
Cat. # MK600. For Research Use. ApopLadder Ex. Product Manual. v201608da
 Cat. # MK600 For Research Use ApopLadder Ex Product Manual Table of Contents I. Description... 3 II. Principle... 3 III. Features... 3 IV. Components... 3 V. Storage... 3 VI. Materials Required but not
BIO 315 Lab Exam I. Section #: Name:
 Section #: Name: Also provide this information on the computer grid sheet given to you. (Section # in special code box) BIO 315 Lab Exam I 1. In labeling the parts of a standard compound light microscope
Single-molecule real-time detection of telomerase extension activity
 Supplementary Information Single-molecule real-time detection of telomerase extension activity Helen Hwang 1, Patricia Opresko 2, Sua Myong 1,3,4,5 1. Bioengineering Department, University of Illinois
Single-molecule imaging of DNA curtains reveals intrinsic energy landscapes for nucleosome deposition
 SUPPLEMENTARY INFORMATION Single-molecule imaging of DNA curtains reveals intrinsic energy landscapes for nucleosome deposition Mari-Liis Visnapuu 1 and Eric C. Greene 1 1 Department of Biochemistry &